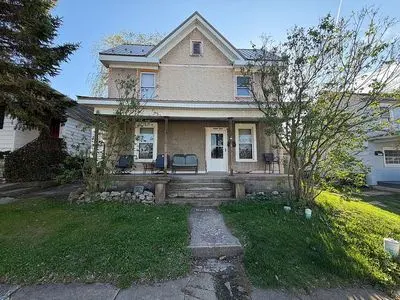
119 N 11th St · Philipsburg, PA
Flood risk 1/10 · Minimal
- FEMA flood zone
- X (unshaded)
- Chance of flooding over 30 yrs
- 0.0%
- Est. flood insurance / yr
- $473 – $860
Fire risk 3/10 · Minor
- Est. fire insurance / yr
- $511 – $949
Heat risk 3/10 · Minor
- Hot days now (above 92°F)
- 8 days/yr
- Hot days in 30 yrs
- 18 days/yr
Wind risk 2/10 · Minimal
- Chance of severe wind over 30 yrs
- —
Air-quality risk 2/10 · Minimal
- Unhealthy air days now
- 1 days/yr
- Unhealthy air days in 30 yrs
- 2 days/yr
Risk factors via First Street. Map © Google.
Why this score? — see what drove the C grade
The composite is a weighted blend of 9 inputs, each scored 0–100. Each bar is that input's sub-score; the figure is the points it added to the 100-point composite (weight × sub-score).
- Cash flow +18.6/30.0
- Appreciation +10.0/10.0
- ARV discount +7.5/15.0
- DSCR +5.9/10.0
- 1% rule +4.5/10.0
- Schools +3.9/10.0
- Livability +3.5/5.0
- Rent growth +2.5/5.0
- Condition / age +2.5/5.0
$168,500
🖨 Deal sheet 📄 Offer letter ✓ Due diligence
Listing remarks
Step into 119 N 11th Street, perfectly situated near great eateries, parks, and all the comforts that make Philipsburg feel like home. This 4-bedroom, 1-bath home offers easy living with first-floor laundry, a wood-burning fireplace, and two additional attic rooms that add flexibility for storage, hobbies, or extra space. Outside, enjoy the partially fenced-in yard, off-street parking, and a low-maintenance outdoor space complete with an electric-equipped shed. We & acirc; & euro; & trade; d love to show it to you in person and help you make it yours. For sale by owner. Buyers & acirc; & euro; & trade; realtors are welcome.
Key facts
- Off street parking
- First floor laundry
- Attic rooms
Tags
Neighborhood map
What this means for you Summary
Snapshot
- This is a 4-bed/1.0-bath other listed at $168k.
Deal economics
- At list price, monthly cash flow is $165 ($2k/yr) — positive.
- The deal already cash-flows at list — no discount required.
- To meet the 1% rule (rent ≥ 1% of price), the offer needs to be $159k (5.5% below list).
- Recommended offer: $159k (5.5% below list) — sets the bar for 1% rule.
Location & tenants
- Location reads 69/100 on livability (#851 in PA) — a middle-class / working-renter tenant base. Strengths: crime A+, cost of living A+, housing A+; Watch: amenities F, commute F, employment D-.
- Philipsburg-Osceola Area SD (town): math 42% / reading 52% proficiency, ranked #258 of 539 in PA (top 48%) — families likely to look elsewhere, expect single-tenant / working-renter base with shorter leases.
- Market conditions: 36 active listings in the ZIP; 399 units permitted in Centre County in 2024 (44 in 5+ unit buildings).
Forward outlook
- In year one you build about $18k of equity ($1k loan paydown + $17k appreciation (10.0% local appreciation)).
- Centre County population projected at +16% by 2050 — long-run rental-demand tailwind backs the buy-and-hold thesis.
- At projected returns (10.0% appreciation + 3.0% rent growth), your $47k cash investment doubles in ~3 years — after that, you're playing with house money.
- By year 3, paydown + projected appreciation supports a ~$46k cash-out refi (75% LTV) — recoverable capital for the next deal without selling this one.
Negotiation context
- Only 14 days on market — expect competitive offers; lowballing is unlikely to land.
- Current owner paid $22k; list at $168k implies a 684% gain — meaningful room to come down on a strong offer.
Risks & watch-outs
- Watch-outs: built in 1870 — expect roof / HVAC / electrical / plumbing capex.
Questions for the listing agent
- Built in 1870 — when were the roof, HVAC, electrical panel, plumbing, and water heater last replaced?
- Is there a deadline driving the sale (1031 exchange, divorce, estate, relocation)? That informs how much negotiation room exists.
- Schools are B-rated — typically a magnet for longer-tenancy family renters. What's the average tenant stay here, and is there a school-zone premium baked into asking?
- What's the average days-on-market for RENTAL listings here right now (not sales)? A rising rental-DOM trend means longer vacancies and softer asking-rent achievability than the comps imply.
- What's the recent tenant-quality profile in this submarket — average credit score on applications, eviction rate, late-payment / NSF rate, and stable-employment percentage? A property-management company in the area should have these aggregated.
- How much new for-sale + rental construction is in the pipeline within 1–3 miles? Heavy new supply typically softens prices + rents 12–24 months out; constrained supply supports both.
Investment metrics
- 1% rule
- 0.95% ✗
- Cap rate
- 7.47%
- Cash-on-cash
- 4.20%
- DSCR
- 1.19
- GRM
- 8.8
CMA / ARV
No comps found within radius.
Projected returns pro-forma
10.0% appreciation · 3.0% rent growth · sell at horizon
- IRR
- 27.3%
- Equity multiple
- 3.17×
- Total profit
- $102,255
- Equity at exit
- $151,798
- IRR
- 23.9%
- Equity multiple
- 7.21×
- Total profit
- $292,825
- Equity at exit
- $327,358
Cash invested: $47,180 (down + closing). Projections, not guarantees.
Landlord ↔ Tenant lean methodology
- Overall (STATE)
- 62 Landlord-Friendly
- State Pennsylvania
- 62 Landlord-Friendly · EVEN
- County
- — inherits STATE
- City
- — inherits STATE
ZIP-level market 16866
- Home prices YoY
- 12.0%
- Active inventory
- 36
- Price-to-rent
- 8.8×
Monthly cashflow live
- Estimated rent
- $1,593 medium interval (Pro) →
- Mortgage (P&I)
- −$884
- Tax from tax record
- −$139 /mo · $1,674/yr
- Insurance
- −$70
- HOA
- −$0
- Vacancy / Maint / Mgmt
- −$334
- Net cashflow
- $165
Break-even live
UW: 25.0% down · 7.5% · 30yr · 1.5% tax · 5.0% vac · 8.0% maint · 8.0% mgmt
Financing live
Cash to close
- Down payment
- $42,125
- Closing costs
- $5,055
- Reserves months
- —
- Total cash needed
- —
Loan-product check · same deal, 3 products live
Conventional
25% down · 7.5% · 30yr
- Down + closing
- —
- Monthly P&I
- —
- Monthly cashflow
- —
- DSCR
- —
- Eligible?
- —
Personal DTI + credit; lowest rate.
DSCR
20% down · 8.5% · 30yr
- Down + closing
- —
- Monthly P&I
- —
- Monthly cashflow
- —
- DSCR
- —
- Eligible?
- —
No personal income docs; deal must DSCR.
Hard money
10% down · 12.0% · 12mo
- Down + closing
- —
- Monthly P&I
- —
- Monthly cashflow
- —
- DSCR
- —
- Eligible?
- —
Short-term bridge; refi at stabilization.
Listing history 4 events
-
2026-05-12$168,500 Active 618-char remark
-
2013-04-25$45,000
-
2013-04-25historical
-
1983-02-28soldstatus $21,500
ⓘ Source: listings_history table (triggers on properties + properties_extension) + one-shot
backfill from property_details.listing_events for pre-trigger history.
Tax reassessment forecast PA · Partial reset (capped growth)
- Current annual tax
- $1,674 · $139/mo
- Projected year-2 tax
- $2,168 · $181/mo
- Expected delta
- +$494/yr (+$41/mo · 29.5%)
ⓘ Screening estimate from a state-policy table — verify with the county assessor before closing.
Climate risk First Street
- Flood 1/10 Low FEMA zone X (unshaded) · 0% chance over 30 yrs
- Wildfire 3/10 Moderate
- Heat 3/10 Moderate 8 d/yr ≥92°F today · 18 d/yr by 30 yrs out
- Wind 2/10 Low
- Air quality 2/10 Low 1 unhealthy d/yr today · 2 by 30 yrs out
Nearby sold comps map
Loading sold comps map…
Walkable amenities ~0.75 mi
Loading nearby amenities…
Taxation est. · year 1
- Rental income
- $19,113
- − Mortgage interest
- −$9,439
- − Property taxes
- −$1,674
- − Insurance
- −$842
- − Repairs & maintenance
- −$1,529
- − Management
- −$1,529
- − Depreciation
- −$4,902
- Taxable loss
- −$802
- Est. tax savings @ 24.0%
- +$192
- After-tax cash flow
- $2,172/yr
For passive investors: Depreciation is non-cash, so a rental often shows a tax loss while cash-flowing — sheltering income. Rental losses are passive: they offset passive income freely, and up to $25,000/yr can offset ordinary (W-2) income if you actively participate and your MAGI is under $100k (phasing out to $0 by $150k); unused losses carry forward. On sale, claimed depreciation is recaptured at up to 25%, and gains may owe capital-gains tax (a 1031 exchange can defer both). Figures are a year-1 estimate at your 24.0% rate — not tax advice; consult a CPA.
Schools (NCES district)
- District
- Philipsburg-Osceola Area SD
- NCES district ID
- 4219020
- Math proficiency
- 42% ▼ -9.00%
- Reading proficiency
- 52% ▼ -10.00%
- Median HH income
- $40,645
- Composite
- 39.37/100
- National rank
- #3977
- State rank
- #258 of 539 in PA
Livability — Philipsburg
- Score
- 69/100
- State rank
- #851
- US rank
- #8920
Category grades
Schools grade is shown separately in the Schools card above.
Census & demographics
- Census place
- Philipsburg, PA
- Population (ZIP)
- 8,924
Population outlook (Centre County) Hauer SSP2
- Today (2025)
- 177,113 people
- By 2030
- 185,138 · +4.5%
- By 2040
- 196,009 · +10.7%
- By 2050
- 205,070 · +15.8%
- By 2075
- 217,575 · +22.8%
- By 2100
- 230,649 · +30.2%
Race, ethnicity, and origin ACS 2023
- Neighborhood character
- Predominantly White (86%)
- Race & ethnicity
- White 86% Hispanic / Latino 6% Black 6% Two or more races 3%
- Hispanic origin (detail)
- Mexican 2% Dominican 1%
- Common ancestry
- Romanian 7% Slovak 2% Polish 1%
- Foreign-born
- 7% · Canada, Jamaica
- Languages at home
- 92% English-only · Spanish 6%
Political lean MEDSL · Centre
- 2024 margin
- Toss-up / Even · D 50.9% · R 48.1% · Other 1.0%
- 2008→2024 swing
- -9.0pp toward R · 2008: 11.8pp · 2024: 2.8pp
- All cycles
- 2024: D+2.8 2020: D+4.8 2016: D+1.9 2012: R+0.0 2008: D+11.8
Not yet ingested
- Civics
- —
Market trends
- HPI YoY
- ▲ 30.47%
- Current HPI
- 284.148
- Rent YoY
- —
- Metro
- —
- State GDP YoY
- ▲ 1.68%
- F500 in state
- 34
Industry mix (Fortune 500 HQ in PA)
| Industry | F500 HQs | Revenue |
|---|---|---|
| Healthcare | 2 | $309B |
|
||
| Insurance | 2 | $27B |
|
||
| Telecommunications / Media | 1 | $124B |
|
||
| Industrial Distribution | 1 | $22B |
|
||
| Financial Services | 1 | $20B |
|
||
| Chemicals / Materials | 1 | $18B |
|
||
Price history
+109.3% since first listed3 events — show timeline
- 2013-04-25 Listing Removed — BRIGHT MLS
- 2013-04-25 Listed $45,000 BRIGHT MLS
- 1983-02-28 Sold (Public Records) $21,500 Public Records
Property tax history
+1.2%/yrLatest (2026): $1,674 · +3.0% YoY. Source: county tax records.
Cash-flow waterfall
monthlySold comps — $/sqft
last 12 mo · ≤1 miLoading sold comps…