10001 W Frontage #224 · South Gate, CA
Flood risk 6/10 · Moderate
- FEMA flood zone
- X
- Chance of flooding over 30 yrs
- 0.74%
- Est. flood insurance / yr
- $507 – $1,088
Fire risk 1/10 · Minimal
- Est. fire insurance / yr
- $659 – $1,223
Heat risk 5/10 · Moderate
- Hot days now (above 92°F)
- 6 days/yr
- Hot days in 30 yrs
- 20 days/yr
Wind risk 1/10 · Minimal
- Chance of severe wind over 30 yrs
- —
Air-quality risk 6/10 · Moderate
- Unhealthy air days now
- 10 days/yr
- Unhealthy air days in 30 yrs
- 10 days/yr
Risk factors via First Street. Map © Google.
Why this score? — see what drove the C+ grade
The composite is a weighted blend of 9 inputs, each scored 0–100. Each bar is that input's sub-score; the figure is the points it added to the 100-point composite (weight × sub-score).
- Cash flow +30.0/30.0
- 1% rule +10.0/10.0
- DSCR +10.0/10.0
- Schools +4.4/10.0
- Condition / age +3.8/5.0
- Rent growth +3.7/5.0
- Livability +3.2/5.0
- ARV discount +0.0/15.0
- Appreciation +0.0/10.0
$120,000
🖨 Deal sheet 📄 Offer letter ✓ Due diligence
Listing remarks MLS
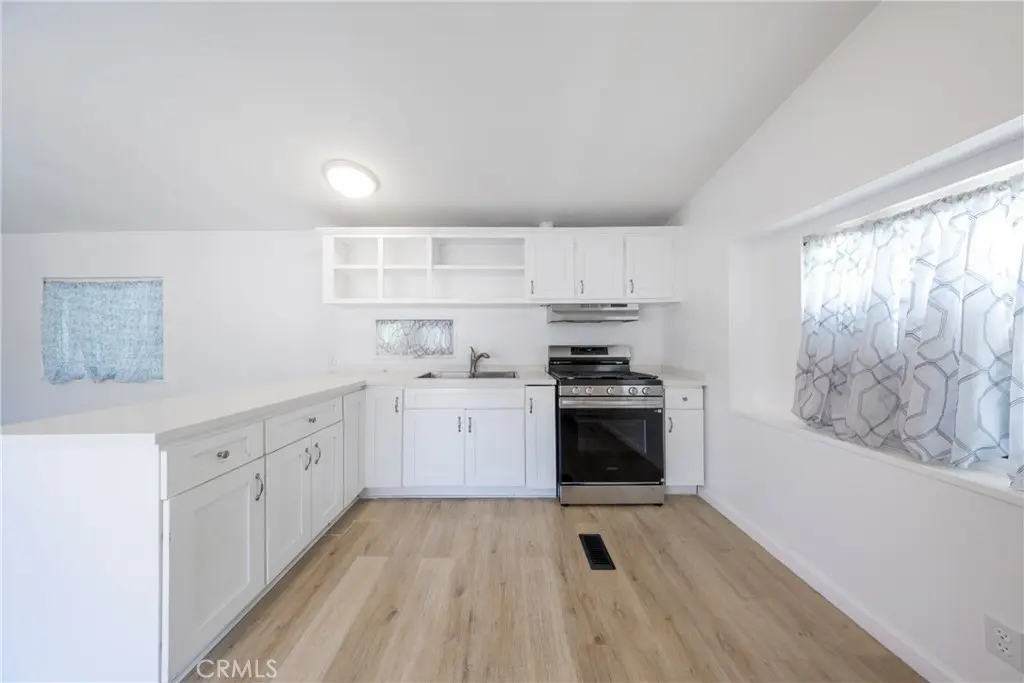
WELCOME TO YOUR HOME. THIS IS IN A 55+ COMMUNITY. THE HOME OFFERS MANY AMENITIES LIKE REC ROOM, POOL, PLENTY OF PARKING FOR FRIENDS AND FAMILY TO VISIT, AND 24HR SECURITY. PROPERTY NEEDS SOME TLC BUT FOR THE PRICE YOU CAN'T BEAT IT.
Key facts
- New stove
- New carpet
- Updated kitchen
Tags
Property features AI
Finance
- Other: Pets: contact manager/park for details
- Financial info: Land lease applies; monthly land lease amount; Rent includes trash and sewer
- HOA & community: Senior community; Manager approval required; Community features include curbs, biking paths, park; Park name: Thunderbird Villa Park
Exterior
- Parking: One covered/carport space (attached); One garage space; One uncovered parking space; Three total parking spaces; Access via city streets; paved, maintained road frontage
- Utilities: District/public water (connected); Public sewer (connected/available); Natural gas connected and available; Electricity connected and available; Cable available; Telephone available (in street and on property)
- Home design: Single (mobile) home, single-story; Mobile home remains on site; Mobile dimensions approximately 14' x 56'; Entry level: 1
- Construction: Year built per public records; Assessor-recorded living area
- Exterior features: Front porch and additional porch; Open patio; Deck; Rooftop area; Community pool; Park nearby; One shed; Aluminum skirt
Interior
- Kitchen: Gas range and gas oven; Self-cleaning oven; Range/stove hood; Refrigerator; Garbage disposal; Water heater unit
- Flooring: Carpet
- Bathrooms: One full bathroom with bathtub, shower-in-tub, Formica counters, linen/closet storage
- Heating & cooling: Central forced-air furnace
- Interior features: Open floor plan; Entrance on east and west sides; Single-level living
- Laundry & utility: Washer included; Dryer included; Washer and electric dryer hookups inside
Neighborhood map
What this means for you Summary
Snapshot
- This is a 2-bed/1.0-bath manufactured listed at $120k. Condition is rated good.
Deal economics
- At list price, monthly cash flow is $1k ($13k/yr) — positive.
- The deal already cash-flows at list — no discount required.
- Meets the 1% rule at list price ($2k rent vs $120k).
- Recommended offer: $118k (1.5% below list) — sets the bar for market timing.
- Cap rate 17.1% vs local median 2.8% in South Gate — top-decile yield for the area; either an underpriced asset or a hidden risk that comps aren't pricing in. Stress-test before assuming the spread holds.
Location & tenants
- Location reads 63/100 on livability (#459 in CA) — a middle-class / working-renter tenant base. Strengths: commute A+; Watch: health & safety C-, schools D-, crime F.
- Downey Unified (suburban): math 41% / reading 53% proficiency, ranked #481 of 1,400 in CA (top 34%) — families likely to look elsewhere, expect single-tenant / working-renter base with shorter leases.
- Market conditions: Rents rising fast (+5.0%/yr); 51 active listings in the ZIP; 18 comparable units currently listed for rent nearby; rentals at typical pace (median 24d on market — plan ~3-4 weeks tenant-placement turnaround); 19,697 units permitted in Los Angeles County in 2024 (9,426 in 5+ unit buildings).
- This rent runs 36% of the median local income ($75k/yr) — at the standard rent-burdened threshold; future hikes will face affordability resistance.
Forward outlook
- Local home prices are declining (-3.0%/yr); year-one equity from $830 of loan paydown is wiped out by about $4k of value loss. Plan a longer hold.
- Los Angeles County population projected at +9% by 2050 — modest demand growth; plan on rents tracking national, not racing it.
- At projected returns (-3.0% appreciation + 5.0% rent growth), your $34k cash investment doubles in ~3 years — after that, you're playing with house money.
Negotiation context
- It's been on market 15 days — a 2% lower offer ($118k) is reasonable based on typical stale-listing flexibility.
- 2 sale attempts since 4y ago with the ask held roughly flat each time — persistent listings suggest the price (not the market) is what's stuck; bring a comps-based counter.
- Current owner paid $71k; list at $120k implies a 69% gain — meaningful room to come down on a strong offer.
Risks & watch-outs
- Climate carrying-cost: major flood risk; extreme-heat days projected 6→20/yr by 2055 (HVAC capex compounding) — expect insurance premiums to compound above CPI over the hold.
Questions for the listing agent
- Is there a deadline driving the sale (1031 exchange, divorce, estate, relocation)? That informs how much negotiation room exists.
- Schools are D-rated, which usually means shorter tenancies and higher turnover. Who's the typical renter profile here, and what's been the actual vacancy rate?
- Crime grade is F in this area — have there been break-ins, vandalism, or insurance claims at this property in the last 3 years? What carrier currently insures it and at what premium?
- What's the average days-on-market for RENTAL listings here right now (not sales)? A rising rental-DOM trend means longer vacancies and softer asking-rent achievability than the comps imply.
- What's the recent tenant-quality profile in this submarket — average credit score on applications, eviction rate, late-payment / NSF rate, and stable-employment percentage? A property-management company in the area should have these aggregated.
- How much new for-sale + rental construction is in the pipeline within 1–3 miles? Heavy new supply typically softens prices + rents 12–24 months out; constrained supply supports both.
Investment metrics
- 1% rule
- 1.88% ✓
- Cap rate
- 17.11%
- Cash-on-cash
- 38.64%
- DSCR
- 2.72
- GRM
- 4.4
CMA / ARV
- ARV (on-the-fly)
- $97,216
- Comps found
- 1
Show comp detail 1 sale within ~0.75 mi
| Address | Dist | Beds/Ba | Sqft | Sold | Price | $/sf | Match |
|---|---|---|---|---|---|---|---|
| 10001-171 W Frontage Rd #171 | 0.00mi | 2/1.0 | 768 (-2%) | 12mo | $95,000 | $124 | 87 |
Match score weights: distance 35% · size 25% · config 20% · recency 20%. Top-matched comps best support the ARV.
Projected returns pro-forma
-3.0% appreciation · 4.95% rent growth · sell at horizon
- IRR
- 36.8%
- Equity multiple
- 2.61×
- Total profit
- $53,947
- Equity at exit
- $17,892
- IRR
- 44.4%
- Equity multiple
- 5.61×
- Total profit
- $154,850
- Equity at exit
- $10,375
Cash invested: $33,600 (down + closing). Projections, not guarantees.
Landlord ↔ Tenant lean methodology
- Overall (STATE)
- 18 Strongly Tenant-Friendly
- State California
- 18 Strongly Tenant-Friendly · D+13
- County
- — inherits STATE
- City
- — inherits STATE
ZIP-level market 90280
- Rents YoY
- 5.0%
- Active inventory
- 51
- Price-to-rent
- 4.4×
Monthly cashflow live
- Estimated rent
- $2,261 high interval (Pro) →
- Mortgage (P&I)
- −$629
- Tax from tax record
- −$25 /mo · $300/yr
- Insurance
- −$50
- HOA
- −$0
- Vacancy / Maint / Mgmt
- −$475
- Net cashflow
- $1,082
Break-even live
UW: 25.0% down · 7.5% · 30yr · 1.5% tax · 5.0% vac · 8.0% maint · 8.0% mgmt
Financing live
Cash to close
- Down payment
- $30,000
- Closing costs
- $3,600
- Reserves months
- —
- Total cash needed
- —
Loan-product check · same deal, 3 products live
Conventional
25% down · 7.5% · 30yr
- Down + closing
- —
- Monthly P&I
- —
- Monthly cashflow
- —
- DSCR
- —
- Eligible?
- —
Personal DTI + credit; lowest rate.
DSCR
20% down · 8.5% · 30yr
- Down + closing
- —
- Monthly P&I
- —
- Monthly cashflow
- —
- DSCR
- —
- Eligible?
- —
No personal income docs; deal must DSCR.
Hard money
10% down · 12.0% · 12mo
- Down + closing
- —
- Monthly P&I
- —
- Monthly cashflow
- —
- DSCR
- —
- Eligible?
- —
Short-term bridge; refi at stabilization.
Rent comps 18 comps
| Address | Beds | Baths | Sqft | Rent | $/sqft | DOM | Units | Dist |
|---|---|---|---|---|---|---|---|---|
| 5166 McCallum Ave South Gate, CA | 2.0 | 1.0 | 900 | $2,500 | $2.78 | 18d | 1 | 0.43mi |
| 5166 Mccallum Ave Unit A South Gate, CA | 2.0 | 1.0 | 900 | $2,500 | $2.78 | 24d | 1 | 0.43mi |
| 4986 Southern Ave South Gate, CA | 1.0 | 1.0 | 700 | $2,000 | $2.86 | 43d | 1 | 0.62mi |
| 10317 Pinehurst Ave South Gate, CA | 2.0 | 1.0 | 900 | $2,500 | $2.78 | 24d | 1 | 0.73mi |
| 7147 Stewart and Gray Rd Downey, CA | 1.0 | 1.0 | 625 | $1,895 | $3.03 | 43d | 1 | 0.77mi |
| 10800 Wright Rd South Gate, CA | 1.0 | 1.0 | 702 | $2,100 | $2.99 | 43d | 4 | 0.85mi |
| 7380 Emily Ln Downey, CA | 1.0–2.0 | 1.0 | 787 | $2,500 | $3.17 | 16d | 4 | 0.97mi |
| 12130 Old River School Rd Downey, CA | 2.0 | 1.0 | 860 | $2,495 | $2.90 | 21d | 1 | 0.98mi |
| 7524 Stewart and Gray Rd Downey, CA | 2.0 | 1.0 | 1050 | $2,895 | $2.76 | 18d | 1 | 1.17mi |
| 7370 Neo St Apt 6 Downey, CA | 2.0 | 1.5 | 600 | $2,195 | $3.66 | 43d | 1 | 1.20mi |
| 7546 Stewart and Gray Rd Downey, CA | 1.0–2.0 | 1.0–2.0 | 925 | $2,000 | $2.16 | 1d | 2 | 1.21mi |
| 5154 Santa Ana St Bell Gardens, CA | 2.0 | 1.0 | 850 | $2,200 | $2.59 | 24d | 1 | 1.22mi |
| 8202 Wilcox Ave Unit 13 Bell Gardens, CA | 3.0 | 1.0 | 1000 | $2,600 | $2.60 | 13d | 1 | 1.24mi |
| 8202 Wilcox Ave Unit 11 Bell Gardens, CA | 3.0 | 1.0 | 1000 | $2,500 | $2.50 | 43d | 1 | 1.24mi |
| 11502 Adco Ave Downey, CA | 1.0 | 1.0 | 750 | $1,825 | $2.43 | 1d | 2 | 1.24mi |
| 5018 Santa Ana St Bell Gardens, CA | 1.0 | 1.0 | 650 | $1,775 | $2.73 | 43d | 1 | 1.28mi |
| 5928 Gotham St Unit 5930 Bell Gardens, CA | 2.0 | 1.0 | 825 | $2,600 | $3.15 | 1d | 1 | 1.42mi |
| 5928 Gotham St Unit 5932 Bell Gardens, CA | 2.0 | 1.0 | 830 | $2,550 | $3.07 | 1d | 1 | 1.42mi |
Listing history 11 events
-
2026-06-18days on market $120,000 Active 15 DOM
-
2026-06-17days on market $120,000 Active 14 DOM
-
2026-06-16days on market $120,000 Active 13 DOM
-
2026-06-15days on market $120,000 Active 12 DOM
-
2026-06-13days on market $120,000 Active 10 DOM
-
2026-06-13days on market $120,000 Active 9 DOM
-
2026-06-09days on market $120,000 Active 6 DOM
-
2026-06-08days on market $120,000 Active 5 DOM
-
2026-06-07days on market $120,000 Active 4 DOM
-
2026-06-04remarks 699-char remark
-
2026-06-04$120,000 Active 1 DOM
ⓘ Source: listings_history table (triggers on properties + properties_extension) + one-shot
backfill from property_details.listing_events for pre-trigger history.
Tax reassessment forecast CA · Resets to sale price
- Current annual tax
- $300 · $25/mo
- Projected year-2 tax
- $912 · $76/mo
- Expected delta
- +$612/yr (+$51/mo · 204.5%)
ⓘ Screening estimate from a state-policy table — verify with the county assessor before closing.
Climate risk First Street
- Flood 6/10 Major FEMA zone X · 74% chance over 30 yrs
- Wildfire 1/10 Low
- Heat 5/10 Major 6 d/yr ≥92°F today · 20 d/yr by 30 yrs out
- Wind 1/10 Low
- Air quality 6/10 Major 10 unhealthy d/yr today · 10 by 30 yrs out
Nearby sold comps map
Loading sold comps map…
Walkable amenities ~0.75 mi
Loading nearby amenities…
Taxation est. · year 1
- Rental income
- $27,133
- − Mortgage interest
- −$6,722
- − Property taxes
- −$300
- − Insurance
- −$600
- − Repairs & maintenance
- −$2,171
- − Management
- −$2,171
- − Depreciation
- −$3,491
- Taxable income
- $11,679
- Est. tax owed @ 24.0%
- −$2,803
- After-tax cash flow
- $10,181/yr
For passive investors: Depreciation is non-cash, so a rental often shows a tax loss while cash-flowing — sheltering income. Rental losses are passive: they offset passive income freely, and up to $25,000/yr can offset ordinary (W-2) income if you actively participate and your MAGI is under $100k (phasing out to $0 by $150k); unused losses carry forward. On sale, claimed depreciation is recaptured at up to 25%, and gains may owe capital-gains tax (a 1031 exchange can defer both). Figures are a year-1 estimate at your 24.0% rate — not tax advice; consult a CPA.
Condition & rehab AI · 12 photos
This move-in ready manufactured home in Thunderbird Villa offers updated amenities and a fresh look, making it an attractive option for both resale and rental.
Value-add opportunities
- Both landscaping — enhances curb appeal and adds value
- Both interior paint — fresh paint improves aesthetics and value
- Both kitchen appliances — new appliances add functionality and value
Renovation cost estimate screening
Value-add ROI direction
- Both landscaping — enhances curb appeal and adds value ↑
- Both interior paint — fresh paint improves aesthetics and value ↑
- Both kitchen appliances — new appliances add functionality and value ↑
ⓘ Cost ranges are severity-bucket heuristics (US national rule-of-thumb). Get contractor quotes + a written scope before underwriting a rehab budget.
Schools (NCES district)
- District
- Downey Unified
- NCES district ID
- 0611460
- Math proficiency
- 41% ▲ 3.00%
- Reading proficiency
- 53% ▲ 1.00%
- Median HH income
- $61,344
- Composite
- 43.5/100
- National rank
- #6458
- State rank
- #481 of 1400 in CA
Livability — South Gate
- Score
- 63/100
- State rank
- #459
- US rank
- #15665
Category grades
Schools grade is shown separately in the Schools card above.
Census & demographics
- Census place
- South Gate, CA
- County
- Los Angeles County · 9,444,647 people
- City population
- 91,365
- Metro
- Los Angeles-Long Beach-Anaheim, CA
- Population (ZIP)
- 91,365
- Household income
- $74,651
- Rent vs Own
- Severe rent burden
- 4041.0
Population outlook (Los Angeles County) Hauer SSP2
- Today (2025)
- 10,940,515 people
- By 2030
- 11,256,481 · +2.9%
- By 2040
- 11,729,929 · +7.2%
- By 2050
- 11,948,407 · +9.2%
- By 2075
- 11,818,114 · +8.0%
- By 2100
- 10,842,928 · -0.9%
Race, ethnicity, and origin ACS 2023
- Neighborhood character
- Predominantly Hispanic (95%)
- Race & ethnicity
- Hispanic / Latino 95% Two or more races 27% White 3% Native American 2%
- Hispanic origin (detail)
- Mexican 78%
- Foreign-born
- 42% · Canada
- Languages at home
- 16% English-only · Spanish 83%
Political lean MEDSL · Los Angeles
- 2024 margin
- Solid D (+32.9) · D 64.8% · R 31.9% · Other 3.3%
- 2008→2024 swing
- -7.4pp toward R · 2008: 40.4pp · 2024: 32.9pp
- All cycles
- 2024: D+32.9 2020: D+44.2 2016: D+48.0 2012: D+40.0 2008: D+40.4
Not yet ingested
- Civics
- —
Market trends
- HPI YoY
- ▼ -847.77%
- Current HPI
- 419.791
- Rent YoY
- ▲ 4.95%
- Metro
- Los Angeles-Long Beach-Anaheim, CA
- State GDP YoY
- ▲ 3.21%
- F500 in state
- 116
Industry mix (Fortune 500 HQ in CA)
| Industry | F500 HQs | Revenue |
|---|---|---|
| Technology | 27 | $1,492B |
|
||
| Financial Services | 3 | $174B |
|
||
| Retail | 3 | $44B |
|
||
| Insurance | 3 | $26B |
|
||
| Media / Entertainment | 2 | $115B |
|
||
| Pharmaceuticals / Biotech | 2 | $62B |
|
||
Price history
+71.4% since first listed5 events — show timeline
- 2026-06-03 Listed $120,000 CRMLS
- 2022-12-23 Sold (MLS) $71,000 CRMLS
- 2022-12-17 Pending — CRMLS
- 2022-11-28 Contingent — CRMLS
- 2022-11-04 Listed $70,000 CRMLS
Property tax history
+5.4%/yrLatest (2025): $300 · +5.4% YoY. Source: county tax records.
Cash-flow waterfall
monthlySold comps — $/sqft
last 12 mo · ≤1 miLoading sold comps…