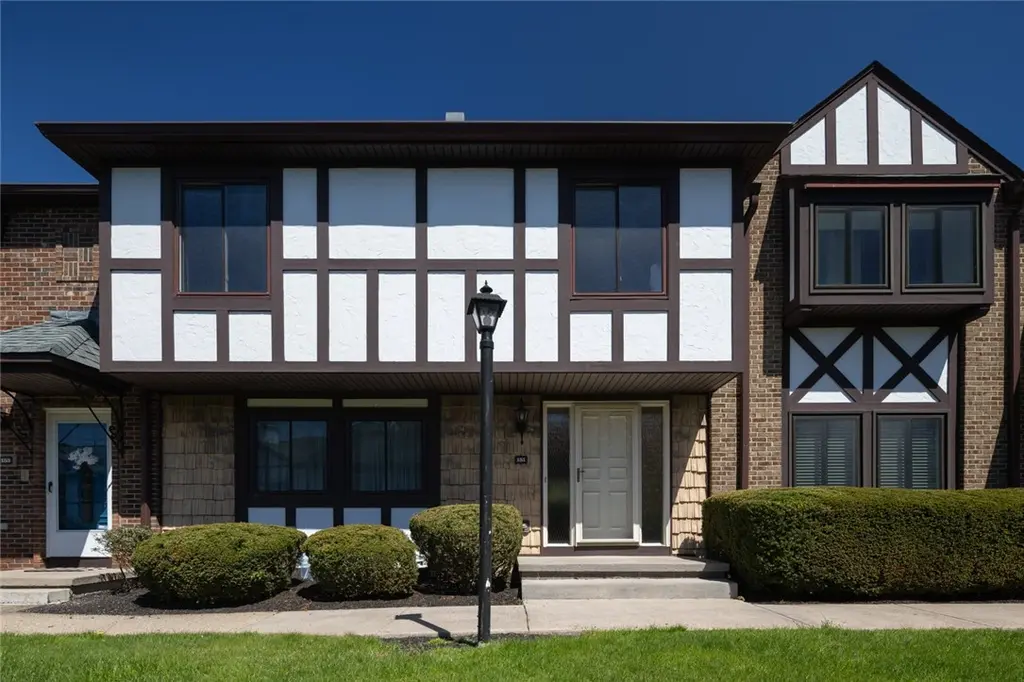
151 New Wickham Dr · Fairport, NY
Flood risk 1/10 · Minimal
- FEMA flood zone
- X (unshaded)
- Chance of flooding over 30 yrs
- 0.0%
- Est. flood insurance / yr
- $473 – $860
Fire risk 3/10 · Minor
- Est. fire insurance / yr
- $691 – $1,283
Heat risk 2/10 · Minimal
- Hot days now (above 95°F)
- 7 days/yr
- Hot days in 30 yrs
- 16 days/yr
Wind risk 1/10 · Minimal
- Chance of severe wind over 30 yrs
- —
Air-quality risk 2/10 · Minimal
- Unhealthy air days now
- 1 days/yr
- Unhealthy air days in 30 yrs
- 1 days/yr
Risk factors via First Street. Map © Google.
Why this score? — see what drove the D grade
The composite is a weighted blend of 9 inputs, each scored 0–100. Each bar is that input's sub-score; the figure is the points it added to the 100-point composite (weight × sub-score).
- ARV discount +10.9/15.0
- Cash flow +8.5/30.0
- Schools +6.8/10.0
- 1% rule +3.9/10.0
- Livability +3.7/5.0
- Rent growth +2.5/5.0
- Condition / age +2.5/5.0
- DSCR +2.3/10.0
- Appreciation +0.0/10.0
$250,000
🖨 Deal sheet 📄 Offer letter ✓ Due diligence
Listing remarks
Concord Square is a quiet neighborhood, conveniently located within walking distance to shopping, restaurants and more, tucked away by routes 250 and 441. This 1742 square foot townhome boasts FOUR bedrooms, 2 full and 1 half bathrooms, PLUS additional living space in the finished basement space. This clean, welcoming home offers updated bathrooms and kitchen, with a cohesive, neutral color palette throughout. Enjoy the simplicity of townhouse living, owning your own comfortable home, private patio, garden space and 2-car garage, building equity, while you relax by the pool, host guests at the clubhouse, and the Homeowners Association takes care of the maintenance! Delayed negotiations: no
Key facts
- Private patio
- Updated bathrooms
- Updated kitchen
Tags
Property features AI
Finance
- Financial info: Pets allowed (cats and dogs permitted; number limit applies)
- HOA & community: Monthly association fee of $430 (Performance Group); HOA covers common area maintenance, structure maintenance, insurance, sewer, water, trash, and snow removal; Community amenities include a clubhouse and a pool
Exterior
- Parking: Assigned detached garage with garage door opener; Two garage spaces
- Utilities: Public water connected; Sewer connected; Electric with circuit breakers
- Home design: Two-story residence; Resale property; Asphalt roof; Vinyl siding
- Construction: Vinyl siding construction; Asphalt roofing; Built as existing (year built details: existing)
- Exterior features: Patio; Play structure; Rectangular residential lot; City street frontage
Interior
- Kitchen: Electric oven and electric range; Microwave; Dishwasher; Refrigerator
- Bedrooms: Total of 7 rooms (includes bedrooms and living spaces)
- Flooring: Carpet; Laminate; Luxury vinyl; Varied flooring
- Bathrooms: Two full bathrooms; One half bathroom; One main-level bathroom
- Heating & cooling: Gas forced-air heating; Central air conditioning
- Interior features: Sliding glass doors; Living/Dining room; Partially finished full basement; Recreation room in basement; Laundry room
- Laundry & utility: Washer and dryer; Main-level laundry; Gas water heater
Neighborhood map
What this means for you Summary
Snapshot
- This is a 4-bed/2.5-bath townhouse listed at $250k.
Deal economics
- At list price, monthly cash flow is $-218 ($-3k/yr) — negative.
- To cash-flow at today's rent, offer at most $211k (15.4% below list).
- To meet the 1% rule (rent ≥ 1% of price), the offer needs to be $223k (10.7% below list).
- Recommended offer: $211k (15.4% below list) — sets the bar for cash-flow.
- Cap rate 5.2% vs local median 3.4% in Fairport — top-decile yield for the area; either an underpriced asset or a hidden risk that comps aren't pricing in. Stress-test before assuming the spread holds.
Location & tenants
- Location reads 74/100 on livability (#301 in NY, #4,847 nationally) — a middle-class / working-renter tenant base. Strengths: housing A+, health & safety A+, schools A; Watch: commute F.
- Penfield Central School District (suburban): math 77% / reading 79% proficiency, ranked #67 of 590 in NY (top 11%) — strong family-tenant draw, lease renewals of 3-5y typical; only 11% free/reduced lunch — higher-income household profile.
- Market conditions: 113 active listings in the ZIP; high-income renter base; 1,169 units permitted in Monroe County in 2024 (591 in 5+ unit buildings).
Forward outlook
- Local home prices are declining (-3.0%/yr); year-one equity from $2k of loan paydown is wiped out by about $8k of value loss. Plan a longer hold.
- Monroe County population projected to shrink 6% by 2050 — rents likely to lag national; underwrite the cash flow, not the appreciation.
Negotiation context
- Only 14 days on market — expect competitive offers; lowballing is unlikely to land.
Questions for the listing agent
- What do current leases actually rent for vs. the listed asking? Can we see a recent rent roll and the last 12 months of T-12 income?
- Built in 1972 — when were the roof, HVAC, electrical panel, plumbing, and water heater last replaced?
- What does the HOA fee cover, when was the last increase, and are there any pending special assessments or reserve-fund shortfalls?
- Is there a deadline driving the sale (1031 exchange, divorce, estate, relocation)? That informs how much negotiation room exists.
- Schools are A-rated — typically a magnet for longer-tenancy family renters. What's the average tenant stay here, and is there a school-zone premium baked into asking?
- The area grade is low — what's the realistic commute time and amenity access for the typical tenant pool here? Any planned neighborhood developments (good or bad) we should know about?
- What's the average days-on-market for RENTAL listings here right now (not sales)? A rising rental-DOM trend means longer vacancies and softer asking-rent achievability than the comps imply.
- What's the recent tenant-quality profile in this submarket — average credit score on applications, eviction rate, late-payment / NSF rate, and stable-employment percentage? A property-management company in the area should have these aggregated.
- How much new for-sale + rental construction is in the pipeline within 1–3 miles? Heavy new supply typically softens prices + rents 12–24 months out; constrained supply supports both.
Investment metrics
- 1% rule
- 0.89% ✗
- Cap rate
- 5.25%
- Cash-on-cash
- -3.74%
- DSCR
- 0.83
- GRM
- 9.3
CMA / ARV
- ARV (median comp)
- $270,312
- List price
- $250,000
- Delta
- -7.51%
- Verdict
- FAIR
- Comps
- 20 within 1.0 mi
Show comp detail 12 sales within ~0.75 mi
| Address | Dist | Beds/Ba | Sqft | Sold | Price | $/sf | Match |
|---|---|---|---|---|---|---|---|
| 151 New Wickham Dr | 0.00mi | 4/2.5 | 1,820 (0%) | 0mo | $315,000 | $173 | 100 |
| 169 New Wickham Dr | 0.05mi | 3/2.5 (-1) | 1,820 (0%) | 2mo | $337,500 | $185 | 91 |
| 69 New Wickham Dr | 0.21mi | 3/2.5 (-1) | 1,820 (0%) | 2mo | $272,500 | $150 | 84 |
| 140 New Wickham Dr | 0.13mi | 3/2.5 (-1) | 1,768 (-3%) | 3mo | $275,000 | $156 | 82 |
| 143 New Wickham Dr | 0.02mi | 3/2.5 (-1) | 1,680 (-8%) | 1mo | $280,000 | $167 | 81 |
| 134 Camberley Pl | 0.12mi | 4/2.5 | 1,820 (0%) | 19mo | $280,000 | $154 | 78 |
| 82 Camberley Pl | 0.18mi | 3/2.5 (-1) | 1,680 (-8%) | 3mo | $300,000 | $179 | 72 |
| 104 New Wickham Dr | 0.23mi | 3/2.5 (-1) | 1,768 (-3%) | 13mo | $325,000 | $184 | 69 |
| 144 New Wickham Dr | 0.12mi | 3/2.5 (-1) | 1,632 (-10%) | 19mo | $260,000 | $159 | 56 |
| 28 New Wickham Dr | 0.11mi | 3/2.5 (-1) | 1,632 (-10%) | 19mo | $235,000 | $144 | 56 |
| 70 Onyx Dr | 0.38mi | 3/2.0 (-1) | 1,991 (+9%) | 8mo | $460,000 | $231 | 53 |
| 40 Onyx Dr | 0.41mi | 3/2.0 (-1) | 1,991 (+9%) | 8mo | $535,000 | $269 | 52 |
Match score weights: distance 35% · size 25% · config 20% · recency 20%. Top-matched comps best support the ARV.
Projected returns pro-forma
-3.0% appreciation · 3.0% rent growth · sell at horizon
- IRR
- -22.5%
- Equity multiple
- 0.23×
- Total profit
- $-54,202
- Equity at exit
- $37,276
- IRR
- -16.4%
- Equity multiple
- 0.08×
- Total profit
- $-64,302
- Equity at exit
- $21,615
Cash invested: $70,000 (down + closing). Projections, not guarantees.
Landlord ↔ Tenant lean methodology
- Overall (STATE)
- 15 Strongly Tenant-Friendly
- State New York
- 15 Strongly Tenant-Friendly · D+10
- County
- — inherits STATE
- City
- — inherits STATE
ZIP-level market 14526
- Active inventory
- 113
- Price-to-rent
- 9.3×
Monthly cashflow live
- Estimated rent
- $2,233 medium interval (Pro) →
- Mortgage (P&I)
- −$1,311
- Tax from tax record
- −$137 /mo · $1,639/yr
- Insurance
- −$104
- HOA
- −$430
- Vacancy / Maint / Mgmt
- −$469
- Net cashflow
- $-218
Break-even live
UW: 25.0% down · 7.5% · 30yr · 1.5% tax · 5.0% vac · 8.0% maint · 8.0% mgmt
Financing live
Cash to close
- Down payment
- $62,500
- Closing costs
- $7,500
- Reserves months
- —
- Total cash needed
- —
Loan-product check · same deal, 3 products live
Conventional
25% down · 7.5% · 30yr
- Down + closing
- —
- Monthly P&I
- —
- Monthly cashflow
- —
- DSCR
- —
- Eligible?
- —
Personal DTI + credit; lowest rate.
DSCR
20% down · 8.5% · 30yr
- Down + closing
- —
- Monthly P&I
- —
- Monthly cashflow
- —
- DSCR
- —
- Eligible?
- —
No personal income docs; deal must DSCR.
Hard money
10% down · 12.0% · 12mo
- Down + closing
- —
- Monthly P&I
- —
- Monthly cashflow
- —
- DSCR
- —
- Eligible?
- —
Short-term bridge; refi at stabilization.
HOA detail
- Monthly dues
- $430 · $5,160/yr
- Likely covers
- pool
Listing history 5 events
-
2026-05-13status Pending 753-char remark
-
2026-05-06historical Active Under Contract 753-char remark
-
2026-04-29$250,000 Active 753-char remark
-
2002-09-20soldstatus $135,000
-
1993-09-08soldstatus $102,500
ⓘ Source: listings_history table (triggers on properties + properties_extension) + one-shot
backfill from property_details.listing_events for pre-trigger history.
Tax reassessment forecast NY · Partial reset (capped growth)
- Current annual tax
- $1,639 · $137/mo
- Projected year-2 tax
- $2,932 · $244/mo
- Expected delta
- +$1,293/yr (+$108/mo · 78.9%)
ⓘ Screening estimate from a state-policy table — verify with the county assessor before closing.
Climate risk First Street
- Flood 1/10 Low FEMA zone X (unshaded) · 0% chance over 30 yrs
- Wildfire 3/10 Moderate
- Heat 2/10 Low 7 d/yr ≥95°F today · 16 d/yr by 30 yrs out
- Wind 1/10 Low
- Air quality 2/10 Low 1 unhealthy d/yr today · 1 by 30 yrs out
Nearby sold comps map
Loading sold comps map…
Walkable amenities ~0.75 mi
Loading nearby amenities…
Taxation est. · year 1
- Rental income
- $26,792
- − Mortgage interest
- −$14,004
- − Property taxes
- −$1,639
- − Insurance
- −$1,250
- − Repairs & maintenance
- −$2,143
- − Management
- −$2,143
- − HOA
- −$5,160
- − Depreciation
- −$7,273
- Taxable loss
- −$6,820
- Est. tax savings @ 24.0%
- +$1,637
- After-tax cash flow
- $-979/yr
For passive investors: Depreciation is non-cash, so a rental often shows a tax loss while cash-flowing — sheltering income. Rental losses are passive: they offset passive income freely, and up to $25,000/yr can offset ordinary (W-2) income if you actively participate and your MAGI is under $100k (phasing out to $0 by $150k); unused losses carry forward. On sale, claimed depreciation is recaptured at up to 25%, and gains may owe capital-gains tax (a 1031 exchange can defer both). Figures are a year-1 estimate at your 24.0% rate — not tax advice; consult a CPA.
Schools (NCES district)
- District
- Penfield Central School District
- NCES district ID
- 3622710
- Math proficiency
- 77% ▼ -3.00%
- Reading proficiency
- 79% ▲ 10.00%
- Median HH income
- $74,802
- Composite
- 68.37/100
- National rank
- #347
- State rank
- #67 of 590 in NY
Livability — Fairport
- Score
- 74/100
- State rank
- #301
- US rank
- #4847
Category grades
Schools grade is shown separately in the Schools card above.
Census & demographics
- County
- Monroe County · 674,131 people
- City population
- 42,750
- Metro
- Rochester, NY
- Population (ZIP)
- 19,629
- Household income
- $118,777
- Rent vs Own
- Severe rent burden
- 234.0
Population outlook (Monroe County) Hauer SSP2
- Today (2025)
- 759,460 people
- By 2030
- 757,154 · -0.3%
- By 2040
- 740,644 · -2.5%
- By 2050
- 714,443 · -5.9%
- By 2075
- 645,883 · -15.0%
- By 2100
- 547,084 · -28.0%
Race, ethnicity, and origin ACS 2023
- Neighborhood character
- Predominantly White (87%)
- Race & ethnicity
- White 87% Two or more races 7% Hispanic / Latino 5% Asian 2%
- Hispanic origin (detail)
- Puerto Rican 1% Cuban 1%
- Common ancestry
- Romanian 5% Slovak 4% Italian 2%
- Foreign-born
- 8% · Canada, China, Dominican Republic
- Languages at home
- 93% English-only · Other Indo-European 2% Spanish 2% Russian/Polish/Slavic 1%
Political lean MEDSL · Monroe
- 2024 margin
- D (+19.1) · D 59.5% · R 40.5%
- 2008→2024 swing
- +1.4pp toward D · 2008: 17.7pp · 2024: 19.1pp
- All cycles
- 2024: D+19.1 2020: D+21.0 2016: D+14.1 2012: D+17.4 2008: D+17.7
Not yet ingested
- Civics
- —
Market trends
- HPI YoY
- ▼ -149.19%
- Current HPI
- 271.8476
- Rent YoY
- —
- Metro
- Rochester, NY
- State GDP YoY
- ▲ 2.60%
- F500 in state
- 92
Industry mix (Fortune 500 HQ in NY)
| Industry | F500 HQs | Revenue |
|---|---|---|
| Financial Services | 10 | $950B |
|
||
| Consumer Goods | 9 | $162B |
|
||
| Insurance | 4 | $225B |
|
||
| Telecommunications | 2 | $144B |
|
||
| Pharmaceuticals | 2 | $112B |
|
||
| Media / Entertainment | 2 | $69B |
|
||
Price history
+207.3% since first listed6 events — show timeline
- 2026-06-08 Sold (MLS) $315,000 UNYREIS
- 2026-05-13 Pending — UNYREIS
- 2026-05-06 Contingent — UNYREIS
- 2026-04-29 Listed $250,000 UNYREIS
- 2002-09-20 Sold (Public Records) $135,000 Public Records
- 1993-09-08 Sold (Public Records) $102,500 Public Records
Property tax history
-8.0%/yrLatest (2025): $1,639 · +11.8% YoY. Source: county tax records.
Cash-flow waterfall
monthlySold comps — $/sqft
last 12 mo · ≤1 miLoading sold comps…