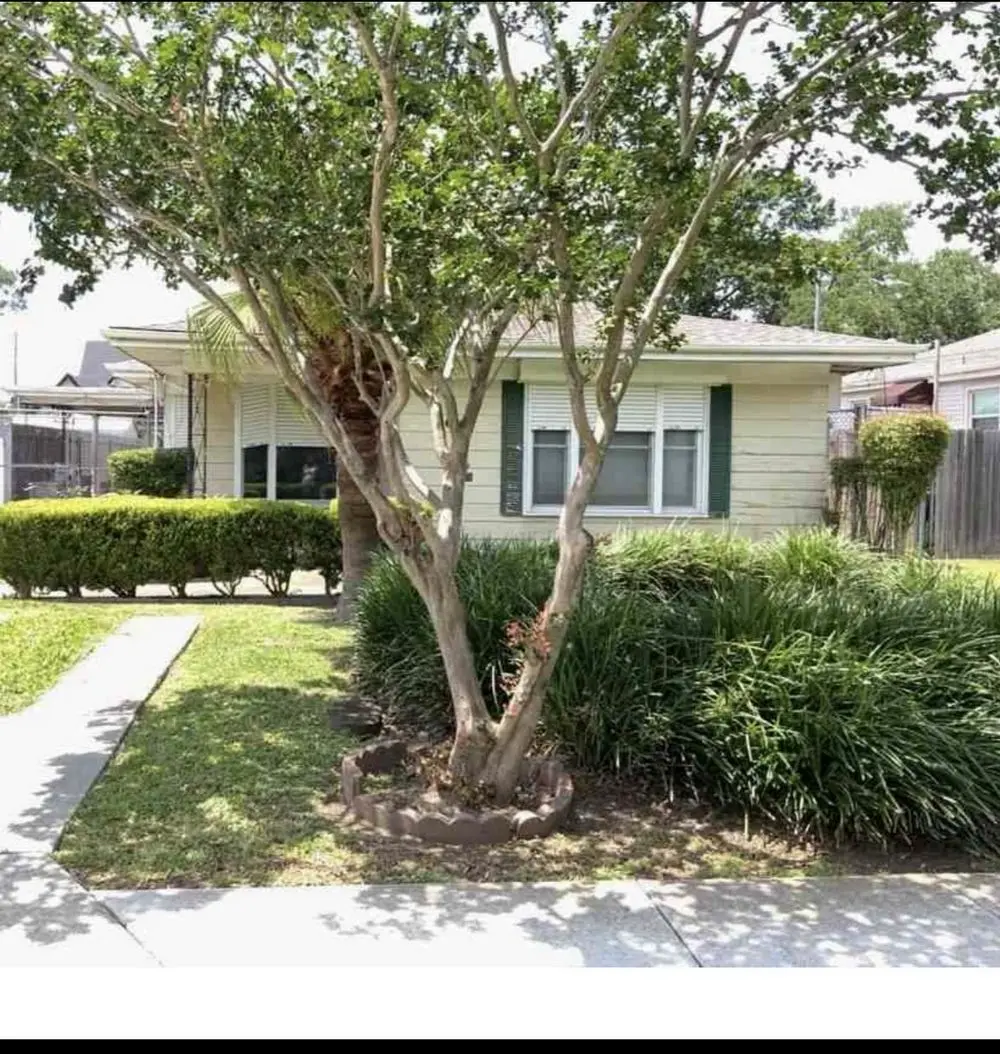
640 Bonnabel Blvd · Metairie, LA
Flood risk No data
- FEMA flood zone
- —
- Chance of flooding over 30 yrs
- —
- Est. flood insurance / yr
- —
Fire risk No data
- Est. fire insurance / yr
- —
Heat risk No data
- Hot days now (above threshold)
- —
- Hot days in 30 yrs
- —
Wind risk No data
- Chance of severe wind over 30 yrs
- —
Air-quality risk No data
- Unhealthy air days now
- —
- Unhealthy air days in 30 yrs
- —
Risk factors via First Street. Map © Google.
Why this score? — see what drove the C- grade
The composite is a weighted blend of 9 inputs, each scored 0–100. Each bar is that input's sub-score; the figure is the points it added to the 100-point composite (weight × sub-score).
- Cash flow +15.8/30.0
- ARV discount +15.0/15.0
- DSCR +4.9/10.0
- Livability +4.4/5.0
- 1% rule +4.0/10.0
- Schools +2.5/10.0
- Condition / age +2.5/5.0
- Rent growth +2.4/5.0
- Appreciation +0.0/10.0
$290,000
🖨 Deal sheet (PDF) 📄 Offer letter ✓ Due diligence
Listing remarks
3 bedrooms, 2.5 baths, conveniently located on Bonnabel Blvd. near the I-10. 50x150 lot, Flood Zone X, never flooded. Selling As Is, Where Is. No repairs will be made. New roof on front of house in 2021. New AC in front of house in 2023. Hurricane shutters on front of house. Whole home generator system installed although generator itself needs replacing. Please submit lender pre-approval or proof of funds letter with offers. Deposit to be held by Buyers title company. Agents not protected.
Key facts
- Hurricane shutters
- Flood zone x
- New ac
Tags
Property features AI
Exterior
- Home design: House
- Construction: About 2,000 sq ft living area
- Exterior features: Lot approximately 7,500 sq ft
Neighborhood map
What this means for you Summary
Snapshot
- This is a 3-bed/2.5-bath single-family listed at $290k.
Deal economics
- At list price, monthly cash flow is $130 ($2k/yr) — positive.
- The deal already cash-flows at list — no discount required.
- To meet the 1% rule (rent ≥ 1% of price), the offer needs to be $262k (9.7% below list).
- Recommended offer: $262k (9.7% below list) — sets the bar for 1% rule.
- Cap rate 6.8% vs local median 3.6% in Metairie — top-decile yield for the area; either an underpriced asset or a hidden risk that comps aren't pricing in. Stress-test before assuming the spread holds.
Location & tenants
- Location reads 87/100 on livability (#1 in LA, #261 nationally) — a professional / high-income tenant draw. Strengths: commute A+, housing A+, health & safety A+.
- Jefferson Parish (suburban): math 24% / reading 34% proficiency, ranked #44 of 98 in LA (top 45%) — low school quality limits family demand, transient renter base, plan for 1-2y turnover; 70% free/reduced lunch — lower-income household profile, screen leases tightly.
- Zoned schools: J.C. Ellis School (math 40% / reading 48%, grade F, #191 of 646 statewide, top 30%, 613 students, 49% FRL); J.D. Meisler Middle School (math 13% / reading 28%, grade F, #161 of 218 statewide, top 76%, 753 students, 50% FRL); Riverdale High School (math 36% / reading 52%, grade F, #62 of 265 statewide, top 23%, 1,019 students, 50% FRL) — zoned schools average 50% FRL vs 70% district-wide (20 pts lower); this property's tenant base skews higher-income than the district average.
- Market conditions: Rents soft (-0.3%/yr); 178 active listings in the ZIP; 40 comparable units currently listed for rent nearby; rentals at typical pace (median 26d on market — plan ~3-4 weeks tenant-placement turnaround); solid renter incomes; 518 units permitted in Jefferson Parish in 2024 (43 in 5+ unit buildings).
- This rent runs 35% of the median local income ($89k/yr) — at the standard rent-burdened threshold; future hikes will face affordability resistance.
Forward outlook
- Local home prices are declining (-3.0%/yr); year-one equity from $2k of loan paydown is wiped out by about $9k of value loss. Plan a longer hold.
Negotiation context
- Only 8 days on market — expect competitive offers; lowballing is unlikely to land.
- Current owner paid $84k; list at $290k implies a 245% gain — meaningful room to come down on a strong offer.
Risks & watch-outs
- Watch-outs: built in 1946 — expect roof / HVAC / electrical / plumbing capex.
Questions for the listing agent
- Built in 1946 — when were the roof, HVAC, electrical panel, plumbing, and water heater last replaced?
- Is there a deadline driving the sale (1031 exchange, divorce, estate, relocation)? That informs how much negotiation room exists.
- Schools are B-rated — typically a magnet for longer-tenancy family renters. What's the average tenant stay here, and is there a school-zone premium baked into asking?
- What's the average days-on-market for RENTAL listings here right now (not sales)? A rising rental-DOM trend means longer vacancies and softer asking-rent achievability than the comps imply.
- What's the recent tenant-quality profile in this submarket — average credit score on applications, eviction rate, late-payment / NSF rate, and stable-employment percentage? A property-management company in the area should have these aggregated.
- How much new for-sale + rental construction is in the pipeline within 1–3 miles? Heavy new supply typically softens prices + rents 12–24 months out; constrained supply supports both.
Investment metrics
- 1% rule
- 0.90% ✗
- Cap rate
- 6.83%
- Cash-on-cash
- 1.92%
- DSCR
- 1.09
- GRM
- 9.2
CMA / ARV
- ARV (on-the-fly)
- $500,000
- Comps found
- 12
Show comp detail 12 sales within ~0.75 mi
| Address | Dist | Beds/Ba | Sqft | Sold | Price | $/sf | Match |
|---|---|---|---|---|---|---|---|
| 537 Beverly Garden Dr | 0.24mi | 3/2.0 | 2,126 (+6%) | 1mo | $232,500 | $109 | 75 |
| 504 Brockenbraugh Ct | 0.36mi | 4/2.5 (+1) | 2,077 (+4%) | 3mo | $525,000 | $253 | 70 |
| 568 E William David Pkwy | 0.58mi | 3/2.0 | 1,985 (-1%) | 1mo | $420,000 | $212 | 69 |
| 417 W William David Pkwy | 0.54mi | 3/2.0 | 1,971 (-2%) | 3mo | $345,000 | $175 | 68 |
| 508 Aurora Ave | 0.29mi | 3/2.0 | 1,804 (-10%) | 1mo | $475,000 | $263 | 68 |
| 546 Brockenbraugh Ct | 0.34mi | 4/3.0 (+1) | 2,100 (+5%) | 2mo | $600,000 | $286 | 67 |
| 1912 Metairie Ct | 0.57mi | 3/2.5 | 1,939 (-3%) | 3mo | $484,500 | $250 | 66 |
| 2619 Metairie Ct | 0.28mi | 4/3.0 (+1) | 2,160 (+8%) | 2mo | $347,110 | $161 | 65 |
| 444 Beverly Gardens Dr | 0.37mi | 3/2.0 | 1,820 (-9%) | 2mo | $472,500 | $260 | 64 |
| 2929 Metairie Heights Ave | 0.49mi | 4/2.0 (+1) | 2,146 (+7%) | 2mo | $445,700 | $208 | 56 |
| 1029 Aurora Ave | 0.64mi | 4/2.5 (+1) | 2,297 (+15%) | 0mo | $627,500 | $273 | 40 |
| 3200 Ridgeway Dr | 0.73mi | 3/2.0 | 1,701 (-15%) | 2mo | $419,000 | $246 | 38 |
Match score weights: distance 35% · size 25% · config 20% · recency 20%. Top-matched comps best support the ARV.
Projected returns pro-forma
-3.0% appreciation · 0.0% rent growth · sell at horizon
- IRR
- -16.6%
- Equity multiple
- 0.43×
- Total profit
- $-46,380
- Equity at exit
- $43,240
- IRR
- -14.7%
- Equity multiple
- 0.27×
- Total profit
- $-59,381
- Equity at exit
- $25,074
Cash invested: $81,200 (down + closing). Projections, not guarantees.
Landlord ↔ Tenant lean methodology
- Overall (STATE)
- 90 Strongly Landlord-Friendly
- State Louisiana
- 90 Strongly Landlord-Friendly · R+12
- County
- — inherits STATE
- City
- — inherits STATE
ZIP-level market 70005
- Rents YoY
- -0.3%
- Active inventory
- 178
- Price-to-rent
- 9.2×
Monthly cashflow live
- Estimated rent
- $2,620 high interval (Pro) →
- Mortgage (P&I)
- −$1,521
- Tax from tax record
- −$298 /mo · $3,572/yr
- Insurance
- −$121
- HOA
- −$0
- Vacancy / Maint / Mgmt
- −$550
- Net cashflow
- $130
Break-even live
Sensitivity live
| Price | -10% $294 | -5% $212 | +0% $130 | +5% $48 | +10% $-34 |
|---|---|---|---|---|---|
| Rent | -10% $-77 | -5% $27 | +0% $130 | +5% $234 | +10% $337 |
| Rate | -1.0pp $276 | -0.5pp $204 | base $130 | +0.5pp $55 | +1.0pp $-21 |
UW: 25.0% down · 7.5% · 30yr · 1.5% tax · 5.0% vac · 8.0% maint · 8.0% mgmt
Financing live
Cash to close
- Down payment
- $72,500
- Closing costs
- $8,700
- Reserves months
- —
- Total cash needed
- —
Loan-product check · same deal, 3 products live
Conventional
25% down · 7.5% · 30yr
- Down + closing
- —
- Monthly P&I
- —
- Monthly cashflow
- —
- DSCR
- —
- Eligible?
- —
Personal DTI + credit; lowest rate.
DSCR
20% down · 8.5% · 30yr
- Down + closing
- —
- Monthly P&I
- —
- Monthly cashflow
- —
- DSCR
- —
- Eligible?
- —
No personal income docs; deal must DSCR.
Hard money
10% down · 12.0% · 12mo
- Down + closing
- —
- Monthly P&I
- —
- Monthly cashflow
- —
- DSCR
- —
- Eligible?
- —
Short-term bridge; refi at stabilization.
Rent comps 40 comps
| Address | Beds | Baths | Sqft | Rent | $/sqft | DOM | Units | Dist |
|---|---|---|---|---|---|---|---|---|
| 728 Bonnabel Blvd Unit 1 Metairie, LA | 3.0 | 2.0 | 2000 | $3,500 | $1.75 | 45d | 1 | 0.12mi |
| 517 Beverly Garden Dr Metairie, LA | 3.0 | 2.0 | 1700 | $2,000 | $1.18 | 46d | 1 | 0.30mi |
| 437 Elmeer Ave Metairie, LA | 3.0 | 2.0 | 2041 | $3,950 | $1.94 | 23d | 1 | 0.45mi |
| 420 E William David Pkwy Metairie, LA | 2.0 | 2.0 | 1585 | $2,000 | $1.26 | 6d | 1 | 0.55mi |
| 1916 Metairie Heights Ave Metairie, LA | 4.0 | 2.0 | 2250 | $2,800 | $1.24 | 25d | 1 | 0.60mi |
| 261 Elmeer Ave Metairie, LA | 2.0 | 1.5 | 1650 | $1,725 | $1.05 | 45d | 1 | 0.60mi |
| 3017 Clifford Dr Metairie, LA | 3.0 | 2.0 | 1900 | $2,500 | $1.32 | 25d | 1 | 0.64mi |
| 517 Rosa Ave Metairie, LA | 3.0 | 2.0 | 1900 | $2,100 | $1.11 | 6d | 1 | 0.68mi |
| 1055 Bonnabel Blvd Metairie, LA | 3.0 | 2.0 | 1581 | $2,650 | $1.68 | 5d | 1 | 0.68mi |
| 1055 Bonnabel Blvd Metairie, LA | 3.0 | 2.0 | 1581 | $2,650 | $1.68 | 4d | 1 | 0.68mi |
| 644 Oaklawn Dr Metairie, LA | 3.0 | 2.0 | 1504 | $2,300 | $1.53 | 16d | 1 | 0.68mi |
| 3108 Ridgeway Dr Metairie, LA | 3.0 | 2.0 | 1446 | $2,100 | $1.45 | 6d | 1 | 0.69mi |
| 218 Aurora Ave Metairie, LA | 3.0 | 2.5 | 2500 | $2,500 | $1.00 | 25d | 1 | 0.71mi |
| 3104 Clifford Dr Metairie, LA | 4.0 | 2.0 | 2018 | $2,700 | $1.34 | 25d | 1 | 0.71mi |
| 801 Rue Burgundy #215 Metairie, LA | 2.0 | 2.0 | 1763 | $3,500 | $1.99 | 45d | 1 | 0.80mi |
| 801 Rue Burgundy #319 Metairie, LA | 2.0 | 2.0 | 1763 | $3,250 | $1.84 | 16d | 1 | 0.80mi |
| 849 Rosa Ave Unit 1 Metairie, LA | 4.0 | 3.0 | 2392 | $2,650 | $1.11 | 25d | 1 | 0.84mi |
| 132 Hesper Ave Metairie, LA | 4.0 | 4.0 | 2598 | $5,500 | $2.12 | 45d | 1 | 0.84mi |
| 130 Helios Ave Metairie, LA | 2.0 | 2.5 | 1793 | $2,600 | $1.45 | 16d | 1 | 0.85mi |
| 209 Rosa Ave Metairie, LA | 3.0 | 2.5 | 2400 | $2,000 | $0.83 | 16d | 1 | 0.86mi |
| 375 Aris Ave Metairie, LA | 4.0 | 2.0 | 1480 | $2,100 | $1.42 | 25d | 1 | 0.95mi |
| 1253 Bonnabel Blvd Metairie, LA | 3.0 | 2.5 | 1660 | $2,350 | $1.42 | 25d | 1 | 1.00mi |
| 2328 Metairie Rd Unit 300 Metairie, LA | 2.0 | 2.0 | 1576 | $3,300 | $2.09 | 45d | 1 | 1.13mi |
| 3011 46th St Metairie, LA | 3.0 | 1.0 | 1488 | $2,200 | $1.48 | 45d | 1 | 1.13mi |
| 261 Hollywood Dr Unit C Metairie, LA | 3.0 | 1.0 | 1400 | $2,300 | $1.64 | 6d | 1 | 1.17mi |
| 1117 Andrews Ave Metairie, LA | 3.0 | 2.0 | 1770 | $2,600 | $1.47 | 45d | 1 | 1.18mi |
| 3708 Saratoga Dr Metairie, LA | 3.0 | 2.5 | 1700 | $1,800 | $1.06 | 45d | 1 | 1.32mi |
| 6256 Bellaire Dr Unit 6254 New Orleans, LA | 3.0 | 2.0 | 1510 | $1,850 | $1.23 | 22d | 1 | 1.34mi |
| 3710 Lilac Ln Unit 2111 Metairie, LA | 3.0 | 2.5 | 1800 | $1,630 | $0.91 | 25d | 1 | 1.34mi |
| 3710 Lilac Ln Unit 2509 Metairie, LA | 3.0 | 2.5 | 1800 | $1,705 | $0.95 | 23d | 1 | 1.34mi |
| 3717 Lilac Ln Metairie, LA | 4.0 | 2.5 | 2308 | $2,350 | $1.02 | 25d | 1 | 1.34mi |
| 428 16th St New Orleans, LA | 3.0 | 2.0 | 1682 | $2,350 | $1.40 | 19d | 1 | 1.35mi |
| 3725 Lilac Ln Metairie, LA | 3.0 | 2.5 | 1766 | $2,200 | $1.25 | 6d | 1 | 1.36mi |
| 309 Lilac St Metairie, LA | 3.0 | 2.5 | 1750 | $1,745 | $1.00 | 45d | 1 | 1.36mi |
| 1437 Ocean Dr Metairie, LA | 3.0 | 2.0 | 1850 | $2,600 | $1.41 | 45d | 1 | 1.37mi |
| 3731 Bunker Hill Dr Metairie, LA | 3.0 | 2.0 | 1600 | $1,900 | $1.19 | 25d | 1 | 1.39mi |
| 3738 S I-10 Service Rd W Metairie, LA | 3.0 | 2.5 | 1700 | $1,650 | $0.97 | 6d | 1 | 1.40mi |
| 2421 Caswell Ln Metairie, LA | 3.0 | 2.0 | 1450 | $1,750 | $1.21 | 6d | 1 | 1.41mi |
| 312 W Esplanade Ave Metairie, LA | 3.0 | 2.5 | 1400 | $1,600 | $1.14 | 45d | 1 | 1.43mi |
| 2520 Caswell Ln Metairie, LA | 3.0 | 2.5 | 1795 | $1,800 | $1.00 | 3d | 1 | 1.43mi |
Listing history 7 events
-
2026-06-21days on market $290,000 Active 8 DOM
-
2026-06-18days on market $290,000 Active 5 DOM
-
2026-06-17days on market $290,000 Active 4 DOM
-
2026-06-16days on market $290,000 Active 3 DOM
-
2026-06-15days on market $290,000 Active 2 DOM
-
2026-06-13remarks 494-char remark
-
2026-06-13$290,000 Active 1 DOM
ⓘ Source: listings_history table (triggers on properties + properties_extension) + one-shot
backfill from property_details.listing_events for pre-trigger history.
Tax reassessment forecast LA · Resets to sale price
- Current annual tax
- $3,572 · $298/mo
- Projected year-2 tax
- $3,572 · $298/mo
- Expected delta
- $0/yr ($0/mo · 0.0%)
ⓘ Screening estimate from a state-policy table — verify with the county assessor before closing.
Nearby sold comps map
Loading sold comps map…
Walkable amenities ~0.75 mi
Loading nearby amenities…
Taxation est. · year 1
- Rental income
- $31,434
- − Mortgage interest
- −$16,245
- − Property taxes
- −$3,572
- − Insurance
- −$1,450
- − Repairs & maintenance
- −$2,515
- − Management
- −$2,515
- − Depreciation
- −$8,436
- Taxable loss
- −$3,298
- Est. tax savings @ 24.0%
- +$791
- After-tax cash flow
- $2,353/yr
For passive investors: Depreciation is non-cash, so a rental often shows a tax loss while cash-flowing — sheltering income. Rental losses are passive: they offset passive income freely, and up to $25,000/yr can offset ordinary (W-2) income if you actively participate and your MAGI is under $100k (phasing out to $0 by $150k); unused losses carry forward. On sale, claimed depreciation is recaptured at up to 25%, and gains may owe capital-gains tax (a 1031 exchange can defer both). Figures are a year-1 estimate at your 24.0% rate — not tax advice; consult a CPA.
Schools (NCES district)
- District
- Jefferson Parish
- NCES district ID
- 2200840
- Math proficiency
- 24% ▼ -36.00%
- Reading proficiency
- 34% ▼ -30.00%
- Median HH income
- $48,421
- Composite
- 25.19/100
- National rank
- #7511
- State rank
- #44 of 98 in LA
Livability — Metairie
- Score
- 87/100
- State rank
- #1
- US rank
- #261
Category grades
Schools grade is shown separately in the Schools card above.
Census & demographics
- Census place
- Metairie, LA
- County
- Jefferson Parish · 426,999 people
- City population
- 137,978
- Metro
- New Orleans-Metairie, LA
- Population (ZIP)
- 24,088
- Household income
- $89,194
- Rent vs Own
- Severe rent burden
- 711.0
Population outlook (Jefferson County) Hauer SSP2
- Today (2025)
- 451,696 people
- By 2030
- 455,451 · +0.8%
- By 2040
- 458,308 · +1.5%
- By 2050
- 461,031 · +2.1%
- By 2075
- 476,351 · +5.5%
- By 2100
- 499,377 · +10.6%
Race, ethnicity, and origin ACS 2023
- Neighborhood character
- Predominantly White (81%)
- Race & ethnicity
- White 81% Hispanic / Latino 13% Two or more races 8% Asian 2% Native American 2% Black 1%
- Hispanic origin (detail)
- Mexican 1%
- Common ancestry
- Lithuanian 21% Slovak 2% Iranian 1%
- Foreign-born
- 9% · Canada, China, Vietnam
- Languages at home
- 89% English-only · Spanish 8% French/Haitian/Cajun 1% Other Indo-European 1%
Political lean MEDSL · Jefferson
- 2024 margin
- R (+12.9) · D 42.5% · R 55.5% · Other 2.1%
- 2008→2024 swing
- +13.6pp toward D · 2008: -26.6pp · 2024: -12.9pp
- All cycles
- 2024: R+12.9 2020: R+11.1 2016: R+14.8 2012: R+18.4 2008: R+26.6
Not yet ingested
- Civics
- —
Market trends
- HPI YoY
- ▼ -371.32%
- Current HPI
- 142.4955
- Rent YoY
- ▼ -0.31%
- Metro
- New Orleans-Metairie, LA
- State GDP YoY
- ▲ 3.29%
- F500 in state
- 10
Industry mix (Fortune 500 HQ in LA)
| Industry | F500 HQs | Revenue |
|---|---|---|
| Telecommunications | 2 | $23B |
|
||
| Utilities | 1 | $12B |
|
||
| Wholesale / Distribution | 1 | $5B |
|
||
| Advertising | 1 | $2B |
|
||
Price history
+245.2% since first listed2 events — show timeline
- 2026-06-13 Listed $290,000 ForSaleByOwner.com
- 1985-03-01 Sold (Public Records) $84,000 Public Records
Property tax history
+2.6%/yrLatest (2025): $3,572 · +0.2% YoY. Source: county tax records.
Cash-flow waterfall
monthlySold comps — $/sqft
last 12 mo · ≤1 miLoading sold comps…