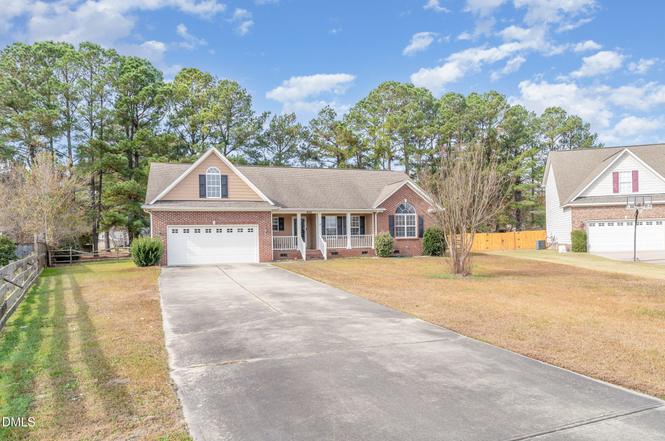
4101 Desert Cove Cir · Vander, NC
Flood risk 1/10 · Minimal
- FEMA flood zone
- X (unshaded)
- Chance of flooding over 30 yrs
- 0.0%
- Est. flood insurance / yr
- $507 – $1,088
Fire risk 6/10 · Moderate
- Est. fire insurance / yr
- $906 – $1,684
Heat risk 7/10 · Major
- Hot days now (above 106°F)
- 7 days/yr
- Hot days in 30 yrs
- 16 days/yr
Wind risk 8/10 · Major
- Chance of severe wind over 30 yrs
- 80.0%
Air-quality risk 1/10 · Minimal
- Unhealthy air days now
- 0 days/yr
- Unhealthy air days in 30 yrs
- 0 days/yr
Risk factors via First Street. Map © Google.
Why this score? — see what drove the D+ grade
The composite is a weighted blend of 9 inputs, each scored 0–100. Each bar is that input's sub-score; the figure is the points it added to the 100-point composite (weight × sub-score).
- ARV discount +13.2/15.0
- Appreciation +10.0/10.0
- Cash flow +8.0/30.0
- Schools +3.1/10.0
- Livability +2.8/5.0
- Rent growth +2.5/5.0
- Condition / age +2.5/5.0
- DSCR +2.1/10.0
- 1% rule +1.7/10.0
$300,000
🖨 Deal sheet 📄 Offer letter ✓ Due diligence
Listing remarks
Major $20K price improvement! This beautiful Fayetteville home just became one of the best values in the area. Spacious layout, large lot, and located on a quiet cul-de-sac. Seller is motivated and reviewing offers. Schedule your showing today before this opportunity is gone. Welcome to this gorgeous home, ideally situated at the end of a quiet cul-de-sac in one of Fayetteville's most desirable communities--with no HOA and city water and sewer. Built in 2005, this 3-bedroom, 2-bathroom residence with a bonus room offers almost 2,000 square feet of thoughtfully designed living space on nearly half an acre. The light-filled, open-concept layout features soaring vaulted and coffered ceilings,
Key facts
- Quiet cul-de-sac
- City water and sewer
- No hoa
Tags
Neighborhood map
What this means for you Summary
Snapshot
- This is a 3-bed/3.0-bath single-family listed at $300k.
Deal economics
- At list price, monthly cash flow is $-307 ($-4k/yr) — negative.
- To cash-flow at today's rent, offer at most $246k (18.1% below list).
- To meet the 1% rule (rent ≥ 1% of price), the offer needs to be $201k (32.9% below list).
- Recommended offer: $201k (32.9% below list) — sets the bar for 1% rule.
- Cap rate 5.1% vs local median 3.9% in Vander — top-decile yield for the area; either an underpriced asset or a hidden risk that comps aren't pricing in. Stress-test before assuming the spread holds.
Location & tenants
- Location reads 55/100 on livability (#645 in NC) — a working-class tenant base; expect higher turnover. Strengths: cost of living A+, crime A, employment B+; Watch: amenities F, commute F, housing F.
- Cumberland County Schools (urban): math 32% / reading 41% proficiency, ranked #126 of 178 in NC (top 71%) — families likely to look elsewhere, expect single-tenant / working-renter base with shorter leases.
- Zoned schools: Mac Williams Middle (math 40% / reading 50%, grade D, #160 of 475 statewide, top 35%, 1,151 students, 58% FRL); Cape Fear High (math 75% / reading 47%, grade C+, #202 of 535 statewide, top 39%, 1,529 students, 50% FRL) — zoned schools at 54% FRL track the district average.
- Zoned-school proficiency averages 53% at this address vs 36% district-wide (+16 pts) — the actual schools serving this property are materially stronger than the Cumberland County Schools average implies; a family-tenant draw the district grade alone would hide.
- Market conditions: 222 active listings in the ZIP; 5 comparable units currently listed for rent nearby; rentals leasing fast (median 14d on market — plan ~1-2 weeks tenant-placement turnaround); 1,125 units permitted in Cumberland County in 2024 (104 in 5+ unit buildings).
Forward outlook
- In year one you build about $32k of equity ($2k loan paydown + $30k appreciation (10.0% local appreciation)).
- By year 2, paydown + projected appreciation supports a ~$52k cash-out refi (75% LTV) — recoverable capital for the next deal without selling this one.
Negotiation context
- It's been on market 67 days — a 6% lower offer ($282k) is reasonable based on typical stale-listing flexibility.
- 8 sale attempts since 15y ago; this cycle's ask has dropped $20k (6%) from the opening price — seller is motivated, your offer sets the floor, not the list.
- Current owner paid $255k; 18% above their basis — modest negotiation headroom, anchor on the comps not their cost.
Risks & watch-outs
- Climate carrying-cost: severe wind risk, 80% chance of damaging wind over 30y; major wildfire risk; extreme-heat days projected 7→16/yr by 2055 (HVAC capex compounding) — expect insurance premiums to compound above CPI over the hold.
Questions for the listing agent
- What do current leases actually rent for vs. the listed asking? Can we see a recent rent roll and the last 12 months of T-12 income?
- It's been on market 67 days. Have you received any prior offers? Is the seller open to a 33% concession, seller financing, or rate buy-down credit?
- Why hasn't it sold? Are there any deal-killer items the seller is aware of (foundation, flood, title, zoning, code violations)?
- Is there a deadline driving the sale (1031 exchange, divorce, estate, relocation)? That informs how much negotiation room exists.
- Schools are F-rated, which usually means shorter tenancies and higher turnover. Who's the typical renter profile here, and what's been the actual vacancy rate?
- The area grade is low — what's the realistic commute time and amenity access for the typical tenant pool here? Any planned neighborhood developments (good or bad) we should know about?
- What's the average days-on-market for RENTAL listings here right now (not sales)? A rising rental-DOM trend means longer vacancies and softer asking-rent achievability than the comps imply.
- What's the recent tenant-quality profile in this submarket — average credit score on applications, eviction rate, late-payment / NSF rate, and stable-employment percentage? A property-management company in the area should have these aggregated.
- How much new for-sale + rental construction is in the pipeline within 1–3 miles? Heavy new supply typically softens prices + rents 12–24 months out; constrained supply supports both.
Investment metrics
- 1% rule
- 0.67% ✗
- Cap rate
- 5.07%
- Cash-on-cash
- -4.38%
- DSCR
- 0.81
- GRM
- 12.4
CMA / ARV
- ARV (on-the-fly)
- $343,578
- Comps found
- 4
Show comp detail 4 sales within ~0.75 mi
| Address | Dist | Beds/Ba | Sqft | Sold | Price | $/sf | Match |
|---|---|---|---|---|---|---|---|
| 716 Baywood Rd | 0.05mi | 4/2.5 (+1) | 1,911 (-4%) | 23mo | $329,900 | $173 | 65 |
| 917 Satinwood Ct | 0.64mi | 3/2.0 | 1,848 (-7%) | 15mo | $314,900 | $170 | 42 |
| 845 Satinwood Ct | 0.62mi | 3/2.5 | 2,182 (+10%) | 14mo | $375,000 | $172 | 41 |
| 948 Satinwood Ct | 0.70mi | 4/2.5 (+1) | 2,237 (+13%) | 13mo | $400,000 | $179 | 29 |
Match score weights: distance 35% · size 25% · config 20% · recency 20%. Top-matched comps best support the ARV.
Projected returns pro-forma
10.0% appreciation · 3.0% rent growth · sell at horizon
- IRR
- 21.2%
- Equity multiple
- 2.71×
- Total profit
- $143,778
- Equity at exit
- $270,264
- IRR
- 19.1%
- Equity multiple
- 6.22×
- Total profit
- $438,607
- Equity at exit
- $582,834
Cash invested: $84,000 (down + closing). Projections, not guarantees.
Landlord ↔ Tenant lean methodology
- Overall (STATE)
- 85 Strongly Landlord-Friendly
- State North Carolina
- 85 Strongly Landlord-Friendly · R+3
- County
- — inherits STATE
- City
- — inherits STATE
ZIP-level market 28312
- Home prices YoY
- 6.9%
- Active inventory
- 222
- Price-to-rent
- 12.4×
Monthly cashflow live
- Estimated rent
- $2,013 high interval (Pro) →
- Mortgage (P&I)
- −$1,573
- Tax from tax record
- −$199 /mo · $2,385/yr
- Insurance
- −$125
- HOA
- −$0
- Vacancy / Maint / Mgmt
- −$423
- Net cashflow
- $-307
Break-even live
UW: 25.0% down · 7.5% · 30yr · 1.5% tax · 5.0% vac · 8.0% maint · 8.0% mgmt
Financing live
Cash to close
- Down payment
- $75,000
- Closing costs
- $9,000
- Reserves months
- —
- Total cash needed
- —
Loan-product check · same deal, 3 products live
Conventional
25% down · 7.5% · 30yr
- Down + closing
- —
- Monthly P&I
- —
- Monthly cashflow
- —
- DSCR
- —
- Eligible?
- —
Personal DTI + credit; lowest rate.
DSCR
20% down · 8.5% · 30yr
- Down + closing
- —
- Monthly P&I
- —
- Monthly cashflow
- —
- DSCR
- —
- Eligible?
- —
No personal income docs; deal must DSCR.
Hard money
10% down · 12.0% · 12mo
- Down + closing
- —
- Monthly P&I
- —
- Monthly cashflow
- —
- DSCR
- —
- Eligible?
- —
Short-term bridge; refi at stabilization.
Rent comps 5 comps
| Address | Beds | Baths | Sqft | Rent | $/sqft | DOM | Units | Dist |
|---|---|---|---|---|---|---|---|---|
| 4066 Hummingbird Pl Fayetteville, NC | 3.0 | 2.0 | 1324 | $1,650 | $1.25 | 23d | 1 | 0.65mi |
| 903 Penguin Dr Fayetteville, NC | 4.0 | 2.0 | 1865 | $2,100 | $1.13 | 21d | 1 | 1.13mi |
| 4211 Cherry Hill Ln Fayetteville, NC | 4.0 | 2.5 | 2341 | $2,145 | $0.92 | 13d | 1 | 1.34mi |
| 4243 Cinder Ln Fayetteville, NC | 4.0 | 3.0 | 2144 | $2,085 | $0.97 | 13d | 1 | 1.43mi |
| 4233 Pleasantburg Dr Fayetteville, NC | 4.0 | 2.5 | 2252 | $2,300 | $1.02 | 13d | 1 | 1.49mi |
Listing history 16 events
-
2026-03-30status Pending
-
2026-03-12price $300,000
-
2026-01-22$320,000 Active
-
2023-06-22$320,000 Active
-
2023-05-01$320,000 Active
-
2023-04-26$325,000 Active
-
2021-08-19soldstatus $255,000
-
2021-08-19soldstatus $255,000
-
2021-07-01$250,000
-
2020-05-14soldstatus $160,000
-
2020-05-14soldstatus $160,000
-
2020-01-06$149,500
-
2020-01-06$149,500
-
2011-03-15soldstatus $195,000
-
2011-03-15soldstatus $195,000
-
2011-01-18$194,000
ⓘ Source: listings_history table (triggers on properties + properties_extension) + one-shot
backfill from property_details.listing_events for pre-trigger history.
Tax reassessment forecast NC · Resets to sale price
- Current annual tax
- $2,385 · $199/mo
- Projected year-2 tax
- $2,460 · $205/mo
- Expected delta
- +$75/yr (+$6/mo · 3.1%)
ⓘ Screening estimate from a state-policy table — verify with the county assessor before closing.
Climate risk First Street
- Flood 1/10 Low FEMA zone X (unshaded) · 0% chance over 30 yrs
- Wildfire 6/10 Major
- Heat 7/10 Severe 7 d/yr ≥106°F today · 16 d/yr by 30 yrs out
- Wind 8/10 Severe 80% chance of damaging wind over 30 yrs
- Air quality 1/10 Low 0 unhealthy d/yr today · 0 by 30 yrs out
Nearby sold comps map
Loading sold comps map…
Walkable amenities ~0.75 mi
Loading nearby amenities…
Taxation est. · year 1
- Rental income
- $24,157
- − Mortgage interest
- −$16,805
- − Property taxes
- −$2,385
- − Insurance
- −$1,500
- − Repairs & maintenance
- −$1,933
- − Management
- −$1,933
- − Depreciation
- −$8,727
- Taxable loss
- −$9,125
- Est. tax savings @ 24.0%
- +$2,190
- After-tax cash flow
- $-1,490/yr
For passive investors: Depreciation is non-cash, so a rental often shows a tax loss while cash-flowing — sheltering income. Rental losses are passive: they offset passive income freely, and up to $25,000/yr can offset ordinary (W-2) income if you actively participate and your MAGI is under $100k (phasing out to $0 by $150k); unused losses carry forward. On sale, claimed depreciation is recaptured at up to 25%, and gains may owe capital-gains tax (a 1031 exchange can defer both). Figures are a year-1 estimate at your 24.0% rate — not tax advice; consult a CPA.
Schools (NCES district)
- District
- Cumberland County Schools
- NCES district ID
- 3700011
- Math proficiency
- 32% ▼ -2.00%
- Reading proficiency
- 41% ▼ -1.00%
- Median HH income
- $44,168
- Composite
- 31.0/100
- National rank
- #6096
- State rank
- #126 of 178 in NC
Livability — Vander
- Score
- 55/100
- State rank
- #645
- US rank
- #23450
Category grades
Schools grade is shown separately in the Schools card above.
Census & demographics
- Population (ZIP)
- 19,889
Population outlook (Cumberland County) Hauer SSP2
- Today (2025)
- 330,855 people
- By 2030
- 333,523 · +0.8%
- By 2040
- 335,583 · +1.4%
- By 2050
- 335,325 · +1.4%
- By 2075
- 342,853 · +3.6%
- By 2100
- 340,698 · +3.0%
Race, ethnicity, and origin ACS 2023
- Neighborhood character
- Diverse neighborhood (Simpson 0.61)
- Race & ethnicity
- White 55% Black 29% Two or more races 8% Hispanic / Latino 8% Native American 2%
- Hispanic origin (detail)
- Mexican 4% Puerto Rican 2%
- Common ancestry
- Slovak 3% Serbian 2% Italian 2%
- Foreign-born
- 4% · Canada
- Languages at home
- 93% English-only · Spanish 5% French/Haitian/Cajun 1%
Political lean MEDSL · Cumberland
- 2024 margin
- D (+13.4) · D 56.1% · R 42.7% · Other 1.2%
- 2008→2024 swing
- -4.3pp toward R · 2008: 17.7pp · 2024: 13.4pp
- All cycles
- 2024: D+13.4 2020: D+16.6 2016: D+16.0 2012: D+19.7 2008: D+17.7
Not yet ingested
- Civics
- —
Market trends
- HPI YoY
- ▲ 19.75%
- Current HPI
- 306.7749
- Rent YoY
- —
- Metro
- —
- State GDP YoY
- ▲ 3.28%
- F500 in state
- 26
Industry mix (Fortune 500 HQ in NC)
| Industry | F500 HQs | Revenue |
|---|---|---|
| Financial Services | 2 | $213B |
|
||
| Retail | 2 | $95B |
|
||
| Industrial Conglomerate | 1 | $38B |
|
||
| Metals / Steel | 1 | $35B |
|
||
| Utilities | 1 | $30B |
|
||
| Industrial Machinery | 1 | $19B |
|
||
Price history
+54.6% since first listed16 events — show timeline
- 2026-03-30 Pending — TMLS
- 2026-03-12 Price Changed $300,000 TMLS
- 2026-01-22 Listed $320,000 TMLS
- 2023-06-22 Listed $320,000 LPRMLS
- 2023-05-01 Listed $320,000 LPRMLS
- 2023-04-26 Listed $325,000 LPRMLS
- 2021-08-19 Sold (Public Records) $255,000 Public Records
- 2021-08-19 Sold (MLS) $255,000 LPRMLS
- 2021-07-01 Listed $250,000 LPRMLS
- 2020-05-14 Sold (MLS) $160,000 TMLS
- 2020-05-14 Sold (MLS) $160,000 LPRMLS
- 2020-01-06 Listed $149,500 TMLS
- 2020-01-06 Listed $149,500 LPRMLS
- 2011-03-15 Sold (Public Records) $195,000 Public Records
- 2011-03-15 Sold (MLS) $195,000 TMLS
- 2011-01-18 Listed $194,000 TMLS
Property tax history
+2.0%/yrLatest (2025): $2,385 · +14.2% YoY. Source: county tax records.
Cash-flow waterfall
monthlySold comps — $/sqft
last 12 mo · ≤1 miLoading sold comps…