235 Chestnut St · Big Pine, CA
Flood risk 6/10 · Moderate
- FEMA flood zone
- X (unshaded)
- Chance of flooding over 30 yrs
- 0.74%
- Est. flood insurance / yr
- $507 – $1,088
Fire risk 6/10 · Moderate
- Est. fire insurance / yr
- $659 – $1,223
Heat risk 6/10 · Moderate
- Hot days now (above 99°F)
- 7 days/yr
- Hot days in 30 yrs
- 21 days/yr
Wind risk 1/10 · Minimal
- Chance of severe wind over 30 yrs
- —
Air-quality risk 10/10 · Severe
- Unhealthy air days now
- 27 days/yr
- Unhealthy air days in 30 yrs
- 28 days/yr
Risk factors via First Street. Map © Google.
Why this score? — see what drove the D grade
The composite is a weighted blend of 9 inputs, each scored 0–100. Each bar is that input's sub-score; the figure is the points it added to the 100-point composite (weight × sub-score).
- Cash flow +15.6/30.0
- ARV discount +7.5/15.0
- DSCR +4.8/10.0
- 1% rule +3.8/10.0
- Livability +3.1/5.0
- Schools +2.7/10.0
- Rent growth +2.5/5.0
- Condition / age +2.5/5.0
- Appreciation +0.0/10.0
$105,000
🖨 Deal sheet 📄 Offer letter ✓ Due diligence
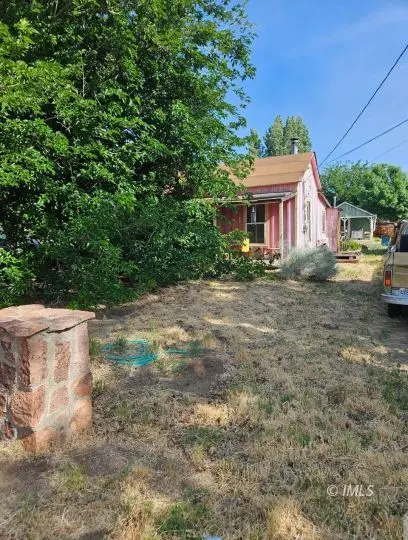
Listing remarks
This 2 bedroom, 2 bath property with multiple buildings requires a complete renovation or teardown to build fresh. An excellent opportunity for a buyer looking to build their dream home in a convenient, well-located area. Close to schools and local eateries, this parcel offers strong potential for future development in a desirable neighborhood.
Key facts
- Complete renovation
- Well-located area
- Built 1910
Tags
Property features AI
Finance
- Other: Located in the Big Pine subdivision
Exterior
- Home design: Single-family residence; One story
- Construction: Wood siding construction; Built on standard foundation
- Exterior features: Composition roof
Interior
- Bathrooms: 2 full bathrooms
- Interior features: Two full bathrooms
Neighborhood map
What this means for you Summary
Snapshot
- This is a 1-bed/1.0-bath single-family listed at $105k.
Deal economics
- At list price, monthly cash flow is $44 ($534/yr) — positive.
- The deal already cash-flows at list — no discount required.
- To meet the 1% rule (rent ≥ 1% of price), the offer needs to be $92k (12.0% below list).
- Recommended offer: $92k (12.0% below list) — sets the bar for 1% rule.
Location & tenants
- Location reads 61/100 on livability (#529 in CA) — a middle-class / working-renter tenant base. Strengths: housing A, crime A-, commute A-; Watch: schools F, amenities F, cost of living F.
- Big Pine Unified (rural): math 25% / reading 30% proficiency, ranked #1,086 of 1,400 in CA (top 78%) — low school quality limits family demand, transient renter base, plan for 1-2y turnover; 64% free/reduced lunch — lower-income household profile, screen leases tightly.
- Market conditions: 9 active listings in the ZIP; 18 units permitted in Inyo County in 2024 (0 in 5+ unit buildings).
Forward outlook
- Local home prices are declining (-3.0%/yr); year-one equity from $726 of loan paydown is wiped out by about $3k of value loss. Plan a longer hold.
- Inyo County population projected at -18% by 2050 — secular population decline; favor cash flow + early exit over multi-decade hold.
Negotiation context
- Only 5 days on market — expect competitive offers; lowballing is unlikely to land.
Risks & watch-outs
- Watch-outs: built in 1910 — expect roof / HVAC / electrical / plumbing capex.
- Climate carrying-cost: major flood risk; major wildfire risk; extreme-heat days projected 7→21/yr by 2055 (HVAC capex compounding) — expect insurance premiums to compound above CPI over the hold.
Questions for the listing agent
- Built in 1910 — when were the roof, HVAC, electrical panel, plumbing, and water heater last replaced?
- Is there a deadline driving the sale (1031 exchange, divorce, estate, relocation)? That informs how much negotiation room exists.
- Schools are F-rated, which usually means shorter tenancies and higher turnover. Who's the typical renter profile here, and what's been the actual vacancy rate?
- The area grade is low — what's the realistic commute time and amenity access for the typical tenant pool here? Any planned neighborhood developments (good or bad) we should know about?
- What's the average days-on-market for RENTAL listings here right now (not sales)? A rising rental-DOM trend means longer vacancies and softer asking-rent achievability than the comps imply.
- What's the recent tenant-quality profile in this submarket — average credit score on applications, eviction rate, late-payment / NSF rate, and stable-employment percentage? A property-management company in the area should have these aggregated.
- How much new for-sale + rental construction is in the pipeline within 1–3 miles? Heavy new supply typically softens prices + rents 12–24 months out; constrained supply supports both.
Investment metrics
- 1% rule
- 0.88% ✗
- Cap rate
- 6.80%
- Cash-on-cash
- 1.82%
- DSCR
- 1.08
- GRM
- 9.5
CMA / ARV
- ARV (median comp)
- $338,292
- List price
- $105,000
- Delta
- -68.96%
- Verdict
- UNDERPRICED
- Comps
- 4 within 1.0 mi
Projected returns pro-forma
-3.0% appreciation · 3.0% rent growth · sell at horizon
- IRR
- -13.4%
- Equity multiple
- 0.52×
- Total profit
- $-14,192
- Equity at exit
- $15,656
- IRR
- -4.5%
- Equity multiple
- 0.70×
- Total profit
- $-8,753
- Equity at exit
- $9,078
Cash invested: $29,400 (down + closing). Projections, not guarantees.
Landlord ↔ Tenant lean methodology
- Overall (STATE)
- 18 Strongly Tenant-Friendly
- State California
- 18 Strongly Tenant-Friendly · D+13
- County
- — inherits STATE
- City
- — inherits STATE
ZIP-level market 93513
- Home prices YoY
- -5.8%
- Active inventory
- 9
- Price-to-rent
- 9.5×
Monthly cashflow live
- Estimated rent
- $924 medium interval (Pro) →
- Mortgage (P&I)
- −$551
- Tax from tax record
- −$91 /mo · $1,098/yr
- Insurance
- −$44
- HOA
- −$0
- Vacancy / Maint / Mgmt
- −$194
- Net cashflow
- $44
Break-even live
UW: 25.0% down · 7.5% · 30yr · 1.5% tax · 5.0% vac · 8.0% maint · 8.0% mgmt
Financing live
Cash to close
- Down payment
- $26,250
- Closing costs
- $3,150
- Reserves months
- —
- Total cash needed
- —
Loan-product check · same deal, 3 products live
Conventional
25% down · 7.5% · 30yr
- Down + closing
- —
- Monthly P&I
- —
- Monthly cashflow
- —
- DSCR
- —
- Eligible?
- —
Personal DTI + credit; lowest rate.
DSCR
20% down · 8.5% · 30yr
- Down + closing
- —
- Monthly P&I
- —
- Monthly cashflow
- —
- DSCR
- —
- Eligible?
- —
No personal income docs; deal must DSCR.
Hard money
10% down · 12.0% · 12mo
- Down + closing
- —
- Monthly P&I
- —
- Monthly cashflow
- —
- DSCR
- —
- Eligible?
- —
Short-term bridge; refi at stabilization.
Listing history 1 events
-
2026-05-14$105,000 Active 346-char remark
ⓘ Source: listings_history table (triggers on properties + properties_extension) + one-shot
backfill from property_details.listing_events for pre-trigger history.
Tax reassessment forecast CA · Resets to sale price
- Current annual tax
- $1,098 · $91/mo
- Projected year-2 tax
- $1,098 · $91/mo
- Expected delta
- $0/yr ($0/mo · 0.0%)
ⓘ Screening estimate from a state-policy table — verify with the county assessor before closing.
Climate risk First Street
- Flood 6/10 Major FEMA zone X (unshaded) · 74% chance over 30 yrs
- Wildfire 6/10 Major
- Heat 6/10 Major 7 d/yr ≥99°F today · 21 d/yr by 30 yrs out
- Wind 1/10 Low
- Air quality 10/10 Extreme 27 unhealthy d/yr today · 28 by 30 yrs out
Nearby sold comps map
Loading sold comps map…
Walkable amenities ~0.75 mi
Loading nearby amenities…
Taxation est. · year 1
- Rental income
- $11,094
- − Mortgage interest
- −$5,882
- − Property taxes
- −$1,098
- − Insurance
- −$525
- − Repairs & maintenance
- −$888
- − Management
- −$888
- − Depreciation
- −$3,055
- Taxable loss
- −$1,240
- Est. tax savings @ 24.0%
- +$298
- After-tax cash flow
- $831/yr
For passive investors: Depreciation is non-cash, so a rental often shows a tax loss while cash-flowing — sheltering income. Rental losses are passive: they offset passive income freely, and up to $25,000/yr can offset ordinary (W-2) income if you actively participate and your MAGI is under $100k (phasing out to $0 by $150k); unused losses carry forward. On sale, claimed depreciation is recaptured at up to 25%, and gains may owe capital-gains tax (a 1031 exchange can defer both). Figures are a year-1 estimate at your 24.0% rate — not tax advice; consult a CPA.
Schools (NCES district)
- District
- Big Pine Unified
- NCES district ID
- 0604950
- Math proficiency
- 25% ▲ 5.00%
- Reading proficiency
- 30% ▲ 5.00%
- Median HH income
- $53,682
- Composite
- 27.41/100
- National rank
- #12395
- State rank
- #1086 of 1400 in CA
Livability — Big Pine
- Score
- 61/100
- State rank
- #529
- US rank
- #17742
Category grades
Schools grade is shown separately in the Schools card above.
Census & demographics
- Census place
- Big Pine, CA
- Population (ZIP)
- 1,525
Population outlook (Inyo County) Hauer SSP2
- Today (2025)
- 17,399 people
- By 2030
- 16,824 · -3.3%
- By 2040
- 15,543 · -10.7%
- By 2050
- 14,332 · -17.6%
- By 2075
- 12,213 · -29.8%
- By 2100
- 9,997 · -42.5%
Race, ethnicity, and origin ACS 2023
- Neighborhood character
- Diverse neighborhood (Simpson 0.63)
- Race & ethnicity
- White 59% Native American 20% Hispanic / Latino 14% Two or more races 6%
- Hispanic origin (detail)
- Mexican 11%
- Common ancestry
- Lithuanian 4% Slovak 2% Iranian 2%
- Foreign-born
- 3% · Canada
- Languages at home
- 87% English-only · Spanish 8%
Political lean MEDSL · Inyo
- 2024 margin
- Toss-up / Even · D 46.9% · R 49.9% · Other 3.1%
- 2008→2024 swing
- +6.2pp toward D · 2008: -9.2pp · 2024: -3.0pp
- All cycles
- 2024: R+3.0 2020: D+0.1 2016: R+13.7 2012: R+11.8 2008: R+9.2
Not yet ingested
- Civics
- —
Market trends
- HPI YoY
- ▼ -19.49%
- Current HPI
- 316.75
- Rent YoY
- —
- Metro
- —
- State GDP YoY
- ▲ 3.21%
- F500 in state
- 116
Industry mix (Fortune 500 HQ in CA)
| Industry | F500 HQs | Revenue |
|---|---|---|
| Technology | 27 | $1,492B |
|
||
| Financial Services | 3 | $174B |
|
||
| Retail | 3 | $44B |
|
||
| Insurance | 3 | $26B |
|
||
| Media / Entertainment | 2 | $115B |
|
||
| Pharmaceuticals / Biotech | 2 | $62B |
|
||
Price history
2 events — show timeline
- 2026-05-20 Pending — IMLS
- 2026-05-14 Listed $105,000 IMLS
Property tax history
+7.0%/yrLatest (2025): $1,098 · +4.9% YoY. Source: county tax records.
Cash-flow waterfall
monthlySold comps — $/sqft
last 12 mo · ≤1 miLoading sold comps…