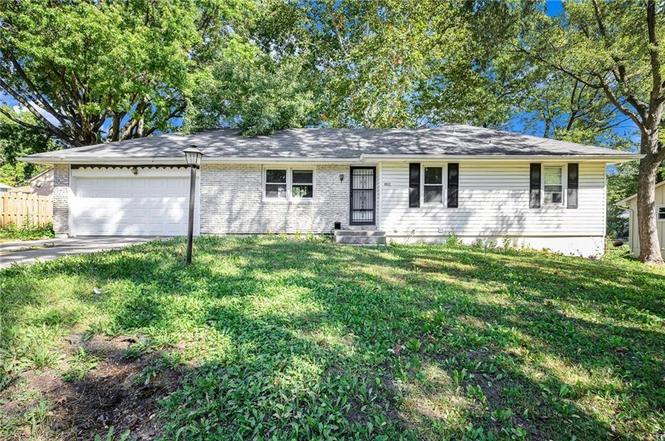
801 N Redwood Dr · Independence, MO
Flood risk 1/10 · Minimal
- FEMA flood zone
- X (unshaded)
- Chance of flooding over 30 yrs
- 0.0%
- Est. flood insurance / yr
- $473 – $860
Fire risk 1/10 · Minimal
- Est. fire insurance / yr
- $1,054 – $1,958
Heat risk 4/10 · Minor
- Hot days now (above 107°F)
- 7 days/yr
- Hot days in 30 yrs
- 17 days/yr
Wind risk 2/10 · Minimal
- Chance of severe wind over 30 yrs
- —
Air-quality risk 3/10 · Minor
- Unhealthy air days now
- 3 days/yr
- Unhealthy air days in 30 yrs
- 3 days/yr
Risk factors via First Street. Map © Google.
Why this score? — see what drove the C- grade
The composite is a weighted blend of 9 inputs, each scored 0–100. Each bar is that input's sub-score; the figure is the points it added to the 100-point composite (weight × sub-score).
- Cash flow +15.3/30.0
- ARV discount +14.4/15.0
- DSCR +4.7/10.0
- Livability +4.1/5.0
- 1% rule +3.9/10.0
- Rent growth +3.4/5.0
- Schools +2.7/10.0
- Condition / age +2.5/5.0
- Appreciation +0.0/10.0
$179,900
🖨 Deal sheet (PDF) 📄 Offer letter ✓ Due diligence
Listing remarks
This gorgeous 3 bedroom, 1 and 2 half baths home is ready for your final touches! Whether you're looking for an easy flip with instant equity, a great addition to your rental portfolio, or a home to make your own, this property offers endless potential. Located in a quiet Independence neighborhood, yet conveniently close to shops, restaurants, and major highways. Half Bath and Laundry in the partially finished basement.
Key facts
- Close to restaurants
- Half bath
- Close to shops
Tags
Property features AI
Finance
- Other: Property age: 51-75 years; Above-grade finished area recorded as 1,179 (per public records)
- HOA & community: No association fees
Exterior
- Parking: Attached garage; 1-car garage
- Utilities: Public water; Public sewer; Cable available; Fiber available; High-speed internet available
- Home design: Single-family residence; Ranch floor plan/model; One-story; Residential property
- Construction: Brick trim and vinyl siding; Composition roof
- Exterior features: Deck; Partial fencing; City lot within city limits; Level lot; Paved road with public maintenance
Interior
- Kitchen: Refrigerator; Electric range
- Bedrooms: 3 bedrooms
- Flooring: Wood flooring
- Bathrooms: 1 full bath; 2 half baths
- Heating & cooling: Natural gas heating; Cooling present
- Interior features: Living/dining combo; Refrigerator; Electric range
- Laundry & utility: Laundry in basement
Neighborhood map
What this means for you Summary
Snapshot
- This is a 3-bed/2.0-bath single-family listed at $180k.
Deal economics
- At list price, monthly cash flow is $65 ($776/yr) — positive.
- The deal already cash-flows at list — no discount required.
- To meet the 1% rule (rent ≥ 1% of price), the offer needs to be $159k (11.5% below list).
- Recommended offer: $159k (11.5% below list) — sets the bar for 1% rule.
- Cap rate 6.7% vs local median 5.0% in Independence — top-decile yield for the area; either an underpriced asset or a hidden risk that comps aren't pricing in. Stress-test before assuming the spread holds.
Location & tenants
- Location reads 82/100 on livability (#10 in MO, #1,296 nationally) — a professional / high-income tenant draw. Strengths: amenities A+, commute A+, cost of living A+; Watch: employment D+, crime F.
- Independence 30 (suburban): math 26% / reading 38% proficiency, ranked #252 of 324 in MO (top 78%) — families likely to look elsewhere, expect single-tenant / working-renter base with shorter leases.
- Zoned schools: Randall Elem. (math 22% / reading 27%, grade F, #879 of 1,115 statewide, top 81%, 260 students, 88% FRL); Pioneer Ridge Middle (math 25% / reading 42%, grade F, #260 of 391 statewide, top 67%, 806 students, 61% FRL); William Chrisman High (math 21% / reading 45%, grade F, #351 of 521 statewide, top 68%, 1,406 students, 66% FRL).
- Market conditions: Rents rising (+3.8%/yr); 106 active listings in the ZIP; 18 comparable units currently listed for rent nearby; rentals leasing fast (median 6d on market — plan ~1-2 weeks tenant-placement turnaround); 4,002 units permitted in Jackson County in 2024 (2,271 in 5+ unit buildings).
Forward outlook
- Local home prices are declining (-3.0%/yr); year-one equity from $1k of loan paydown is wiped out by about $5k of value loss. Plan a longer hold.
- Jackson County population projected at +4% by 2050 — modest demand growth; plan on rents tracking national, not racing it.
Negotiation context
- It's been on market 114 days — a 9% lower offer ($164k) is reasonable based on typical stale-listing flexibility.
- 2 sale attempts; this cycle's ask has dropped $10k (5%) from the opening price — seller is motivated, your offer sets the floor, not the list.
Questions for the listing agent
- It's been on market 114 days. Have you received any prior offers? Is the seller open to a 11% concession, seller financing, or rate buy-down credit?
- Built in 1962 — when were the roof, HVAC, electrical panel, plumbing, and water heater last replaced?
- Why hasn't it sold? Are there any deal-killer items the seller is aware of (foundation, flood, title, zoning, code violations)?
- Is there a deadline driving the sale (1031 exchange, divorce, estate, relocation)? That informs how much negotiation room exists.
- Crime grade is F in this area — have there been break-ins, vandalism, or insurance claims at this property in the last 3 years? What carrier currently insures it and at what premium?
- What's the average days-on-market for RENTAL listings here right now (not sales)? A rising rental-DOM trend means longer vacancies and softer asking-rent achievability than the comps imply.
- What's the recent tenant-quality profile in this submarket — average credit score on applications, eviction rate, late-payment / NSF rate, and stable-employment percentage? A property-management company in the area should have these aggregated.
- How much new for-sale + rental construction is in the pipeline within 1–3 miles? Heavy new supply typically softens prices + rents 12–24 months out; constrained supply supports both.
Investment metrics
- 1% rule
- 0.89% ✗
- Cap rate
- 6.72%
- Cash-on-cash
- 1.54%
- DSCR
- 1.07
- GRM
- 9.4
CMA / ARV
- ARV (on-the-fly)
- $212,220
- Comps found
- 12
Show comp detail 12 sales within ~0.75 mi
| Address | Dist | Beds/Ba | Sqft | Sold | Price | $/sf | Match |
|---|---|---|---|---|---|---|---|
| 801 N Redwood Dr | 0.00mi | 3/2.0 | 1,179 (0%) | 1mo | $179,900 | $153 | 99 |
| 710 N Arapaho St | 0.19mi | 3/2.0 | 1,292 (+10%) | 3mo | $290,000 | $224 | 73 |
| 1116 N Swope Dr | 0.43mi | 3/1.0 | 1,225 (+4%) | 1mo | $220,000 | $180 | 69 |
| 803 N Yuma Ave | 0.27mi | 3/2.5 | 1,297 (+10%) | 1mo | $225,000 | $173 | 68 |
| 1113 N Swope Dr | 0.41mi | 2/1.0 (-1) | 1,225 (+4%) | 1mo | $139,000 | $113 | 65 |
| 18609 E Bundschu Pl | 0.68mi | 3/2.0 | 1,202 (+2%) | 2mo | $270,000 | $225 | 63 |
| 834 N Ponca Dr | 0.64mi | 3/1.5 | 1,200 (+2%) | 3mo | $219,900 | $183 | 63 |
| 706 N Osage Trl | 0.45mi | 3/2.0 | 1,066 (-10%) | 1mo | $225,000 | $211 | 62 |
| 18508 E 8th St N | 0.58mi | 3/1.5 | 1,294 (+10%) | 1mo | $210,000 | $162 | 53 |
| 829 N Choctaw Ave | 0.40mi | 3/1.0 | 1,342 (+14%) | 2mo | $197,000 | $147 | 53 |
| 901 N Choctaw Ave | 0.40mi | 4/1.5 (+1) | 1,323 (+12%) | 3mo | $199,000 | $150 | 52 |
| 827 N Choctaw Ave | 0.40mi | 4/2.0 (+1) | 1,350 (+14%) | 2mo | $254,900 | $189 | 50 |
Match score weights: distance 35% · size 25% · config 20% · recency 20%. Top-matched comps best support the ARV.
Projected returns pro-forma
-3.0% appreciation · 3.76% rent growth · sell at horizon
- IRR
- -13.0%
- Equity multiple
- 0.53×
- Total profit
- $-23,812
- Equity at exit
- $26,824
- IRR
- -3.0%
- Equity multiple
- 0.79×
- Total profit
- $-10,345
- Equity at exit
- $15,554
Cash invested: $50,372 (down + closing). Projections, not guarantees.
Landlord ↔ Tenant lean methodology
- Overall (STATE)
- 81 Strongly Landlord-Friendly
- State Missouri
- 81 Strongly Landlord-Friendly · R+10
- County
- — inherits STATE
- City
- — inherits STATE
ZIP-level market 64056
- Rents YoY
- 3.8%
- Active inventory
- 106
- Price-to-rent
- 9.4×
Monthly cashflow live
- Estimated rent
- $1,593 high interval (Pro) →
- Mortgage (P&I)
- −$943
- Tax from tax record
- −$175 /mo · $2,102/yr
- Insurance
- −$75
- HOA
- −$0
- Vacancy / Maint / Mgmt
- −$334
- Net cashflow
- $65
Break-even live
Sensitivity live
| Price | -10% $167 | -5% $116 | +0% $65 | +5% $14 | +10% $-37 |
|---|---|---|---|---|---|
| Rent | -10% $-61 | -5% $2 | +0% $65 | +5% $128 | +10% $190 |
| Rate | -1.0pp $155 | -0.5pp $110 | base $65 | +0.5pp $18 | +1.0pp $-29 |
UW: 25.0% down · 7.5% · 30yr · 1.5% tax · 5.0% vac · 8.0% maint · 8.0% mgmt
Financing live
Cash to close
- Down payment
- $44,975
- Closing costs
- $5,397
- Reserves months
- —
- Total cash needed
- —
Loan-product check · same deal, 3 products live
Conventional
25% down · 7.5% · 30yr
- Down + closing
- —
- Monthly P&I
- —
- Monthly cashflow
- —
- DSCR
- —
- Eligible?
- —
Personal DTI + credit; lowest rate.
DSCR
20% down · 8.5% · 30yr
- Down + closing
- —
- Monthly P&I
- —
- Monthly cashflow
- —
- DSCR
- —
- Eligible?
- —
No personal income docs; deal must DSCR.
Hard money
10% down · 12.0% · 12mo
- Down + closing
- —
- Monthly P&I
- —
- Monthly cashflow
- —
- DSCR
- —
- Eligible?
- —
Short-term bridge; refi at stabilization.
Rent comps 18 comps
| Address | Beds | Baths | Sqft | Rent | $/sqft | DOM | Units | Dist |
|---|---|---|---|---|---|---|---|---|
| 17013 E US Highway 24 Apt 9 Independence, MO | 2.0 | 1.0 | 780 | $1,050 | $1.35 | 25d | 1 | 0.37mi |
| 17013 E US Highway 24 Independence, MO | 1.0–2.0 | 1.0 | 686 | $1,050 | $1.53 | 6d | 4 | 0.37mi |
| 17013 E US Highway 24 Independence, MO | 1.0–2.0 | 1.0 | 687 | $1,050 | $1.53 | 12d | 4 | 0.37mi |
| 18412 E Blackhawk Trl Independence, MO | 3.0 | 2.5 | 1500 | $2,125 | $1.42 | 0d | 1 | 0.62mi |
| 17004 E 3rd Ter N Independence, MO | 3.0 | 1.5 | 1486 | $1,495 | $1.01 | 0d | 1 | 0.63mi |
| 18508 E Blackhawk Trl Independence, MO | 3.0 | 2.5 | 1400 | $1,980 | $1.41 | 0d | 1 | 0.65mi |
| 18717 E Blackhawk Trl Independence, MO | 2.0 | 1.0 | 780 | $1,100 | $1.41 | 45d | 1 | 0.76mi |
| 111 N Gilbert St Independence, MO | 3.0 | 1.0 | 1328 | $1,511 | $1.14 | 0d | 1 | 0.82mi |
| 1043 Arrowhead Rdg Independence, MO | 2.0 | 1.0 | 800 | $1,095 | $1.37 | 0d | 1 | 0.84mi |
| 1406 N Ponca Dr Independence, MO | 4.0 | 1.0 | 1400 | $1,650 | $1.18 | 6d | 1 | 0.85mi |
| 19032 E Swope Trl Independence, MO | 2.0 | 1.0 | 780 | $950 | $1.22 | 0d | 1 | 0.94mi |
| 1103 N Aztec Ct Unit 1 Independence, MO | 2.0 | 1.0 | 800 | $950 | $1.19 | 45d | 1 | 0.98mi |
| 16005 E Cogan Ln Independence, MO | 4.0 | 2.0 | 1080 | $1,851 | $1.71 | 3d | 1 | 1.02mi |
| 19200 E Ponca Ter Independence, MO | 3.0 | 2.0 | 1195 | $1,973 | $1.65 | 45d | 1 | 1.03mi |
| 18410 E Shoshone Dr Independence, MO | 3.0 | 2.0 | 1426 | $1,450 | $1.02 | 45d | 1 | 1.04mi |
| 19246 E Ponca Dr Independence, MO | 3.0 | 1.5 | 1300 | $1,700 | $1.31 | 6d | 1 | 1.09mi |
| 19300 E Salisbury Rd Independence, MO | 3.0 | 1.0 | 1257 | $1,845 | $1.47 | 0d | 1 | 1.17mi |
| 18813 Lexington Rd Independence, MO | 2.0 | 1.5 | 1190 | $1,250 | $1.05 | 4d | 1 | 1.20mi |
Listing history 11 events
-
2026-04-30status Pending
-
2026-02-10price $179,900
-
2026-01-06$189,900 Active
-
2025-12-12soldstatus
-
2025-11-06status Pending
-
2025-11-04historical
-
2025-10-26price $178,000
-
2025-10-18$180,000 Active
-
2025-10-04historical
-
2024-12-31soldstatus
-
2024-11-22soldstatus
ⓘ Source: listings_history table (triggers on properties + properties_extension) + one-shot
backfill from property_details.listing_events for pre-trigger history.
Tax reassessment forecast MO · Resets to sale price
- Current annual tax
- $2,102 · $175/mo
- Projected year-2 tax
- $2,102 · $175/mo
- Expected delta
- $0/yr ($0/mo · 0.0%)
ⓘ Screening estimate from a state-policy table — verify with the county assessor before closing.
Climate risk First Street
- Flood 1/10 Low FEMA zone X (unshaded) · 0% chance over 30 yrs
- Wildfire 1/10 Low
- Heat 4/10 Moderate 7 d/yr ≥107°F today · 17 d/yr by 30 yrs out
- Wind 2/10 Low
- Air quality 3/10 Moderate 3 unhealthy d/yr today · 3 by 30 yrs out
Nearby sold comps map
Loading sold comps map…
Walkable amenities ~0.75 mi
Loading nearby amenities…
Taxation est. · year 1
- Rental income
- $19,113
- − Mortgage interest
- −$10,077
- − Property taxes
- −$2,102
- − Insurance
- −$900
- − Repairs & maintenance
- −$1,529
- − Management
- −$1,529
- − Depreciation
- −$5,233
- Taxable loss
- −$2,258
- Est. tax savings @ 24.0%
- +$542
- After-tax cash flow
- $1,318/yr
For passive investors: Depreciation is non-cash, so a rental often shows a tax loss while cash-flowing — sheltering income. Rental losses are passive: they offset passive income freely, and up to $25,000/yr can offset ordinary (W-2) income if you actively participate and your MAGI is under $100k (phasing out to $0 by $150k); unused losses carry forward. On sale, claimed depreciation is recaptured at up to 25%, and gains may owe capital-gains tax (a 1031 exchange can defer both). Figures are a year-1 estimate at your 24.0% rate — not tax advice; consult a CPA.
Schools (NCES district)
- District
- Independence 30
- NCES district ID
- 2915480
- Math proficiency
- 26% ▼ -8.00%
- Reading proficiency
- 38% ▼ -5.00%
- Median HH income
- $41,843
- Composite
- 27.04/100
- National rank
- #7054
- State rank
- #252 of 324 in MO
Livability — Independence
- Score
- 82/100
- State rank
- #10
- US rank
- #1296
Category grades
Schools grade is shown separately in the Schools card above.
Census & demographics
- Census place
- Independence, MO
- County
- Jackson County · 687,798 people
- City population
- 117,675
- Metro
- Kansas City, MO-KS
- Population (ZIP)
- 17,395
- Household income
- $67,685
- Rent vs Own
- Severe rent burden
- 747.0
Population outlook (Jackson County) Hauer SSP2
- Today (2025)
- 719,589 people
- By 2030
- 731,456 · +1.6%
- By 2040
- 746,689 · +3.8%
- By 2050
- 749,289 · +4.1%
- By 2075
- 736,227 · +2.3%
- By 2100
- 668,210 · -7.1%
Race, ethnicity, and origin ACS 2023
- Neighborhood character
- Predominantly White (69%)
- Race & ethnicity
- White 69% Black 14% Hispanic / Latino 8% Two or more races 7% Pacific Islander 1%
- Hispanic origin (detail)
- Mexican 6%
- Common ancestry
- Italian 9% Lithuanian 2% Slovak 2%
- Foreign-born
- 3% · Canada
- Languages at home
- 96% English-only · Spanish 4%
Political lean MEDSL · Jackson
- 2024 margin
- D (+19.3) · D 58.9% · R 39.5% · Other 1.6%
- 2008→2024 swing
- -6.1pp toward R · 2008: 25.4pp · 2024: 19.3pp
- All cycles
- 2024: D+19.3 2020: D+22.0 2016: D+16.6 2012: D+19.0 2008: D+25.4
Not yet ingested
- Civics
- —
Market trends
- HPI YoY
- ▼ -163.60%
- Current HPI
- 286.349
- Rent YoY
- ▲ 3.76%
- Metro
- Kansas City, MO-KS
- State GDP YoY
- ▲ 1.84%
- F500 in state
- 20
Industry mix (Fortune 500 HQ in MO)
| Industry | F500 HQs | Revenue |
|---|---|---|
| Healthcare | 1 | $163B |
|
||
| Insurance | 1 | $21B |
|
||
| Industrial Technology | 1 | $17B |
|
||
| Retail | 1 | $16B |
|
||
| Industrial Distribution | 1 | $10B |
|
||
| Utilities | 1 | $9B |
|
||
Price history
-0.1% since first listed11 events — show timeline
- 2026-04-30 Pending — Heartland MLS as Distributed by MLS Grid
- 2026-02-10 Price Changed $179,900 Heartland MLS as Distributed by MLS Grid
- 2026-01-06 Listed $189,900 Heartland MLS as Distributed by MLS Grid
- 2025-12-12 Sold (Public Records) — Public Records
- 2025-11-06 Pending — Heartland MLS as Distributed by MLS Grid
- 2025-11-04 Listing Removed — Heartland MLS as Distributed by MLS Grid
- 2025-10-26 Price Changed $178,000 Heartland MLS as Distributed by MLS Grid
- 2025-10-18 Listed $180,000 Heartland MLS as Distributed by MLS Grid
- 2025-10-04 Coming Soon — Heartland MLS as Distributed by MLS Grid
- 2024-12-31 Sold (Public Records) — Public Records
- 2024-11-22 Sold (Public Records) — Public Records
Property tax history
+3.3%/yrLatest (2025): $2,102 · +18.6% YoY. Source: county tax records.
Cash-flow waterfall
monthlySold comps — $/sqft
last 12 mo · ≤1 miLoading sold comps…