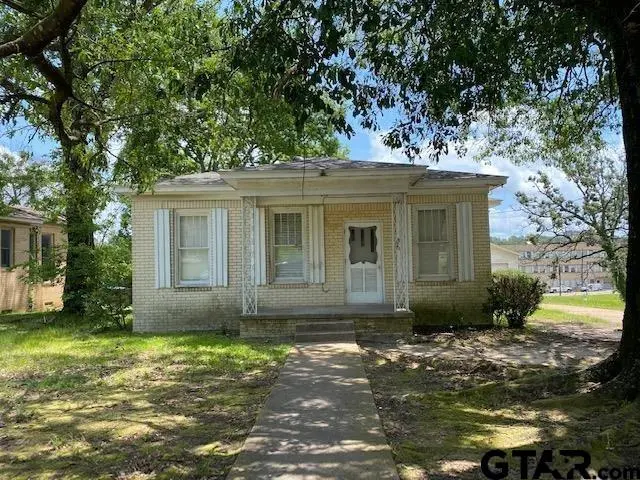
306 S Fenton Ave · Tyler, TX
Flood risk 1/10 · Minimal
- FEMA flood zone
- X (unshaded)
- Chance of flooding over 30 yrs
- 0.0%
- Est. flood insurance / yr
- $507 – $1,088
Fire risk 1/10 · Minimal
- Est. fire insurance / yr
- $1,222 – $2,270
Heat risk 7/10 · Major
- Hot days now (above 109°F)
- 7 days/yr
- Hot days in 30 yrs
- 26 days/yr
Wind risk 6/10 · Moderate
- Chance of severe wind over 30 yrs
- 59.0%
Air-quality risk 2/10 · Minimal
- Unhealthy air days now
- 0 days/yr
- Unhealthy air days in 30 yrs
- 1 days/yr
Risk factors via First Street. Map © Google.
Why this score? — see what drove the C- grade
The composite is a weighted blend of 9 inputs, each scored 0–100. Each bar is that input's sub-score; the figure is the points it added to the 100-point composite (weight × sub-score).
- Cash flow +20.3/30.0
- ARV discount +7.5/15.0
- DSCR +6.5/10.0
- 1% rule +5.8/10.0
- Livability +3.8/5.0
- Schools +3.3/10.0
- Rent growth +3.1/5.0
- Condition / age +2.5/5.0
- Appreciation +0.0/10.0
$160,000
🖨 Deal sheet 📄 Offer letter ✓ Due diligence
Listing remarks MLS
Looking to add to your investment portfolio or wanting to become a first time home owner? This maybe the property for you! Three large bedrooms with a possible fourth bedroom. High ceilings throughout the home. Close proximity to shops, convenience stores and restaurants! An aged home with possibilities! Take a look at this one! It just may surprise you!
Key facts
- 0.31 acre lot
- Garage
- Built 1954
Neighborhood map
What this means for you Summary
Snapshot
- This is a 3-bed/2.0-bath single-family listed at $160k.
Deal economics
- At list price, monthly cash flow is $206 ($2k/yr) — positive.
- The deal already cash-flows at list — no discount required.
- Meets the 1% rule at list price ($2k rent vs $160k).
- Recommended offer: $158k (1.5% below list) — sets the bar for market timing.
- Cap rate 7.8% vs local median 3.6% in Tyler — top-decile yield for the area; either an underpriced asset or a hidden risk that comps aren't pricing in. Stress-test before assuming the spread holds.
Location & tenants
- Location reads 75/100 on livability (#147 in TX, #4,181 nationally) — a middle-class / working-renter tenant base. Strengths: cost of living A+, housing A+, health & safety A+; Watch: employment C-, schools D+, crime D+.
- Tyler ISD (urban): math 39% / reading 38% proficiency, ranked #449 of 826 in TX (top 54%) — families likely to look elsewhere, expect single-tenant / working-renter base with shorter leases; 66% free/reduced lunch — lower-income household profile, screen leases tightly.
- Market conditions: Rents rising (+2.3%/yr); 155 active listings in the ZIP; 29 comparable units currently listed for rent nearby; rentals at typical pace (median 21d on market — plan ~3-4 weeks tenant-placement turnaround); 595 units permitted in Smith County in 2024 (45 in 5+ unit buildings).
- This rent runs 40% of the median local income ($52k/yr) — at the standard rent-burdened threshold; future hikes will face affordability resistance.
Forward outlook
- Local home prices are declining (-3.0%/yr); year-one equity from $1k of loan paydown is wiped out by about $5k of value loss. Plan a longer hold.
- Smith County population projected at +24% by 2050 — long-run rental-demand tailwind backs the buy-and-hold thesis.
Negotiation context
- It's been on market 21 days — a 2% lower offer ($158k) is reasonable based on typical stale-listing flexibility.
- 2 sale attempts since 5y ago; this cycle's ask has dropped $40k (20%) from the opening price — seller is motivated, your offer sets the floor, not the list.
Risks & watch-outs
- Watch-outs: built in 1954 — expect roof / HVAC / electrical / plumbing capex.
- Climate carrying-cost: major wind risk, 59% chance of damaging wind over 30y; extreme-heat days projected 7→26/yr by 2055 (HVAC capex compounding) — expect insurance premiums to compound above CPI over the hold.
Questions for the listing agent
- Built in 1954 — when were the roof, HVAC, electrical panel, plumbing, and water heater last replaced?
- Is there a deadline driving the sale (1031 exchange, divorce, estate, relocation)? That informs how much negotiation room exists.
- Schools are D-rated, which usually means shorter tenancies and higher turnover. Who's the typical renter profile here, and what's been the actual vacancy rate?
- Crime grade is D in this area — have there been break-ins, vandalism, or insurance claims at this property in the last 3 years? What carrier currently insures it and at what premium?
- What's the average days-on-market for RENTAL listings here right now (not sales)? A rising rental-DOM trend means longer vacancies and softer asking-rent achievability than the comps imply.
- What's the recent tenant-quality profile in this submarket — average credit score on applications, eviction rate, late-payment / NSF rate, and stable-employment percentage? A property-management company in the area should have these aggregated.
- How much new for-sale + rental construction is in the pipeline within 1–3 miles? Heavy new supply typically softens prices + rents 12–24 months out; constrained supply supports both.
Investment metrics
- 1% rule
- 1.08% ✓
- Cap rate
- 7.84%
- Cash-on-cash
- 5.51%
- DSCR
- 1.25
- GRM
- 7.7
CMA / ARV
No comps found within radius.
Projected returns pro-forma
-3.0% appreciation · 2.27% rent growth · sell at horizon
- IRR
- -8.6%
- Equity multiple
- 0.69×
- Total profit
- $-14,018
- Equity at exit
- $23,857
- IRR
- -0.1%
- Equity multiple
- 1.00×
- Total profit
- $-177
- Equity at exit
- $13,834
Cash invested: $44,800 (down + closing). Projections, not guarantees.
Landlord ↔ Tenant lean methodology
- Overall (STATE)
- 87 Strongly Landlord-Friendly
- State Texas
- 87 Strongly Landlord-Friendly · R+5
- County
- — inherits STATE
- City
- — inherits STATE
ZIP-level market 75702
- Home prices YoY
- -5.8%
- Rents YoY
- 2.3%
- Active inventory
- 155
- Price-to-rent
- 7.7×
Monthly cashflow live
- Estimated rent
- $1,721 high interval (Pro) →
- Mortgage (P&I)
- −$839
- Tax from tax record
- −$248 /mo · $2,980/yr
- Insurance
- −$67
- HOA
- −$0
- Vacancy / Maint / Mgmt
- −$361
- Net cashflow
- $206
Break-even live
UW: 25.0% down · 7.5% · 30yr · 1.5% tax · 5.0% vac · 8.0% maint · 8.0% mgmt
Financing live
Cash to close
- Down payment
- $40,000
- Closing costs
- $4,800
- Reserves months
- —
- Total cash needed
- —
Loan-product check · same deal, 3 products live
Conventional
25% down · 7.5% · 30yr
- Down + closing
- —
- Monthly P&I
- —
- Monthly cashflow
- —
- DSCR
- —
- Eligible?
- —
Personal DTI + credit; lowest rate.
DSCR
20% down · 8.5% · 30yr
- Down + closing
- —
- Monthly P&I
- —
- Monthly cashflow
- —
- DSCR
- —
- Eligible?
- —
No personal income docs; deal must DSCR.
Hard money
10% down · 12.0% · 12mo
- Down + closing
- —
- Monthly P&I
- —
- Monthly cashflow
- —
- DSCR
- —
- Eligible?
- —
Short-term bridge; refi at stabilization.
Rent comps 29 comps
| Address | Beds | Baths | Sqft | Rent | $/sqft | DOM | Units | Dist |
|---|---|---|---|---|---|---|---|---|
| 1104 W Park St Tyler, TX | 3.0 | 2.0 | 1440 | $1,650 | $1.15 | 20d | 1 | 0.38mi |
| 2006 W Oakwood St Tyler, TX | 3.0 | 2.0 | 1344 | $1,895 | $1.41 | 13d | 1 | 0.53mi |
| 539 Williams Ct Tyler, TX | 2.0 | 1.0 | 1352 | $1,415 | $1.05 | 20d | 1 | 0.62mi |
| 720 N Englewood Ave Tyler, TX | 3.0 | 1.0 | 1856 | $1,650 | $0.89 | 43d | 1 | 0.71mi |
| 556 W Erwin St Tyler, TX | 3.0 | 3.5 | 1956 | $2,550 | $1.30 | 20d | 1 | 0.73mi |
| 548 W Erwin St Tyler, TX | 3.0 | 3.5 | 1956 | $2,495 | $1.28 | 43d | 1 | 0.75mi |
| 548 W Erwin St Tyler, TX | 3.0 | 3.5 | 1956 | $2,295 | $1.17 | 20d | 1 | 0.75mi |
| 540 W Erwin St Tyler, TX | 3.0 | 3.5 | 1956 | $4,000 | $2.04 | 43d | 1 | 0.76mi |
| 526 S Bonner Ave Apt 4 Tyler, TX | 2.0 | 1.0 | 1120 | $1,175 | $1.05 | 20d | 1 | 0.82mi |
| 1500 Mockingbird Ln Tyler, TX | 3.0 | 2.0 | 1090 | $1,230 | $1.13 | 43d | 1 | 0.87mi |
| 1215 S Lenox St Tyler, TX | 3.0 | 2.0 | 1090 | $1,264 | $1.16 | 43d | 1 | 0.90mi |
| 522 W Dobbs St Tyler, TX | 3.0 | 1.0 | 1127 | $1,395 | $1.24 | 13d | 1 | 0.97mi |
| 431 S College Ave Tyler, TX | 2.0 | 1.0 | 1380 | $1,750 | $1.27 | 43d | 1 | 0.99mi |
| 431 S College Ave Tyler, TX | 2.0 | 1.0 | 1380 | $1,650 | $1.20 | 20d | 1 | 0.99mi |
| 1115 S Robertson Ave Tyler, TX | 2.0 | 1.0 | 1366 | $1,550 | $1.13 | 13d | 1 | 1.09mi |
| 328 Mockingbird Ln Tyler, TX | 2.0 | 1.0 | 1200 | $950 | $0.79 | 13d | 1 | 1.22mi |
| 1523 N Englewood Ave Tyler, TX | 3.0 | 2.0 | 1542 | $1,650 | $1.07 | 43d | 1 | 1.24mi |
| 1538 N Hill Ave Tyler, TX | 3.0 | 2.0 | 1813 | $1,650 | $0.91 | 20d | 1 | 1.26mi |
| 1655 S Kennedy Ave Unit 203 Tyler, TX | 2.0 | 2.5 | 1174 | $1,650 | $1.41 | 43d | 1 | 1.28mi |
| 1655 S Kennedy Ave Tyler, TX | 2.0 | 2.5 | 1174 | $1,595 | $1.36 | 43d | 1 | 1.28mi |
| 132 Rowland Pl Unit b Tyler, TX | 2.0 | 1.0 | 1170 | $1,295 | $1.11 | 20d | 1 | 1.28mi |
| 902 W 5th St Tyler, TX | 2.0 | 1.0 | 1369 | $1,200 | $0.88 | 13d | 1 | 1.31mi |
| 908 W 6th St Tyler, TX | 2.0 | 1.0 | 1112 | $1,300 | $1.17 | 13d | 1 | 1.36mi |
| 809 W Harmony St Tyler, TX | 3.0 | 2.0 | 1309 | $1,500 | $1.15 | 43d | 1 | 1.36mi |
| 826 W Franklin St Tyler, TX | 3.0 | 2.0 | 1273 | $1,550 | $1.22 | 13d | 1 | 1.36mi |
| 711 W 6th St Tyler, TX | 3.0 | 2.0 | 1854 | $1,850 | $1.00 | 13d | 1 | 1.38mi |
| 425 E Oakwood St Tyler, TX | 3.0 | 2.0 | 1298 | $1,540 | $1.19 | 43d | 1 | 1.40mi |
| 1618 N Tenneha Ave Tyler, TX | 3.0 | 1.0 | 1587 | $1,400 | $0.88 | 13d | 1 | 1.44mi |
| 305 E Lake St Tyler, TX | 2.0 | 1.5 | 1287 | $1,695 | $1.32 | 13d | 1 | 1.46mi |
Listing history 23 events
-
2026-06-19days on market $160,000 Active 21 DOM
-
2026-06-18days on market $160,000 Active 20 DOM
-
2026-06-17days on market $160,000 Active 19 DOM
-
2026-06-16days on market $160,000 Active 18 DOM
-
2026-06-15days on market $160,000 Active 17 DOM
-
2026-06-14days on market $160,000 Active 15 DOM
-
2026-06-13days on market $160,000 Active 14 DOM
-
2026-06-10days on market $160,000 Active 12 DOM
-
2026-06-09days on market $160,000 Active 11 DOM
-
2026-06-08days on market $160,000 Active 10 DOM
-
2026-06-07days on market $160,000 Active 9 DOM
-
2026-06-05days on market $160,000 Active 6 DOM
-
2026-06-02days on market $160,000 Active 4 DOM
-
2026-06-01days on market $160,000 Active 3 DOM
-
2026-05-31days on market $160,000 Active 2 DOM
-
2026-05-30remarks 528-char remark
-
2026-05-30pricedays on market $160,000 Active 1 DOM
-
2026-04-30price $189,500 356-char remark
Show marketing remark (356 chars)
Looking to add to your investment portfolio or wanting to become a first time home owner? This maybe the property for you! Three large bedrooms with a possible fourth bedroom. High ceilings throughout the home. Close proximity to shops, convenience stores and restaurants! An aged home with possibilities! Take a look at this one! It just may surprise you!
-
2026-03-30$199,900 Active 356-char remark
Show marketing remark (356 chars)
Looking to add to your investment portfolio or wanting to become a first time home owner? This maybe the property for you! Three large bedrooms with a possible fourth bedroom. High ceilings throughout the home. Close proximity to shops, convenience stores and restaurants! An aged home with possibilities! Take a look at this one! It just may surprise you!
-
2021-08-27soldstatus 218-char remark
Show marketing remark (218 chars)
Looking for an investment property?! Or if you are a first time home buyer, this one is for you! New roof, new paint, and a new stove. Utility room, open patio, big driveway and a detached garage. Don't wait come look!
-
2021-08-27soldstatus
Show marketing remark (218 chars)
Looking for an investment property?! Or if you are a first time home buyer, this one is for you! New roof, new paint, and a new stove. Utility room, open patio, big driveway and a detached garage. Don't wait come look!
-
2021-07-26$109,000 218-char remark
Show marketing remark (218 chars)
Looking for an investment property?! Or if you are a first time home buyer, this one is for you! New roof, new paint, and a new stove. Utility room, open patio, big driveway and a detached garage. Don't wait come look!
-
2012-10-23soldstatus
ⓘ Source: listings_history table (triggers on properties + properties_extension) + one-shot
backfill from property_details.listing_events for pre-trigger history.
Tax reassessment forecast TX · Resets to sale price
- Current annual tax
- $2,980 · $248/mo
- Projected year-2 tax
- $2,980 · $248/mo
- Expected delta
- $0/yr ($0/mo · 0.0%)
ⓘ Screening estimate from a state-policy table — verify with the county assessor before closing.
Climate risk First Street
- Flood 1/10 Low FEMA zone X (unshaded) · 0% chance over 30 yrs
- Wildfire 1/10 Low
- Heat 7/10 Severe 7 d/yr ≥109°F today · 26 d/yr by 30 yrs out
- Wind 6/10 Major 59% chance of damaging wind over 30 yrs
- Air quality 2/10 Low 0 unhealthy d/yr today · 1 by 30 yrs out
Nearby sold comps map
Loading sold comps map…
Walkable amenities ~0.75 mi
Loading nearby amenities…
Taxation est. · year 1
- Rental income
- $20,657
- − Mortgage interest
- −$8,962
- − Property taxes
- −$2,980
- − Insurance
- −$800
- − Repairs & maintenance
- −$1,653
- − Management
- −$1,653
- − Depreciation
- −$4,655
- Taxable loss
- −$46
- Est. tax savings @ 24.0%
- +$11
- After-tax cash flow
- $2,481/yr
For passive investors: Depreciation is non-cash, so a rental often shows a tax loss while cash-flowing — sheltering income. Rental losses are passive: they offset passive income freely, and up to $25,000/yr can offset ordinary (W-2) income if you actively participate and your MAGI is under $100k (phasing out to $0 by $150k); unused losses carry forward. On sale, claimed depreciation is recaptured at up to 25%, and gains may owe capital-gains tax (a 1031 exchange can defer both). Figures are a year-1 estimate at your 24.0% rate — not tax advice; consult a CPA.
Schools (NCES district)
- District
- Tyler ISD
- NCES district ID
- 4843470
- Math proficiency
- 39% ▼ -4.00%
- Reading proficiency
- 38% ▼ -1.00%
- Median HH income
- $44,090
- Composite
- 32.69/100
- National rank
- #5650
- State rank
- #449 of 826 in TX
Livability — Tyler
- Score
- 75/100
- State rank
- #147
- US rank
- #4181
Category grades
Schools grade is shown separately in the Schools card above.
Census & demographics
- Census place
- Tyler, TX
- County
- Smith County · 180,570 people
- City population
- 127,842
- Metro
- Tyler, TX
- Population (ZIP)
- 27,927
- Household income
- $51,564
- Rent vs Own
- Severe rent burden
- 803.0
Population outlook (Smith County) Hauer SSP2
- Today (2025)
- 248,890 people
- By 2030
- 261,665 · +5.1%
- By 2040
- 286,114 · +15.0%
- By 2050
- 308,006 · +23.8%
- By 2075
- 354,171 · +42.3%
- By 2100
- 372,828 · +49.8%
Race, ethnicity, and origin ACS 2023
- Neighborhood character
- Diverse neighborhood (Simpson 0.61)
- Race & ethnicity
- Hispanic / Latino 49% Black 37% White 12% Two or more races 11% Native American 1%
- Hispanic origin (detail)
- Mexican 47%
- Common ancestry
- Lithuanian 1%
- Foreign-born
- 20% · Canada
- Languages at home
- 56% English-only · Spanish 44%
Political lean MEDSL · Smith
- 2024 margin
- Solid R (+45.1) · D 27.0% · R 72.1%
- 2008→2024 swing
- -5.6pp toward R · 2008: -39.5pp · 2024: -45.1pp
- All cycles
- 2024: R+45.1 2020: R+39.4 2016: R+43.9 2012: R+46.9 2008: R+39.5
Not yet ingested
- Civics
- —
Market trends
- HPI YoY
- ▼ -12.63%
- Current HPI
- 207.1573
- Rent YoY
- ▲ 2.27%
- Metro
- Tyler, TX
- State GDP YoY
- ▲ 3.95%
- F500 in state
- 110
Industry mix (Fortune 500 HQ in TX)
| Industry | F500 HQs | Revenue |
|---|---|---|
| Energy | 16 | $1,198B |
|
||
| Technology | 5 | $198B |
|
||
| Engineering / Construction | 4 | $72B |
|
||
| Energy Services | 3 | $60B |
|
||
| Utilities | 3 | $41B |
|
||
| Healthcare | 2 | $330B |
|
||
Price history
+73.9% since first listed6 events — show timeline
- 2026-04-30 Price Changed $189,500 GTAR
- 2026-03-30 Listed $199,900 GTAR
- 2021-08-27 Sold (Public Records) — Public Records
- 2021-08-27 Sold (MLS) — GTAR
- 2021-07-26 Listed $109,000 GTAR
- 2012-10-23 Sold (Public Records) — Public Records
Property tax history
+11.9%/yrLatest (2024): $2,980 · +17.1% YoY. Source: county tax records.
Cash-flow waterfall
monthlySold comps — $/sqft
last 12 mo · ≤1 miLoading sold comps…