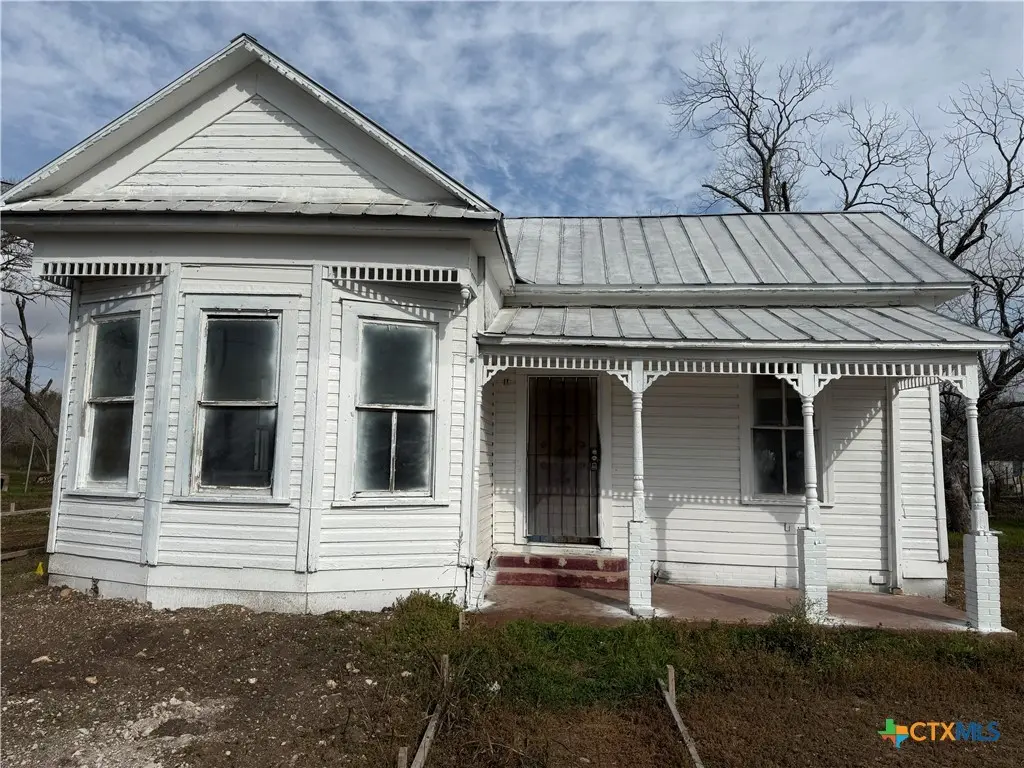
316 W Seideman St · Seguin, TX
Flood risk 1/10 · Minimal
- FEMA flood zone
- X (unshaded)
- Chance of flooding over 30 yrs
- 0.0%
- Est. flood insurance / yr
- $507 – $1,088
Fire risk 2/10 · Minimal
- Est. fire insurance / yr
- $1,222 – $2,270
Heat risk 8/10 · Major
- Hot days now (above 108°F)
- 7 days/yr
- Hot days in 30 yrs
- 22 days/yr
Wind risk 8/10 · Major
- Chance of severe wind over 30 yrs
- 80.0%
Air-quality risk 1/10 · Minimal
- Unhealthy air days now
- 0 days/yr
- Unhealthy air days in 30 yrs
- 0 days/yr
Risk factors via First Street. Map © Google.
Why this score? — see what drove the B- grade
The composite is a weighted blend of 9 inputs, each scored 0–100. Each bar is that input's sub-score; the figure is the points it added to the 100-point composite (weight × sub-score).
- Cash flow +25.2/30.0
- ARV discount +15.0/15.0
- DSCR +8.2/10.0
- 1% rule +6.5/10.0
- Livability +3.3/5.0
- Rent growth +3.0/5.0
- Condition / age +2.5/5.0
- Schools +2.4/10.0
- Appreciation +0.0/10.0
$129,900
🖨 Deal sheet 📄 Offer letter ✓ Due diligence
Listing remarks MLS
316 Seideman is a residential property located in Seguin, Texas, offering a convenient in-town location with access to downtown amenities, local schools, and major roadways. The property is being sold as-is and has been demoed, requiring a full renovation, presenting an opportunity for buyers looking to rebuild and add value in an established in-town location. Appliances, including a refrigerator, stove, and microwave, will convey with the sale. An HVAC system is present at the property. Utilities have previously been connected. The home offers flexibility for renovation or customization based on buyer plans and due diligence. Seller is open to a straightforward transaction. Buyers are encouraged to conduct their own inspections prior to submitting an offer.
Key facts
- In-town location
- Major roadways
- Full renovation
Tags
Neighborhood map
What this means for you Summary
Snapshot
- This is a 3-bed/1.0-bath single-family listed at $130k.
Deal economics
- At list price, monthly cash flow is $289 ($3k/yr) — positive.
- The deal already cash-flows at list — no discount required.
- Meets the 1% rule at list price ($1k rent vs $130k).
- Recommended offer: $114k (12.0% below list) — sets the bar for market timing.
- Cap rate 9.0% vs local median 3.7% in Seguin — top-decile yield for the area; either an underpriced asset or a hidden risk that comps aren't pricing in. Stress-test before assuming the spread holds.
Location & tenants
- Location reads 66/100 on livability (#592 in TX) — a middle-class / working-renter tenant base. Strengths: cost of living A+, housing A+; Watch: employment D, schools F, amenities F.
- Seguin ISD (town): math 26% / reading 30% proficiency, ranked #663 of 826 in TX (top 80%) — low school quality limits family demand, transient renter base, plan for 1-2y turnover; 63% free/reduced lunch — lower-income household profile, screen leases tightly.
- Market conditions: Rents rising (+2.0%/yr); 1342 active listings in the ZIP; 40 comparable units currently listed for rent nearby; rentals at typical pace (median 19d on market — plan ~3-4 weeks tenant-placement turnaround); 2,064 units permitted in Guadalupe County in 2024 (133 in 5+ unit buildings).
Forward outlook
- Local home prices are declining (-3.0%/yr); year-one equity from $898 of loan paydown is wiped out by about $4k of value loss. Plan a longer hold.
- Guadalupe County population projected at +61% by 2050 — long-run rental-demand tailwind backs the buy-and-hold thesis.
Negotiation context
- It's been on market 147 days — a 12% lower offer ($114k) is reasonable based on typical stale-listing flexibility.
- 4 sale attempts with the ask held roughly flat each time — persistent listings suggest the price (not the market) is what's stuck; bring a comps-based counter.
Risks & watch-outs
- Climate carrying-cost: severe wind risk, 80% chance of damaging wind over 30y; extreme-heat days projected 7→22/yr by 2055 (HVAC capex compounding) — expect insurance premiums to compound above CPI over the hold.
Questions for the listing agent
- It's been on market 147 days. Have you received any prior offers? Is the seller open to a 12% concession, seller financing, or rate buy-down credit?
- Why hasn't it sold? Are there any deal-killer items the seller is aware of (foundation, flood, title, zoning, code violations)?
- Is there a deadline driving the sale (1031 exchange, divorce, estate, relocation)? That informs how much negotiation room exists.
- Schools are F-rated, which usually means shorter tenancies and higher turnover. Who's the typical renter profile here, and what's been the actual vacancy rate?
- What's the average days-on-market for RENTAL listings here right now (not sales)? A rising rental-DOM trend means longer vacancies and softer asking-rent achievability than the comps imply.
- What's the recent tenant-quality profile in this submarket — average credit score on applications, eviction rate, late-payment / NSF rate, and stable-employment percentage? A property-management company in the area should have these aggregated.
- How much new for-sale + rental construction is in the pipeline within 1–3 miles? Heavy new supply typically softens prices + rents 12–24 months out; constrained supply supports both.
Investment metrics
- 1% rule
- 1.15% ✓
- Cap rate
- 8.96%
- Cash-on-cash
- 9.53%
- DSCR
- 1.42
- GRM
- 7.2
CMA / ARV
- ARV (median comp)
- $196,498
- List price
- $129,900
- Delta
- -33.89%
- Verdict
- UNDERPRICED
- Comps
- 20 within 1.0 mi
Show comp detail 12 sales within ~0.75 mi
| Address | Dist | Beds/Ba | Sqft | Sold | Price | $/sf | Match |
|---|---|---|---|---|---|---|---|
| 608 San Antonio | 0.58mi | 3/1.0 | 1,116 (0%) | 4mo | $159,500 | $143 | 70 |
| 2311 N Camp Ave | 0.54mi | 3/1.5 | 1,100 (-1%) | 4mo | $189,000 | $172 | 67 |
| 402 Michna | 0.48mi | 3/1.0 | 1,080 (-3%) | 6mo | $110,000 | $102 | 67 |
| 530 E Weinert St | 0.60mi | 3/2.0 | 1,123 (+1%) | 5mo | $205,000 | $183 | 63 |
| 127 Roosevelt Dr | 0.43mi | 3/2.0 | 1,024 (-8%) | 1mo | $234,000 | $229 | 61 |
| 232 Pine | 0.39mi | 2/1.0 (-1) | 1,176 (+5%) | 12mo | $125,000 | $106 | 58 |
| 1416 Sixth St | 0.43mi | 3/2.0 | 1,189 (+6%) | 12mo | $229,500 | $193 | 54 |
| 512 E Weinert St | 0.58mi | 2/1.0 (-1) | 1,058 (-5%) | 7mo | $225,000 | $213 | 54 |
| 705 4th St | 0.52mi | 2/1.0 (-1) | 1,196 (+7%) | 13mo | $92,000 | $77 | 48 |
| 725 E Pine St | 0.69mi | 2/1.0 (-1) | 1,020 (-9%) | 2mo | $169,000 | $166 | 47 |
| 411 Bismark | 0.67mi | 3/2.0 | 1,228 (+10%) | 6mo | $160,000 | $130 | 43 |
| 710 E New Braunfels St | 0.63mi | 3/2.0 | 1,200 (+8%) | 14mo | $198,700 | $166 | 42 |
Match score weights: distance 35% · size 25% · config 20% · recency 20%. Top-matched comps best support the ARV.
Projected returns pro-forma
-3.0% appreciation · 2.04% rent growth · sell at horizon
- IRR
- -3.0%
- Equity multiple
- 0.89×
- Total profit
- $-4,055
- Equity at exit
- $19,369
- IRR
- 5.6%
- Equity multiple
- 1.40×
- Total profit
- $14,488
- Equity at exit
- $11,231
Cash invested: $36,372 (down + closing). Projections, not guarantees.
Landlord ↔ Tenant lean methodology
- Overall (STATE)
- 87 Strongly Landlord-Friendly
- State Texas
- 87 Strongly Landlord-Friendly · R+5
- County
- — inherits STATE
- City
- — inherits STATE
ZIP-level market 78155
- Rents YoY
- 2.0%
- Active inventory
- 1342
- Price-to-rent
- 7.2×
Monthly cashflow live
- Estimated rent
- $1,495 high interval (Pro) →
- Mortgage (P&I)
- −$681
- Tax from tax record
- −$157 /mo · $1,884/yr
- Insurance
- −$54
- HOA
- −$0
- Vacancy / Maint / Mgmt
- −$314
- Net cashflow
- $289
Break-even live
UW: 25.0% down · 7.5% · 30yr · 1.5% tax · 5.0% vac · 8.0% maint · 8.0% mgmt
Financing live
Cash to close
- Down payment
- $32,475
- Closing costs
- $3,897
- Reserves months
- —
- Total cash needed
- —
Loan-product check · same deal, 3 products live
Conventional
25% down · 7.5% · 30yr
- Down + closing
- —
- Monthly P&I
- —
- Monthly cashflow
- —
- DSCR
- —
- Eligible?
- —
Personal DTI + credit; lowest rate.
DSCR
20% down · 8.5% · 30yr
- Down + closing
- —
- Monthly P&I
- —
- Monthly cashflow
- —
- DSCR
- —
- Eligible?
- —
No personal income docs; deal must DSCR.
Hard money
10% down · 12.0% · 12mo
- Down + closing
- —
- Monthly P&I
- —
- Monthly cashflow
- —
- DSCR
- —
- Eligible?
- —
Short-term bridge; refi at stabilization.
Rent comps 40 comps
| Address | Beds | Baths | Sqft | Rent | $/sqft | DOM | Units | Dist |
|---|---|---|---|---|---|---|---|---|
| 1701 N Guadalupe St Seguin, TX | 3.0 | 2.0 | 1028 | $1,464 | $1.42 | 4d | 1 | 0.18mi |
| 1601 Hays St Seguin, TX | 3.0 | 2.0 | 1090 | $1,275 | $1.17 | 4d | 1 | 0.28mi |
| 223 W Baxter St Seguin, TX | 3.0 | 2.0 | 1298 | $1,664 | $1.28 | 1d | 1 | 0.29mi |
| 201 E Kingsbury St Seguin, TX | 2.0 | 1.0 | 856 | $1,095 | $1.28 | 14d | 1 | 0.39mi |
| 201 E Kingsbury St Seguin, TX | 2.0 | 1.0 | 856 | $1,095 | $1.28 | 23d | 1 | 0.39mi |
| 527 Elley St Seguin, TX | 3.0 | 3.0 | 1090 | $1,325 | $1.22 | 23d | 1 | 0.46mi |
| 508 Pitts St Seguin, TX | 3.0 | 1.0 | 973 | $1,275 | $1.31 | 12d | 1 | 0.52mi |
| 526 E Baxter St Seguin, TX | 3.0 | 2.0 | 1255 | $1,350 | $1.08 | 23d | 1 | 0.57mi |
| 324 Mar Hill St Seguin, TX | 3.0 | 2.5 | 1236 | $1,395 | $1.13 | 16d | 1 | 0.63mi |
| 917 8th St Seguin, TX | 3.0 | 2.0 | 1298 | $1,375 | $1.06 | 4d | 1 | 0.71mi |
| 809 Leissner St Seguin, TX | 2.0 | 1.0 | 1020 | $1,175 | $1.15 | 23d | 1 | 0.72mi |
| 1331 Hidalgo St Seguin, TX | 3.0 | 2.0 | 1298 | $1,364 | $1.05 | 21d | 1 | 0.72mi |
| 906 San Antonio Ave Seguin, TX | 2.0 | 1.0 | 1020 | $1,100 | $1.08 | 43d | 1 | 0.76mi |
| 607 E Martindale St Unit B Seguin, TX | 3.0 | 2.0 | 1020 | $1,500 | $1.47 | 17d | 1 | 0.77mi |
| 2551 N Guadalupe St Unit 1308 Seguin, TX | 4.0 | 2.0 | 1263 | $1,449 | $1.15 | 43d | 1 | 0.78mi |
| 2551 N Guadalupe St Seguin, TX | 1.0–4.0 | 1.0–2.0 | 955 | $1,278 | $1.34 | 19d | 5 | 0.78mi |
| 2551 N Guadalupe St Unit 4106 Seguin, TX | 3.0 | 2.0 | 1084 | $1,300 | $1.20 | 43d | 1 | 0.78mi |
| 2551 N Guadalupe St Unit 3108 Seguin, TX | 4.0 | 2.0 | 1263 | $1,449 | $1.15 | 23d | 1 | 0.78mi |
| 2551 N Guadalupe St Unit 2111 Seguin, TX | 2.0 | 2.0 | 847 | $1,125 | $1.33 | 43d | 1 | 0.78mi |
| 726 E Humphreys St Seguin, TX | 3.0 | 2.0 | 1248 | $1,500 | $1.20 | 23d | 1 | 0.86mi |
| 404 W Walnut St Seguin, TX | 2.0 | 1.0 | 996 | $1,550 | $1.56 | 43d | 1 | 0.95mi |
| 968 E Cedar St Unit 1 Seguin, TX | 2.0 | 1.0 | 856 | $995 | $1.16 | 43d | 1 | 0.99mi |
| 1102 Renee Way Seguin, TX | 3.0 | 2.0 | 1372 | $1,395 | $1.02 | 12d | 1 | 1.09mi |
| 1107 Renee Way Seguin, TX | 3.0 | 2.0 | 1372 | $1,445 | $1.05 | 19d | 1 | 1.10mi |
| 1107 Renee Way Seguin, TX | 3.0 | 2.0 | 1372 | $1,395 | $1.02 | 2d | 1 | 1.10mi |
| 1112 Renee Way Seguin, TX | 3.0 | 2.0 | 1372 | $1,494 | $1.09 | 12d | 1 | 1.12mi |
| 1114 Renee Way Seguin, TX | 3.0 | 2.0 | 1372 | $1,449 | $1.06 | 43d | 1 | 1.12mi |
| 1119 Burek Cross Seguin, TX | 3.0 | 2.0 | 1372 | $1,395 | $1.02 | 4d | 1 | 1.13mi |
| 1116 Renee Way Seguin, TX | 3.0 | 2.0 | 1372 | $1,395 | $1.02 | 4d | 1 | 1.13mi |
| 1128 Stanley Way Seguin, TX | 3.0 | 2.0 | 1372 | $1,600 | $1.17 | 43d | 1 | 1.15mi |
| 1128 Renee Way Seguin, TX | 3.0 | 2.0 | 1372 | $1,395 | $1.02 | 4d | 1 | 1.17mi |
| 1131 Renee Way Seguin, TX | 3.0 | 2.0 | 1372 | $1,450 | $1.06 | 43d | 1 | 1.17mi |
| 1143 Stanley Way Seguin, TX | 3.0 | 2.0 | 1372 | $1,450 | $1.06 | 14d | 1 | 1.19mi |
| 1152 Stanley Way Seguin, TX | 3.0 | 2.5 | 1372 | $1,395 | $1.02 | 4d | 1 | 1.22mi |
| 1516 Lucille St Seguin, TX | 3.0 | 2.5 | 1372 | $1,445 | $1.05 | 14d | 1 | 1.22mi |
| 1155 Stanley Way Seguin, TX | 3.0 | 2.0 | 1372 | $1,450 | $1.06 | 23d | 1 | 1.23mi |
| 1168 Sycamore St Seguin, TX | 3.0 | 2.0 | 1017 | $1,500 | $1.47 | 1d | 1 | 1.29mi |
| 1302 Canary Ln Seguin, TX | 3.0 | 2.0 | 1300 | $1,850 | $1.42 | 1d | 1 | 1.33mi |
| 772 Mitchell Ave Seguin, TX | 3.0 | 2.0 | 1298 | $1,560 | $1.20 | 4d | 1 | 1.39mi |
| 1339 Mockingbird Ln Seguin, TX | 3.0 | 2.0 | 1452 | $1,975 | $1.36 | 43d | 1 | 1.49mi |
Listing history 28 events
-
2026-06-18days on market $129,900 Active 147 DOM
-
2026-06-17days on market $129,900 Active 146 DOM
-
2026-06-16days on market $129,900 Active 145 DOM
-
2026-06-13days on market $129,900 Active 142 DOM
-
2026-06-09days on market $129,900 Active 138 DOM
-
2026-06-08days on market $129,900 Active 137 DOM
-
2026-06-07days on market $129,900 Active 136 DOM
-
2026-06-04days on market $129,900 Active 133 DOM
-
2026-06-03days on market $129,900 Active 132 DOM
-
2026-06-02days on market $129,900 Active 131 DOM
-
2026-06-01days on market $129,900 Active 130 DOM
-
2026-05-31days on market $129,900 Active 129 DOM
-
2026-01-22$134,900 Active 768-char remark
Show marketing remark (768 chars)
316 Seideman is a residential property located in Seguin, Texas, offering a convenient in-town location with access to downtown amenities, local schools, and major roadways. The property is being sold as-is and has been demoed, requiring a full renovation, presenting an opportunity for buyers looking to rebuild and add value in an established in-town location. Appliances, including a refrigerator, stove, and microwave, will convey with the sale. An HVAC system is present at the property. Utilities have previously been connected. The home offers flexibility for renovation or customization based on buyer plans and due diligence. Seller is open to a straightforward transaction. Buyers are encouraged to conduct their own inspections prior to submitting an offer.
-
2025-07-24soldstatus Sold 235-char remark
Show marketing remark (235 chars)
INVESTORS GOLDMINE BELOW WHOLESALE! .54 acres flat rectangular DEVELOPMENT LOT WITH ORIGINAL FOLK VICTORIAN fixer upper. So many possibilities and options! Check with City and do your due diligence. This is a rare deal that won't last!
-
2025-07-14status Pending 235-char remark
Show marketing remark (235 chars)
INVESTORS GOLDMINE BELOW WHOLESALE! .54 acres flat rectangular DEVELOPMENT LOT WITH ORIGINAL FOLK VICTORIAN fixer upper. So many possibilities and options! Check with City and do your due diligence. This is a rare deal that won't last!
-
2025-06-18price $99,950 235-char remark
Show marketing remark (235 chars)
INVESTORS GOLDMINE BELOW WHOLESALE! .54 acres flat rectangular DEVELOPMENT LOT WITH ORIGINAL FOLK VICTORIAN fixer upper. So many possibilities and options! Check with City and do your due diligence. This is a rare deal that won't last!
-
2025-06-14$105,000 New 235-char remark
Show marketing remark (235 chars)
INVESTORS GOLDMINE BELOW WHOLESALE! .54 acres flat rectangular DEVELOPMENT LOT WITH ORIGINAL FOLK VICTORIAN fixer upper. So many possibilities and options! Check with City and do your due diligence. This is a rare deal that won't last!
-
2025-06-12historical
-
2025-06-12historical
-
2025-05-29price $108,500
-
2025-05-29price $108,500
-
2025-05-28price $117,900
-
2025-05-27price $117,900
-
2025-05-15price $119,000
-
2025-05-14price $119,000
-
2025-05-06$129,999 New
-
2025-05-06$129,999 Active
-
2007-09-10soldstatus
ⓘ Source: listings_history table (triggers on properties + properties_extension) + one-shot
backfill from property_details.listing_events for pre-trigger history.
Tax reassessment forecast TX · Resets to sale price
- Current annual tax
- $1,884 · $157/mo
- Projected year-2 tax
- $2,377 · $198/mo
- Expected delta
- +$493/yr (+$41/mo · 26.2%)
ⓘ Screening estimate from a state-policy table — verify with the county assessor before closing.
Climate risk First Street
- Flood 1/10 Low FEMA zone X (unshaded) · 0% chance over 30 yrs
- Wildfire 2/10 Low
- Heat 8/10 Severe 7 d/yr ≥108°F today · 22 d/yr by 30 yrs out
- Wind 8/10 Severe 80% chance of damaging wind over 30 yrs
- Air quality 1/10 Low 0 unhealthy d/yr today · 0 by 30 yrs out
Nearby sold comps map
Loading sold comps map…
Walkable amenities ~0.75 mi
Loading nearby amenities…
Taxation est. · year 1
- Rental income
- $17,944
- − Mortgage interest
- −$7,276
- − Property taxes
- −$1,884
- − Insurance
- −$650
- − Repairs & maintenance
- −$1,436
- − Management
- −$1,436
- − Depreciation
- −$3,779
- Taxable income
- $1,484
- Est. tax owed @ 24.0%
- −$356
- After-tax cash flow
- $3,112/yr
For passive investors: Depreciation is non-cash, so a rental often shows a tax loss while cash-flowing — sheltering income. Rental losses are passive: they offset passive income freely, and up to $25,000/yr can offset ordinary (W-2) income if you actively participate and your MAGI is under $100k (phasing out to $0 by $150k); unused losses carry forward. On sale, claimed depreciation is recaptured at up to 25%, and gains may owe capital-gains tax (a 1031 exchange can defer both). Figures are a year-1 estimate at your 24.0% rate — not tax advice; consult a CPA.
Schools (NCES district)
- District
- Seguin ISD
- NCES district ID
- 4839690
- Math proficiency
- 26% ▼ -8.00%
- Reading proficiency
- 30% ▼ -5.00%
- Median HH income
- $46,210
- Composite
- 24.17/100
- National rank
- #7738
- State rank
- #663 of 826 in TX
Livability — Seguin
- Score
- 66/100
- State rank
- #592
- US rank
- #11298
Category grades
Schools grade is shown separately in the Schools card above.
Census & demographics
- Census place
- Seguin, TX
- County
- Guadalupe County · 147,291 people
- City population
- 55,600
- Metro
- San Antonio-New Braunfels, TX
- Population (ZIP)
- 55,600
- Household income
- $71,039
- Rent vs Own
- Severe rent burden
- 1053.0
Population outlook (Guadalupe County) Hauer SSP2
- Today (2025)
- 196,854 people
- By 2030
- 220,210 · +11.9%
- By 2040
- 268,004 · +36.1%
- By 2050
- 316,333 · +60.7%
- By 2075
- 434,747 · +120.8%
- By 2100
- 520,447 · +164.4%
Race, ethnicity, and origin ACS 2023
- Neighborhood character
- Diverse neighborhood (Simpson 0.58)
- Race & ethnicity
- Hispanic / Latino 49% White 43% Two or more races 26% Black 5%
- Hispanic origin (detail)
- Mexican 41%
- Common ancestry
- Lithuanian 2% Slovak 1% Romanian 1%
- Foreign-born
- 8% · Canada
- Languages at home
- 74% English-only · Spanish 24% German/W. Germanic 1%
Political lean MEDSL · Guadalupe
- 2024 margin
- Strong R (+29.5) · D 34.8% · R 64.3%
- 2008→2024 swing
- +1.5pp toward D · 2008: -31.0pp · 2024: -29.5pp
- All cycles
- 2024: R+29.5 2020: R+24.2 2016: R+31.8 2012: R+35.1 2008: R+31.0
Not yet ingested
- Civics
- —
Market trends
- HPI YoY
- ▼ -147.43%
- Current HPI
- 160.5435
- Rent YoY
- ▲ 2.04%
- Metro
- San Antonio-New Braunfels, TX
- State GDP YoY
- ▲ 3.95%
- F500 in state
- 110
Industry mix (Fortune 500 HQ in TX)
| Industry | F500 HQs | Revenue |
|---|---|---|
| Energy | 16 | $1,198B |
|
||
| Technology | 5 | $198B |
|
||
| Engineering / Construction | 4 | $72B |
|
||
| Energy Services | 3 | $60B |
|
||
| Utilities | 3 | $41B |
|
||
| Healthcare | 2 | $330B |
|
||
Price history
+3.8% since first listed16 events — show timeline
- 2026-01-22 Listed $134,900 CTXMLS
- 2025-07-24 Sold (MLS) — LERA
- 2025-07-14 Pending — LERA
- 2025-06-18 Price Changed $99,950 LERA
- 2025-06-14 Listed $105,000 LERA
- 2025-06-12 Listing Removed — LERA
- 2025-06-12 Listing Removed — CTXMLS
- 2025-05-29 Price Changed $108,500 LERA
- 2025-05-29 Price Changed $108,500 CTXMLS
- 2025-05-28 Price Changed $117,900 LERA
- 2025-05-27 Price Changed $117,900 CTXMLS
- 2025-05-15 Price Changed $119,000 LERA
- 2025-05-14 Price Changed $119,000 CTXMLS
- 2025-05-06 Listed $129,999 LERA
- 2025-05-06 Listed $129,999 CTXMLS
- 2007-09-10 Sold (Public Records) — Public Records
Property tax history
+5.6%/yrLatest (2026): $1,884 · -6.8% YoY. Source: county tax records.
Cash-flow waterfall
monthlySold comps — $/sqft
last 12 mo · ≤1 miLoading sold comps…