 Triplex
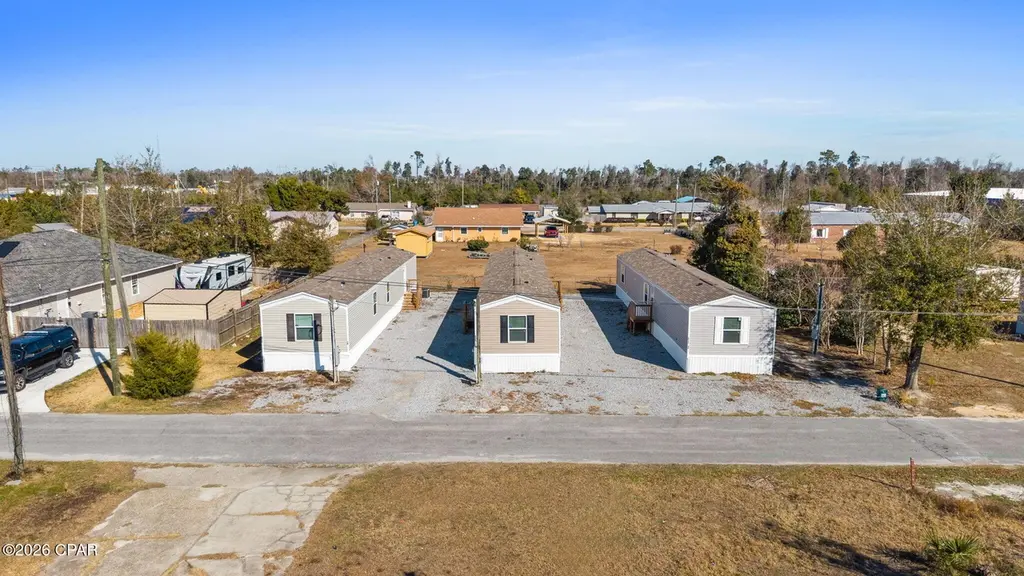
2721 E 19th St · Cedar Grove, FL
Flood risk 1/10 · Minimal
- FEMA flood zone
- X (unshaded)
- Chance of flooding over 30 yrs
- 0.0%
- Est. flood insurance / yr
- $507 – $1,088
Fire risk 5/10 · Moderate
- Est. fire insurance / yr
- $947 – $1,759
Heat risk 10/10 · Severe
- Hot days now (above 105°F)
- 7 days/yr
- Hot days in 30 yrs
- 21 days/yr
Wind risk 9/10 · Severe
- Chance of severe wind over 30 yrs
- 99.0%
Air-quality risk 1/10 · Minimal
- Unhealthy air days now
- 0 days/yr
- Unhealthy air days in 30 yrs
- 0 days/yr
Risk factors via First Street. Map © Google.
Why this score? — see what drove the D+ grade
The composite is a weighted blend of 9 inputs, each scored 0–100. Each bar is that input's sub-score; the figure is the points it added to the 100-point composite (weight × sub-score).
- Cash flow +18.3/30.0
- ARV discount +7.0/15.0
- DSCR +5.7/10.0
- Schools +4.3/10.0
- 1% rule +4.0/10.0
- Livability +3.5/5.0
- Rent growth +2.8/5.0
- Condition / age +2.5/5.0
- Appreciation +0.0/10.0
$425,000
🖨 Deal sheet 📄 Offer letter ✓ Due diligence
Multi-family units
County records classify this as Multi-Family (5+ Unit). Listing-text estimate: 3 units. estimate disagrees with records
5+ unit building — per-unit beds/baths from public records are typically unavailable; the breakdown below (if shown) is an estimate from the listing text.
Listing remarks MLS
All units are currently leased please do not disturb tenants. Investment Opportunity! This is a turnkey Mobile Home Park for sale that is located in the heart of Panama City. All three 2023 homes are like new and ready to go! The property is easily accessible and is convenient to Tyndall Air Force Base. This setup is streamlined to be income producing. Whether you are an experienced Investor or just entering the mobile home park space, this property could offer long-term potential. Contact your favorite realtor today to schedule your showing.
Key facts
- 0.28 acre lot
- Built 2023
- Listed 132 days
Neighborhood map
What this means for you Summary
Snapshot
- This is a 3 × 2-bed/1-bath units multifamily listed at $425k.
Deal economics
- At list price, monthly cash flow is $387 ($5k/yr) — positive. Per door: $129/mo.
- The deal already cash-flows at list — no discount required.
- To meet the 1% rule (rent ≥ 1% of price), the offer needs to be $384k (9.6% below list).
- Recommended offer: $374k (12.0% below list) — sets the bar for market timing.
Location & tenants
- Location reads 70/100 on livability (#445 in FL) — a middle-class / working-renter tenant base. Strengths: cost of living A+, housing A+, crime A; Watch: employment C-, schools F, amenities F.
- Bay (suburban): math 51% / reading 51% proficiency, ranked #29 of 73 in FL (top 40%) — acceptable for families but not a draw, mixed tenant base, ~2y average lease.
- Market conditions: Rents rising (+1.2%/yr); 381 active listings in the ZIP; 7 comparable units currently listed for rent nearby; rentals at typical pace (median 21d on market — plan ~3-4 weeks tenant-placement turnaround); 2,473 units permitted in Bay County in 2024 (559 in 5+ unit buildings).
- At $3,841/mo this rent would consume 63% of the median local household income ($73k/yr) (locally 1008% of renters already pay >50% of income on rent) — very limited rent-growth headroom before tenants either downsize or default.
Forward outlook
- Local home prices are declining (-3.0%/yr); year-one equity from $3k of loan paydown is wiped out by about $13k of value loss. Plan a longer hold.
- Bay County population projected at +24% by 2050 — long-run rental-demand tailwind backs the buy-and-hold thesis.
Negotiation context
- It's been on market 133 days — a 12% lower offer ($374k) is reasonable based on typical stale-listing flexibility.
- 2 sale attempts since 4y ago with the ask held roughly flat each time — persistent listings suggest the price (not the market) is what's stuck; bring a comps-based counter.
- Current owner paid $35k; list at $425k implies a 1114% gain — meaningful room to come down on a strong offer.
Risks & watch-outs
- Climate carrying-cost: severe wind risk, 99% chance of damaging wind over 30y; moderate wildfire risk; extreme-heat days projected 7→21/yr by 2055 (HVAC capex compounding) — expect insurance premiums to compound above CPI over the hold.
Questions for the listing agent
- It's been on market 133 days. Have you received any prior offers? Is the seller open to a 12% concession, seller financing, or rate buy-down credit?
- Can we see the unit-by-unit rent roll, current vacancy, and any below-market leases? What's the average tenancy length?
- What capital expenditures (roof, boiler, parking lot, exteriors) have been made in the last 5 years, and what's planned in the next 2?
- Why hasn't it sold? Are there any deal-killer items the seller is aware of (foundation, flood, title, zoning, code violations)?
- Is there a deadline driving the sale (1031 exchange, divorce, estate, relocation)? That informs how much negotiation room exists.
- Schools are F-rated, which usually means shorter tenancies and higher turnover. Who's the typical renter profile here, and what's been the actual vacancy rate?
- The area grade is low — what's the realistic commute time and amenity access for the typical tenant pool here? Any planned neighborhood developments (good or bad) we should know about?
- What's the average days-on-market for RENTAL listings here right now (not sales)? A rising rental-DOM trend means longer vacancies and softer asking-rent achievability than the comps imply.
- What's the recent tenant-quality profile in this submarket — average credit score on applications, eviction rate, late-payment / NSF rate, and stable-employment percentage? A property-management company in the area should have these aggregated.
- How much new apartment / multifamily construction is in the pipeline within 1–3 miles? Heavy new supply (>2% of stock underway) typically softens rents 12–24 months out; light construction supports rent growth.
Investment metrics
- 1% rule
- 0.90% ✗
- Cap rate
- 7.39%
- Cash-on-cash
- 3.90%
- DSCR
- 1.17
- GRM
- 9.2
CMA / ARV
- ARV (median comp)
- $420,769
- List price
- $425,000
- Delta
- 1.01%
- Verdict
- FAIR
- Comps
- 8 within 2.0 mi
Projected returns pro-forma
-3.0% appreciation · 1.24% rent growth · sell at horizon
- IRR
- -12.0%
- Equity multiple
- 0.57×
- Total profit
- $-51,038
- Equity at exit
- $63,369
- IRR
- -5.5%
- Equity multiple
- 0.67×
- Total profit
- $-39,686
- Equity at exit
- $36,746
Cash invested: $119,000 (down + closing). Projections, not guarantees.
Landlord ↔ Tenant lean methodology
- Overall (STATE)
- 87 Strongly Landlord-Friendly
- State Florida
- 87 Strongly Landlord-Friendly · R+3
- County
- — inherits STATE
- City
- — inherits STATE
ZIP-level market 32405
- Rents YoY
- 1.2%
- Active inventory
- 381
- Price-to-rent
- 27.7×
Monthly cashflow live
- Estimated rent
- $3,841 medium interval (Pro) →
- Mortgage (P&I)
- −$2,229
- Tax from tax record
- −$242 /mo · $2,901/yr
- Insurance
- −$177
- HOA
- −$0
- Vacancy / Maint / Mgmt
- −$807
- Net cashflow
- $387
Break-even live
3-unit breakdown (identical units grouped — click to expand)
| Units | Beds | Baths | Est. rent |
|---|---|---|---|
| 3× units | 2 | 1 | $3,840 |
| #1 | 2 | 1 | $1,280 |
| #2 | 2 | 1 | $1,280 |
| #3 | 2 | 1 | $1,280 |
| Total (3 units) | $3,841 | ||
UW: 25.0% down · 7.5% · 30yr · 1.5% tax · 5.0% vac · 8.0% maint · 8.0% mgmt
Financing live
Cash to close
- Down payment
- $106,250
- Closing costs
- $12,750
- Reserves months
- —
- Total cash needed
- —
Loan-product check · same deal, 3 products live
Conventional
25% down · 7.5% · 30yr
- Down + closing
- —
- Monthly P&I
- —
- Monthly cashflow
- —
- DSCR
- —
- Eligible?
- —
Personal DTI + credit; lowest rate.
DSCR
20% down · 8.5% · 30yr
- Down + closing
- —
- Monthly P&I
- —
- Monthly cashflow
- —
- DSCR
- —
- Eligible?
- —
No personal income docs; deal must DSCR.
Hard money
10% down · 12.0% · 12mo
- Down + closing
- —
- Monthly P&I
- —
- Monthly cashflow
- —
- DSCR
- —
- Eligible?
- —
Short-term bridge; refi at stabilization.
Rent comps 7 comps
| Address | Beds | Baths | Sqft | Rent | $/sqft | DOM | Units | Dist |
|---|---|---|---|---|---|---|---|---|
| 1637 N James Ave Panama City, FL | 2.0 | 1.5 | 972 | $1,275 | $1.31 | 21d | 1 | 0.31mi |
| 2623 E 16th St Unit A Panama City, FL | 3.0 | 2.0 | 1250 | $1,625 | $1.30 | 21d | 1 | 0.43mi |
| 1401 Transmitter Rd Unit 15 Panama City, FL | 3.0 | 2.0 | 1100 | $1,395 | $1.27 | 13d | 1 | 1.13mi |
| 2733 Carol Ln Panama City, FL | 2.0 | 2.0 | 950 | $1,750 | $1.84 | 21d | 1 | 1.18mi |
| 2732 Usery Rd Panama City, FL | 3.0 | 2.0 | 1000 | $1,500 | $1.50 | 13d | 1 | 1.45mi |
| 3719 E 8th Ct Panama City, FL | 1.0–4.0 | 1.0–1.5 | 950 | $1,300 | $1.37 | 21d | 1 | 1.45mi |
| 3530 Game Farm Rd Panama City, FL | 3.0 | 2.0 | 1000 | $1,500 | $1.50 | 13d | 1 | 1.47mi |
Listing history 22 events
-
2026-06-19days on market $425,000 Active 133 DOM
-
2026-06-18days on market $425,000 Active 132 DOM
-
2026-06-17days on market $425,000 Active 131 DOM
-
2026-06-16days on market $425,000 Active 130 DOM
-
2026-06-15days on market $425,000 Active 129 DOM
-
2026-06-14days on market $425,000 Active 127 DOM
-
2026-06-13days on market $425,000 Active 126 DOM
-
2026-06-10days on market $425,000 Active 124 DOM
-
2026-06-09days on market $425,000 Active 123 DOM
-
2026-06-08days on market $425,000 Active 122 DOM
-
2026-06-07days on market $425,000 Active 121 DOM
-
2026-06-05days on market $425,000 Active 118 DOM
-
2026-06-03days on market $425,000 Active 117 DOM
-
2026-06-02days on market $425,000 Active 116 DOM
-
2026-06-01days on market $425,000 Active 115 DOM
-
2026-05-31days on market $425,000 Active 114 DOM
-
2026-05-30days on market $425,000 Active 113 DOM
-
2026-02-08$425,000 Active 548-char remark
Show marketing remark (548 chars)
All units are currently leased please do not disturb tenants. Investment Opportunity! This is a turnkey Mobile Home Park for sale that is located in the heart of Panama City. All three 2023 homes are like new and ready to go! The property is easily accessible and is convenient to Tyndall Air Force Base. This setup is streamlined to be income producing. Whether you are an experienced Investor or just entering the mobile home park space, this property could offer long-term potential. Contact your favorite realtor today to schedule your showing.
-
2022-12-23soldstatus $35,000 Sold 168-char remark
Show marketing remark (168 chars)
Build to suit, all Utilities in.. Buyers use due diligence in feasibility studies. Property ready to build. Great opportunity! Go direct! Call for more information!
-
2022-12-22soldstatus $35,000
-
2022-12-13status Pending 168-char remark
Show marketing remark (168 chars)
Build to suit, all Utilities in.. Buyers use due diligence in feasibility studies. Property ready to build. Great opportunity! Go direct! Call for more information!
-
2022-07-19$49,900 Active 168-char remark
Show marketing remark (168 chars)
Build to suit, all Utilities in.. Buyers use due diligence in feasibility studies. Property ready to build. Great opportunity! Go direct! Call for more information!
ⓘ Source: listings_history table (triggers on properties + properties_extension) + one-shot
backfill from property_details.listing_events for pre-trigger history.
Tax reassessment forecast FL · Resets to sale price
- Current annual tax
- $2,901 · $242/mo
- Projected year-2 tax
- $3,528 · $294/mo
- Expected delta
- +$626/yr (+$52/mo · 21.6%)
ⓘ Screening estimate from a state-policy table — verify with the county assessor before closing.
Climate risk First Street
- Flood 1/10 Low FEMA zone X (unshaded) · 0% chance over 30 yrs
- Wildfire 5/10 Major
- Heat 10/10 Extreme 7 d/yr ≥105°F today · 21 d/yr by 30 yrs out
- Wind 9/10 Extreme 99% chance of damaging wind over 30 yrs
- Air quality 1/10 Low 0 unhealthy d/yr today · 0 by 30 yrs out
Nearby sold comps map
Loading sold comps map…
Walkable amenities ~0.75 mi
Loading nearby amenities…
Taxation est. · year 1
- Rental income
- $46,092
- − Mortgage interest
- −$23,807
- − Property taxes
- −$2,901
- − Insurance
- −$2,125
- − Repairs & maintenance
- −$3,687
- − Management
- −$3,687
- − Depreciation
- −$12,364
- Taxable loss
- −$2,479
- Est. tax savings @ 24.0%
- +$595
- After-tax cash flow
- $5,237/yr
For passive investors: Depreciation is non-cash, so a rental often shows a tax loss while cash-flowing — sheltering income. Rental losses are passive: they offset passive income freely, and up to $25,000/yr can offset ordinary (W-2) income if you actively participate and your MAGI is under $100k (phasing out to $0 by $150k); unused losses carry forward. On sale, claimed depreciation is recaptured at up to 25%, and gains may owe capital-gains tax (a 1031 exchange can defer both). Figures are a year-1 estimate at your 24.0% rate — not tax advice; consult a CPA.
Schools (NCES district)
- District
- Bay
- NCES district ID
- 1200090
- Math proficiency
- 51% ▼ -8.00%
- Reading proficiency
- 51% ▼ -7.00%
- Median HH income
- $47,740
- Composite
- 43.41/100
- National rank
- #3014
- State rank
- #29 of 73 in FL
Livability — Cedar Grove
- Score
- 70/100
- State rank
- #445
- US rank
- #8018
Category grades
Schools grade is shown separately in the Schools card above.
Census & demographics
- Census place
- Cedar Grove, FL
- County
- Bay County · 163,593 people
- Metro
- Panama City, FL
- Population (ZIP)
- 29,984
- Household income
- $73,373
- Rent vs Own
- Severe rent burden
- 1008.0
Population outlook (Bay County) Hauer SSP2
- Today (2025)
- 206,264 people
- By 2030
- 217,740 · +5.6%
- By 2040
- 238,738 · +15.7%
- By 2050
- 255,545 · +23.9%
- By 2075
- 288,295 · +39.8%
- By 2100
- 288,638 · +39.9%
Race, ethnicity, and origin ACS 2023
- Neighborhood character
- Predominantly White (67%)
- Race & ethnicity
- White 67% Black 17% Two or more races 8% Hispanic / Latino 7% Native American 1%
- Hispanic origin (detail)
- Mexican 2% Puerto Rican 3%
- Common ancestry
- Slovak 4% Lithuanian 2% Romanian 2%
- Foreign-born
- 7% · Canada
- Languages at home
- 89% English-only · Spanish 6% Arabic 1% French/Haitian/Cajun 1%
Political lean MEDSL · Bay
- 2024 margin
- Solid R (+47.4) · D 25.8% · R 73.1% · Other 1.1%
- 2008→2024 swing
- -6.6pp toward R · 2008: -40.7pp · 2024: -47.4pp
- All cycles
- 2024: R+47.4 2020: R+43.5 2016: R+46.3 2012: R+43.6 2008: R+40.7
Not yet ingested
- Civics
- —
Market trends
- HPI YoY
- ▼ -217.88%
- Current HPI
- 262.7854
- Rent YoY
- ▲ 1.24%
- Metro
- Panama City, FL
- State GDP YoY
- ▲ 3.28%
- F500 in state
- 36
Industry mix (Fortune 500 HQ in FL)
| Industry | F500 HQs | Revenue |
|---|---|---|
| Industrial Technology | 2 | $29B |
|
||
| Insurance | 2 | $17B |
|
||
| Retail | 1 | $60B |
|
||
| Technology Distribution | 1 | $58B |
|
||
| Homebuilding | 1 | $35B |
|
||
| Technology Manufacturing | 1 | $35B |
|
||
Price history
+751.7% since first listed5 events — show timeline
- 2026-02-08 Listed $425,000 CPARMLS
- 2022-12-23 Sold (MLS) $35,000 NAMLS
- 2022-12-22 Sold (Public Records) $35,000 Public Records
- 2022-12-13 Pending — NAMLS
- 2022-07-19 Listed $49,900 NAMLS
Property tax history
+22.6%/yrLatest (2025): $2,901 · +13.3% YoY. Source: county tax records.
Cash-flow waterfall
monthlySold comps — $/sqft
last 12 mo · ≤1 miLoading sold comps…