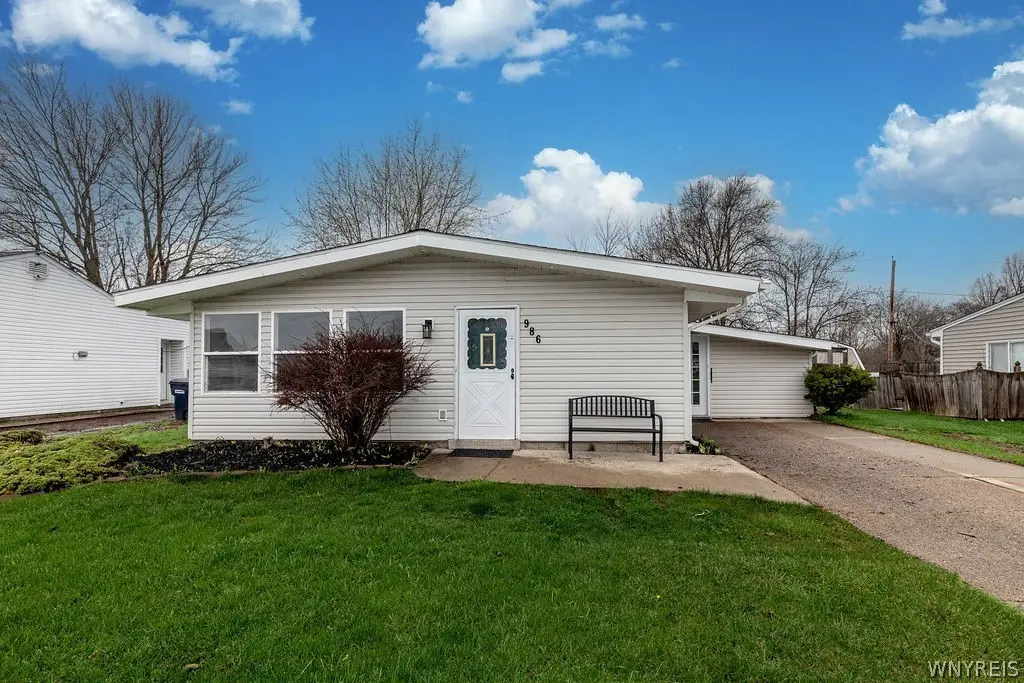
986 Enola Rd · Grandyle Village, NY
Flood risk 1/10 · Minimal
- FEMA flood zone
- X (unshaded)
- Chance of flooding over 30 yrs
- 0.0%
- Est. flood insurance / yr
- $473 – $860
Fire risk 1/10 · Minimal
- Est. fire insurance / yr
- $691 – $1,283
Heat risk 2/10 · Minimal
- Hot days now (above 92°F)
- 7 days/yr
- Hot days in 30 yrs
- 15 days/yr
Wind risk 1/10 · Minimal
- Chance of severe wind over 30 yrs
- —
Air-quality risk 3/10 · Minor
- Unhealthy air days now
- 2 days/yr
- Unhealthy air days in 30 yrs
- 3 days/yr
Risk factors via First Street. Map © Google.
Why this score? — see what drove the C+ grade
The composite is a weighted blend of 9 inputs, each scored 0–100. Each bar is that input's sub-score; the figure is the points it added to the 100-point composite (weight × sub-score).
- Cash flow +20.0/30.0
- ARV discount +15.0/15.0
- DSCR +6.3/10.0
- 1% rule +5.5/10.0
- Schools +5.0/10.0
- Livability +3.6/5.0
- Rent growth +2.5/5.0
- Condition / age +2.5/5.0
- Appreciation +0.0/10.0
$224,900
🖨 Deal sheet 📄 Offer letter ✓ Due diligence
Listing remarks MLS
Wonderful 3 bedroom beamed cathedral California style ranch! So much has been done to this home since '06 & '07, kitchen w/ oak cabinets, fully updated bath w/ ceramic floor, vinyl sided, roof-tear off, tankless HWT & boiler. Living rm has WBFP w/ stove insert, separate laundry room, spacious enclosed patio, fenced yard, concrete driveway, 100 amp electric, replacement windows & concrete patio. Shows A+++
Key facts
- Front concrete patio
- Abundant cabinetry
- Cathedral ceiling
Tags
Neighborhood map
What this means for you Summary
Snapshot
- This is a 3-bed/1.0-bath single-family listed at $225k.
Deal economics
- At list price, monthly cash flow is $274 ($3k/yr) — positive.
- The deal already cash-flows at list — no discount required.
- Meets the 1% rule at list price ($2k rent vs $225k).
- Cap rate 7.8% vs local median 4.5% in Grandyle Village — top-decile yield for the area; either an underpriced asset or a hidden risk that comps aren't pricing in. Stress-test before assuming the spread holds.
Location & tenants
- Location reads 71/100 on livability (#416 in NY) — a middle-class / working-renter tenant base. Strengths: employment A+, housing A+, health & safety A-; Watch: crime C-, amenities F, commute F.
- Grand Island Central School District (suburban): math 54% / reading 57% proficiency, ranked #263 of 590 in NY (top 45%) — acceptable for families but not a draw, mixed tenant base, ~2y average lease; only 15% free/reduced lunch — higher-income household profile.
- Market conditions: 129 active listings in the ZIP; high-income renter base; 1,244 units permitted in Erie County in 2024 (563 in 5+ unit buildings).
Forward outlook
- Local home prices are declining (-3.0%/yr); year-one equity from $2k of loan paydown is wiped out by about $7k of value loss. Plan a longer hold.
Negotiation context
- Only 4 days on market — expect competitive offers; lowballing is unlikely to land.
- 3 sale attempts since 16y ago with the ask held roughly flat each time — persistent listings suggest the price (not the market) is what's stuck; bring a comps-based counter.
- Current owner paid $98k; list at $225k implies a 128% gain — meaningful room to come down on a strong offer.
Risks & watch-outs
- Watch-outs: built in 1956 — expect roof / HVAC / electrical / plumbing capex.
Questions for the listing agent
- Built in 1956 — when were the roof, HVAC, electrical panel, plumbing, and water heater last replaced?
- Is there a deadline driving the sale (1031 exchange, divorce, estate, relocation)? That informs how much negotiation room exists.
- What's the average days-on-market for RENTAL listings here right now (not sales)? A rising rental-DOM trend means longer vacancies and softer asking-rent achievability than the comps imply.
- What's the recent tenant-quality profile in this submarket — average credit score on applications, eviction rate, late-payment / NSF rate, and stable-employment percentage? A property-management company in the area should have these aggregated.
- How much new for-sale + rental construction is in the pipeline within 1–3 miles? Heavy new supply typically softens prices + rents 12–24 months out; constrained supply supports both.
Investment metrics
- 1% rule
- 1.05% ✓
- Cap rate
- 7.75%
- Cash-on-cash
- 5.22%
- DSCR
- 1.23
- GRM
- 7.9
CMA / ARV
- ARV (on-the-fly)
- $297,078
- Comps found
- 12
Show comp detail 12 sales within ~0.75 mi
| Address | Dist | Beds/Ba | Sqft | Sold | Price | $/sf | Match |
|---|---|---|---|---|---|---|---|
| 986 Enola Rd | 0.00mi | 3/1.0 | 1,478 (0%) | 0mo | $250,000 | $169 | 100 |
| 1912 Creekside Dr | 0.23mi | 3/1.5 | 1,590 (+8%) | 4mo | $269,900 | $170 | 72 |
| 65 Crescent Rd | 0.18mi | 3/1.0 | 1,308 (-12%) | 3mo | $195,000 | $149 | 70 |
| 1118 La Salle Ave | 0.43mi | 3/2.0 | 1,530 (+4%) | 5mo | $235,000 | $154 | 66 |
| 1065 Sheree Dr | 0.29mi | 3/1.5 | 1,642 (+11%) | 2mo | $330,000 | $201 | 64 |
| 1079 Carter Dr | 0.13mi | 4/2.0 (+1) | 1,294 (-12%) | 2mo | $219,900 | $170 | 62 |
| 10 Royal Oak Cir | 0.47mi | 3/1.5 | 1,607 (+9%) | 1mo | $365,000 | $227 | 61 |
| 928 Baseline Rd | 0.43mi | 4/1.5 (+1) | 1,634 (+11%) | 0mo | $365,000 | $223 | 55 |
| 2122 Fix Rd | 0.72mi | 3/1.5 | 1,410 (-5%) | 4mo | $310,000 | $220 | 54 |
| 44 Elsie Ln | 0.37mi | 4/1.0 (+1) | 1,656 (+12%) | 5mo | $200,000 | $121 | 54 |
| 145 The Cmns | 0.44mi | 3/2.0 | 1,677 (+14%) | 3mo | $490,000 | $292 | 50 |
| 178 Marilyn Dr | 0.40mi | 4/2.5 (+1) | 1,287 (-13%) | 1mo | $261,000 | $203 | 48 |
Match score weights: distance 35% · size 25% · config 20% · recency 20%. Top-matched comps best support the ARV.
Projected returns pro-forma
-3.0% appreciation · 3.0% rent growth · sell at horizon
- IRR
- -8.2%
- Equity multiple
- 0.70×
- Total profit
- $-18,939
- Equity at exit
- $33,533
- IRR
- 1.4%
- Equity multiple
- 1.10×
- Total profit
- $6,216
- Equity at exit
- $19,445
Cash invested: $62,972 (down + closing). Projections, not guarantees.
Landlord ↔ Tenant lean methodology
- Overall (STATE)
- 15 Strongly Tenant-Friendly
- State New York
- 15 Strongly Tenant-Friendly · D+10
- County
- — inherits STATE
- City
- — inherits STATE
ZIP-level market 14072
- Active inventory
- 129
- Price-to-rent
- 7.9×
Monthly cashflow live
- Estimated rent
- $2,365 medium interval (Pro) →
- Mortgage (P&I)
- −$1,179
- Tax from tax record
- −$322 /mo · $3,858/yr
- Insurance
- −$94
- HOA
- −$0
- Vacancy / Maint / Mgmt
- −$497
- Net cashflow
- $274
Break-even live
UW: 25.0% down · 7.5% · 30yr · 1.5% tax · 5.0% vac · 8.0% maint · 8.0% mgmt
Financing live
Cash to close
- Down payment
- $56,225
- Closing costs
- $6,747
- Reserves months
- —
- Total cash needed
- —
Loan-product check · same deal, 3 products live
Conventional
25% down · 7.5% · 30yr
- Down + closing
- —
- Monthly P&I
- —
- Monthly cashflow
- —
- DSCR
- —
- Eligible?
- —
Personal DTI + credit; lowest rate.
DSCR
20% down · 8.5% · 30yr
- Down + closing
- —
- Monthly P&I
- —
- Monthly cashflow
- —
- DSCR
- —
- Eligible?
- —
No personal income docs; deal must DSCR.
Hard money
10% down · 12.0% · 12mo
- Down + closing
- —
- Monthly P&I
- —
- Monthly cashflow
- —
- DSCR
- —
- Eligible?
- —
Short-term bridge; refi at stabilization.
Listing history 9 events
-
2026-04-24status Pending
-
2026-04-20$224,900 Active
-
2023-08-29historical $1,800
-
2023-08-17$1,800
-
2010-11-23soldstatus $98,500 426-char remark
Show marketing remark (426 chars)
Wonderful 3 bedroom beamed cathedral California style ranch! So much has been done to this home since '06 & '07, kitchen w/ oak cabinets, fully updated bath w/ ceramic floor, vinyl sided, roof-tear off, tankless HWT & boiler. Living rm has WBFP w/ stove insert, separate laundry room, spacious enclosed patio, fenced yard, concrete driveway, 100 amp electric, replacement windows & concrete patio. Shows A+++
-
2010-11-23soldstatus $98,500
Show marketing remark (426 chars)
Wonderful 3 bedroom beamed cathedral California style ranch! So much has been done to this home since '06 & '07, kitchen w/ oak cabinets, fully updated bath w/ ceramic floor, vinyl sided, roof-tear off, tankless HWT & boiler. Living rm has WBFP w/ stove insert, separate laundry room, spacious enclosed patio, fenced yard, concrete driveway, 100 amp electric, replacement windows & concrete patio. Shows A+++
-
2010-04-15$103,888 426-char remark
Show marketing remark (426 chars)
Wonderful 3 bedroom beamed cathedral California style ranch! So much has been done to this home since '06 & '07, kitchen w/ oak cabinets, fully updated bath w/ ceramic floor, vinyl sided, roof-tear off, tankless HWT & boiler. Living rm has WBFP w/ stove insert, separate laundry room, spacious enclosed patio, fenced yard, concrete driveway, 100 amp electric, replacement windows & concrete patio. Shows A+++
-
2006-04-25soldstatus $83,700
-
1997-07-16soldstatus $35,000
ⓘ Source: listings_history table (triggers on properties + properties_extension) + one-shot
backfill from property_details.listing_events for pre-trigger history.
Tax reassessment forecast NY · Partial reset (capped growth)
- Current annual tax
- $3,858 · $322/mo
- Projected year-2 tax
- $3,858 · $322/mo
- Expected delta
- $0/yr ($0/mo · 0.0%)
ⓘ Screening estimate from a state-policy table — verify with the county assessor before closing.
Climate risk First Street
- Flood 1/10 Low FEMA zone X (unshaded) · 0% chance over 30 yrs
- Wildfire 1/10 Low
- Heat 2/10 Low 7 d/yr ≥92°F today · 15 d/yr by 30 yrs out
- Wind 1/10 Low
- Air quality 3/10 Moderate 2 unhealthy d/yr today · 3 by 30 yrs out
Nearby sold comps map
Loading sold comps map…
Walkable amenities ~0.75 mi
Loading nearby amenities…
Taxation est. · year 1
- Rental income
- $28,383
- − Mortgage interest
- −$12,598
- − Property taxes
- −$3,858
- − Insurance
- −$1,124
- − Repairs & maintenance
- −$2,271
- − Management
- −$2,271
- − Depreciation
- −$6,543
- Taxable loss
- −$282
- Est. tax savings @ 24.0%
- +$68
- After-tax cash flow
- $3,354/yr
For passive investors: Depreciation is non-cash, so a rental often shows a tax loss while cash-flowing — sheltering income. Rental losses are passive: they offset passive income freely, and up to $25,000/yr can offset ordinary (W-2) income if you actively participate and your MAGI is under $100k (phasing out to $0 by $150k); unused losses carry forward. On sale, claimed depreciation is recaptured at up to 25%, and gains may owe capital-gains tax (a 1031 exchange can defer both). Figures are a year-1 estimate at your 24.0% rate — not tax advice; consult a CPA.
Schools (NCES district)
- District
- Grand Island Central School District
- NCES district ID
- 3607020
- Math proficiency
- 54% ▼ -15.00%
- Reading proficiency
- 57% ▼ -1.00%
- Median HH income
- $77,014
- Composite
- 49.92/100
- National rank
- #1938
- State rank
- #263 of 590 in NY
Livability — Grandyle Village
- Score
- 71/100
- State rank
- #416
- US rank
- #7220
Category grades
Schools grade is shown separately in the Schools card above.
Census & demographics
- Census place
- Grandyle Village, NY
- County
- Erie County · 714,559 people
- Metro
- Buffalo-Cheektowaga, NY
- Population (ZIP)
- 21,488
- Household income
- $115,991
- Rent vs Own
- Severe rent burden
- 283.0
Population outlook (Erie County) Hauer SSP2
- Today (2025)
- 933,037 people
- By 2030
- 935,181 · +0.2%
- By 2040
- 928,531 · -0.5%
- By 2050
- 905,725 · -2.9%
- By 2075
- 834,037 · -10.6%
- By 2100
- 708,033 · -24.1%
Race, ethnicity, and origin ACS 2023
- Neighborhood character
- Predominantly White (90%)
- Race & ethnicity
- White 90% Two or more races 4% Hispanic / Latino 3% Black 2% Asian 2%
- Common ancestry
- Romanian 16% Lithuanian 3% Slovak 3%
- Foreign-born
- 5% · Canada
- Languages at home
- 92% English-only · Spanish 3% Other Indo-European 2% Arabic 1%
Political lean MEDSL · Erie
- 2024 margin
- Lean D (+9.7) · D 54.8% · R 45.2%
- 2008→2024 swing
- -7.9pp toward R · 2008: 17.5pp · 2024: 9.7pp
- All cycles
- 2024: D+9.7 2020: D+14.7 2016: D+4.8 2012: D+15.6 2008: D+17.5
Not yet ingested
- Civics
- —
Market trends
- HPI YoY
- ▼ -218.87%
- Current HPI
- 332.5322
- Rent YoY
- —
- Metro
- Buffalo-Cheektowaga, NY
- State GDP YoY
- ▲ 2.60%
- F500 in state
- 92
Industry mix (Fortune 500 HQ in NY)
| Industry | F500 HQs | Revenue |
|---|---|---|
| Financial Services | 10 | $950B |
|
||
| Consumer Goods | 9 | $162B |
|
||
| Insurance | 4 | $225B |
|
||
| Telecommunications | 2 | $144B |
|
||
| Pharmaceuticals | 2 | $112B |
|
||
| Media / Entertainment | 2 | $69B |
|
||
Price history
+542.6% since first listed9 events — show timeline
- 2026-04-24 Pending — WNYREIS
- 2026-04-20 Listed $224,900 WNYREIS
- 2023-08-29 Rental Removed $1,800 Avail
- 2023-08-17 Listed for Rent $1,800 Avail
- 2010-11-23 Sold (Public Records) $98,500 Public Records
- 2010-11-23 Sold (MLS) $98,500 WNYREIS
- 2010-04-15 Listed $103,888 WNYREIS
- 2006-04-25 Sold (Public Records) $83,700 Public Records
- 1997-07-16 Sold (Public Records) $35,000 Public Records
Property tax history
+1.5%/yrLatest (2025): $3,858 · -5.1% YoY. Source: county tax records.
Cash-flow waterfall
monthlySold comps — $/sqft
last 12 mo · ≤1 miLoading sold comps…