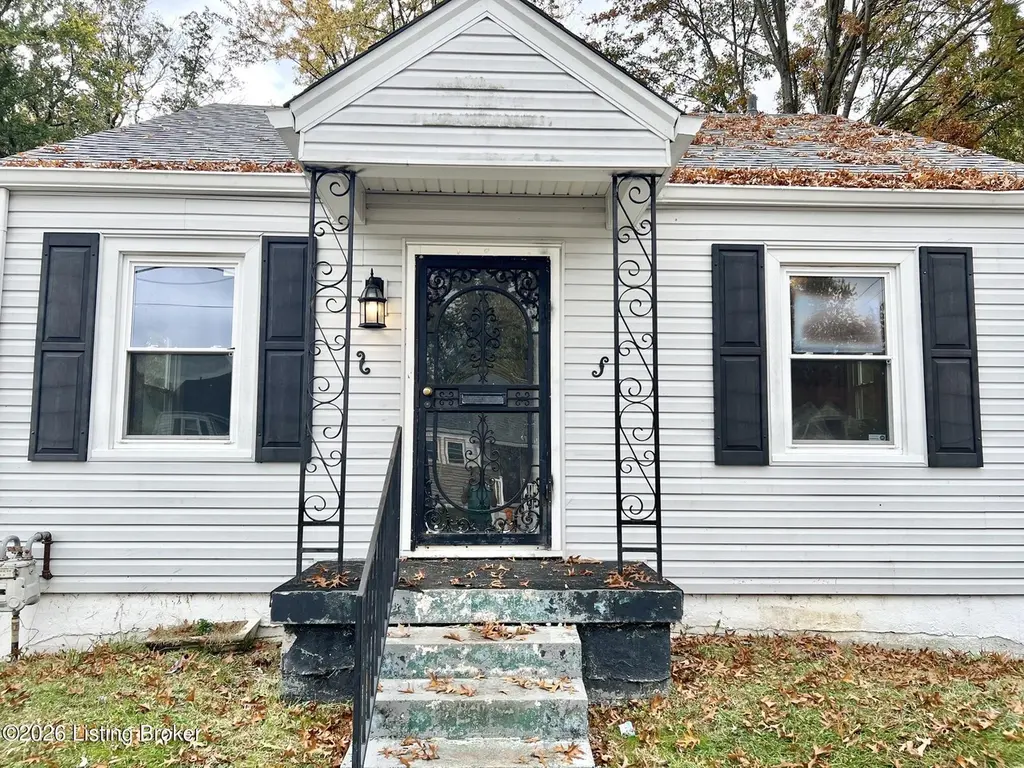
3816 Garfield Ave · Louisville, KY
Flood risk 1/10 · Minimal
- FEMA flood zone
- X (shaded)
- Chance of flooding over 30 yrs
- 0.0%
- Est. flood insurance / yr
- $473 – $860
Fire risk 1/10 · Minimal
- Est. fire insurance / yr
- $839 – $1,559
Heat risk 5/10 · Moderate
- Hot days now (above 104°F)
- 7 days/yr
- Hot days in 30 yrs
- 20 days/yr
Wind risk 2/10 · Minimal
- Chance of severe wind over 30 yrs
- 2.0%
Air-quality risk 2/10 · Minimal
- Unhealthy air days now
- 1 days/yr
- Unhealthy air days in 30 yrs
- 2 days/yr
Risk factors via First Street. Map © Google.
Why this score? — see what drove the D+ grade
The composite is a weighted blend of 9 inputs, each scored 0–100. Each bar is that input's sub-score; the figure is the points it added to the 100-point composite (weight × sub-score).
- Cash flow +16.4/30.0
- Appreciation +10.0/10.0
- DSCR +5.1/10.0
- 1% rule +3.5/10.0
- Livability +3.2/5.0
- Rent growth +2.6/5.0
- Condition / age +2.5/5.0
- Schools +2.3/10.0
- ARV discount +0.0/15.0
$139,000
🖨 Deal sheet 📄 Offer letter ✓ Due diligence
Listing remarks MLS
Welcome to your new home! Perfect for an owner occupant or an investor looking to build their portfolio. This owner just needs a few finishing touches to make it your own. Featuring two bedrooms and one full bathroom, with a bonus room that could be used as a third bedroom. You will also find a large basement with space for a second living area! Call us today for a private showing.
Key facts
- Driveway
- Unfinished basement
- Investment property
Tags
Property features AI
Finance
- HOA & community: No association fee; Subdivision: OAKS
Exterior
- Utilities: Electricity connected
- Home design: Single-family residence; Cape Cod style; 1 story
- Construction: Built in 1942; Aluminum siding; Shingle roof; Poured concrete foundation
- Exterior features: Partial chain-link fencing
Interior
- Kitchen: Kitchen on the first floor
- Bedrooms: 3 bedrooms, all on the first floor; First-floor primary bedroom
- Bathrooms: 1 full bathroom
- Heating & cooling: Forced air heating (natural gas); Wall/window cooling units; 3 HVAC units
- Interior features: 5 total rooms; 4 closets; Unfinished basement; Basement present
- Laundry & utility: First-floor laundry
Neighborhood map
What this means for you Summary
Snapshot
- This is a 3-bed/1.0-bath single-family listed at $139k.
Deal economics
- At list price, monthly cash flow is $78 ($936/yr) — positive.
- The deal already cash-flows at list — no discount required.
- To meet the 1% rule (rent ≥ 1% of price), the offer needs to be $118k (14.8% below list).
- Recommended offer: $118k (14.8% below list) — sets the bar for 1% rule.
- Cap rate 7.0% vs local median 5.0% in Louisville — top-decile yield for the area; either an underpriced asset or a hidden risk that comps aren't pricing in. Stress-test before assuming the spread holds.
Location & tenants
- Location reads 63/100 on livability (#333 in KY) — a middle-class / working-renter tenant base. Strengths: cost of living A+, housing A+; Watch: employment C-, health & safety D+, schools D-.
- Jefferson County (urban): math 19% / reading 35% proficiency, ranked #121 of 165 in KY (top 73%) — low school quality limits family demand, transient renter base, plan for 1-2y turnover.
- Market conditions: Rents flat; 140 active listings in the ZIP; 40 comparable units currently listed for rent nearby; rentals at typical pace (median 20d on market — plan ~3-4 weeks tenant-placement turnaround); lower-income renter base — watch delinquency; 2,836 units permitted in Jefferson County in 2024 (1,558 in 5+ unit buildings).
Forward outlook
- In year one you build about $15k of equity ($961 loan paydown + $14k appreciation (10.0% local appreciation)).
- Jefferson County population projected at +13% by 2050 — modest demand growth; plan on rents tracking national, not racing it.
- At projected returns (10.0% appreciation + 0.5% rent growth), your $39k cash investment doubles in ~3 years — after that, you're playing with house money.
- By year 3, paydown + projected appreciation supports a ~$38k cash-out refi (75% LTV) — recoverable capital for the next deal without selling this one.
Negotiation context
- It's been on market 18 days — a 2% lower offer ($137k) is reasonable based on typical stale-listing flexibility.
- 4 sale attempts since 4y ago with the ask held roughly flat each time — persistent listings suggest the price (not the market) is what's stuck; bring a comps-based counter.
- Current owner paid $68k; list at $139k implies a 106% gain — meaningful room to come down on a strong offer.
Risks & watch-outs
- Watch-outs: built in 1942 — expect roof / HVAC / electrical / plumbing capex.
- Climate carrying-cost: extreme-heat days projected 7→20/yr by 2055 (HVAC capex compounding) — expect insurance premiums to compound above CPI over the hold.
Questions for the listing agent
- Built in 1942 — when were the roof, HVAC, electrical panel, plumbing, and water heater last replaced?
- Is there a deadline driving the sale (1031 exchange, divorce, estate, relocation)? That informs how much negotiation room exists.
- Schools are D-rated, which usually means shorter tenancies and higher turnover. Who's the typical renter profile here, and what's been the actual vacancy rate?
- Crime grade is F in this area — have there been break-ins, vandalism, or insurance claims at this property in the last 3 years? What carrier currently insures it and at what premium?
- The area grade is low — what's the realistic commute time and amenity access for the typical tenant pool here? Any planned neighborhood developments (good or bad) we should know about?
- What's the average days-on-market for RENTAL listings here right now (not sales)? A rising rental-DOM trend means longer vacancies and softer asking-rent achievability than the comps imply.
- What's the recent tenant-quality profile in this submarket — average credit score on applications, eviction rate, late-payment / NSF rate, and stable-employment percentage? A property-management company in the area should have these aggregated.
- How much new for-sale + rental construction is in the pipeline within 1–3 miles? Heavy new supply typically softens prices + rents 12–24 months out; constrained supply supports both.
Investment metrics
- 1% rule
- 0.85% ✗
- Cap rate
- 6.97%
- Cash-on-cash
- 2.40%
- DSCR
- 1.11
- GRM
- 9.8
CMA / ARV
- ARV (on-the-fly)
- $96,654
- Comps found
- 12
Show comp detail 12 sales within ~0.75 mi
| Address | Dist | Beds/Ba | Sqft | Sold | Price | $/sf | Match |
|---|---|---|---|---|---|---|---|
| 369 N 41st St | 0.11mi | 4/1.5 (+1) | 1,100 (+1%) | 2mo | $145,000 | $132 | 84 |
| 212 N 37th St | 0.19mi | 3/1.0 | 1,036 (-5%) | 8mo | $121,000 | $117 | 77 |
| 210 N 35th St | 0.36mi | 3/1.0 | 1,119 (+3%) | 7mo | $100,000 | $89 | 72 |
| 4109 Bank St | 0.27mi | 3/1.0 | 990 (-9%) | 3mo | $157,325 | $159 | 70 |
| 117 N 34th St | 0.50mi | 3/1.0 | 1,130 (+4%) | 4mo | $34,000 | $30 | 67 |
| 356 N 43rd St | 0.28mi | 2/1.0 (-1) | 1,200 (+10%) | 1mo | $95,000 | $79 | 64 |
| 125 N 46th St | 0.51mi | 2/1.0 (-1) | 1,107 (+2%) | 6mo | $95,000 | $86 | 62 |
| 220 N 39th St | 0.15mi | 3/2.0 | 1,240 (+14%) | 4mo | $145,000 | $117 | 62 |
| 127 N 39th St | 0.24mi | 2/1.0 (-1) | 1,197 (+10%) | 8mo | $80,000 | $67 | 60 |
| 3304 Bank St | 0.67mi | 2/1.0 (-1) | 1,020 (-6%) | 2mo | $131,000 | $128 | 52 |
| 3007 Duncan St | 0.70mi | 2/1.0 (-1) | 1,220 (+12%) | 5mo | $45,000 | $37 | 38 |
| 431 Amy Ave | 0.69mi | 2/1.0 (-1) | 1,223 (+13%) | 5mo | $80,000 | $65 | 38 |
Match score weights: distance 35% · size 25% · config 20% · recency 20%. Top-matched comps best support the ARV.
Projected returns pro-forma
10.0% appreciation · 0.51% rent growth · sell at horizon
- IRR
- 25.2%
- Equity multiple
- 3.00×
- Total profit
- $77,729
- Equity at exit
- $125,222
- IRR
- 21.6%
- Equity multiple
- 6.64×
- Total profit
- $219,605
- Equity at exit
- $270,046
Cash invested: $38,920 (down + closing). Projections, not guarantees.
Landlord ↔ Tenant lean methodology
- Overall (STATE)
- 83 Strongly Landlord-Friendly
- State Kentucky
- 83 Strongly Landlord-Friendly · R+16
- County
- — inherits STATE
- City
- — inherits STATE
ZIP-level market 40212
- Home prices YoY
- 11.0%
- Rents YoY
- 0.5%
- Active inventory
- 140
- Price-to-rent
- 9.8×
Monthly cashflow live
- Estimated rent
- $1,184 high interval (Pro) →
- Mortgage (P&I)
- −$729
- Tax from tax record
- −$71 /mo · $851/yr
- Insurance
- −$58
- HOA
- −$0
- Vacancy / Maint / Mgmt
- −$249
- Net cashflow
- $78
Break-even live
UW: 25.0% down · 7.5% · 30yr · 1.5% tax · 5.0% vac · 8.0% maint · 8.0% mgmt
Financing live
Cash to close
- Down payment
- $34,750
- Closing costs
- $4,170
- Reserves months
- —
- Total cash needed
- —
Loan-product check · same deal, 3 products live
Conventional
25% down · 7.5% · 30yr
- Down + closing
- —
- Monthly P&I
- —
- Monthly cashflow
- —
- DSCR
- —
- Eligible?
- —
Personal DTI + credit; lowest rate.
DSCR
20% down · 8.5% · 30yr
- Down + closing
- —
- Monthly P&I
- —
- Monthly cashflow
- —
- DSCR
- —
- Eligible?
- —
No personal income docs; deal must DSCR.
Hard money
10% down · 12.0% · 12mo
- Down + closing
- —
- Monthly P&I
- —
- Monthly cashflow
- —
- DSCR
- —
- Eligible?
- —
Short-term bridge; refi at stabilization.
Rent comps 40 comps
| Address | Beds | Baths | Sqft | Rent | $/sqft | DOM | Units | Dist |
|---|---|---|---|---|---|---|---|---|
| 3901 Jewell Ave Louisville, KY | 3.0 | 1.0 | 1069 | $1,140 | $1.07 | 20d | 1 | 0.06mi |
| 3910 Garfield Ave Louisville, KY | 2.0 | 1.0 | 872 | $1,035 | $1.19 | 3d | 1 | 0.10mi |
| 219 N 37th St Louisville, KY | 2.0 | 1.0 | 700 | $1,150 | $1.64 | 23d | 1 | 0.16mi |
| 320 N 36th St Louisville, KY | 3.0 | 1.0 | 830 | $1,225 | $1.48 | 16d | 1 | 0.18mi |
| 127 N 40th St Louisville, KY | 3.0 | 2.0 | 1500 | $1,570 | $1.05 | 3d | 1 | 0.23mi |
| 313 N 42nd St Louisville, KY | 3.0 | 1.0 | 900 | $1,250 | $1.39 | 3d | 1 | 0.25mi |
| 106 N 40th St Louisville, KY | 3.0 | 1.0 | 1325 | $1,220 | $0.92 | 3d | 1 | 0.28mi |
| 110 Hansbrough Pl Unit 101 Louisville, KY | 2.0 | 1.0 | 924 | $1,080 | $1.17 | 23d | 1 | 0.39mi |
| 127 Boston Ct Louisville, KY | 2.0 | 1.0 | 725 | $1,100 | $1.52 | 23d | 1 | 0.41mi |
| 4143 W Market St Unit 2 Louisville, KY | 2.0 | 1.0 | 700 | $850 | $1.21 | 23d | 1 | 0.44mi |
| 4141 W Market St Unit 1 Louisville, KY | 2.0 | 1.0 | 771 | $925 | $1.20 | 2d | 1 | 0.45mi |
| 247 Cecil Ave Louisville, KY | 3.0 | 2.0 | 1083 | $1,305 | $1.20 | 19d | 1 | 0.58mi |
| 112 S 46th St Louisville, KY | 3.0 | 1.0 | 902 | $1,200 | $1.33 | 23d | 1 | 0.62mi |
| 302 Cecil Ave Louisville, KY | 2.0 | 1.0 | 984 | $1,025 | $1.04 | 16d | 1 | 0.63mi |
| 2925 Slevin St Louisville, KY | 2.0 | 1.0 | 896 | $775 | $0.86 | 3d | 1 | 0.72mi |
| 3120 Bank St Unit B Louisville, KY | 2.0 | 1.0 | 750 | $795 | $1.06 | 23d | 1 | 0.72mi |
| 2927 Rowan St Louisville, KY | 3.0 | 1.0 | 1008 | $1,205 | $1.20 | 11d | 1 | 0.73mi |
| 509 N 31st St Louisville, KY | 2.0 | 1.0 | 800 | $795 | $0.99 | 23d | 1 | 0.79mi |
| 509 N 31st St Louisville, KY | 2.0 | 1.0 | 800 | $725 | $0.91 | 16d | 1 | 0.79mi |
| 4129 W Muhammad Ali Blvd Louisville, KY | 4.0 | 2.0 | 1224 | $1,500 | $1.23 | 1d | 1 | 0.80mi |
| 4018 Vermont Ave Unit 1 Louisville, KY | 2.0 | 1.0 | 700 | $699 | $1.00 | 3d | 1 | 0.85mi |
| 3819 River Park Dr Louisville, KY | 3.0 | 1.0 | 1108 | $1,090 | $0.98 | 20d | 1 | 0.88mi |
| 3421 River Park Dr Louisville, KY | 3.0 | 1.0 | 994 | $1,250 | $1.26 | 23d | 1 | 0.93mi |
| 522 N 29th St Louisville, KY | 3.0 | 1.0 | 1031 | $1,300 | $1.26 | 3d | 1 | 0.96mi |
| 627 S 38th St Louisville, KY | 4.0 | 1.0 | 1300 | $1,349 | $1.04 | 16d | 1 | 0.98mi |
| 628 S 39th St Louisville, KY | 3.0 | 1.0 | 1448 | $1,220 | $0.84 | 16d | 1 | 1.00mi |
| 353 N 27th St Louisville, KY | 2.0 | 1.0 | 1100 | $1,100 | $1.00 | 23d | 1 | 1.01mi |
| 2906 Montgomery St Unit B Louisville, KY | 3.0 | 1.0 | 1152 | $1,060 | $0.92 | 23d | 1 | 1.03mi |
| 652 N 29th St Louisville, KY | 3.0 | 1.0 | 1127 | $1,350 | $1.20 | 17d | 1 | 1.09mi |
| 644 S 40th St Louisville, KY | 2.0 | 1.0 | 1200 | $1,500 | $1.25 | 2d | 1 | 1.10mi |
| 648 S 37th St #3 Louisville, KY | 2.0 | 1.0 | 807 | $850 | $1.05 | 23d | 1 | 1.10mi |
| 652 S 37th St #9 Louisville, KY | 3.0 | 1.0 | 1070 | $1,095 | $1.02 | 23d | 1 | 1.11mi |
| 2529 W Main St #2 Louisville, KY | 3.0 | 1.0 | 1404 | $1,200 | $0.85 | 23d | 1 | 1.16mi |
| 2614 W Jefferson St Unit 2614-4 Louisville, KY | 2.0 | 1.0 | 740 | $795 | $1.07 | 23d | 1 | 1.17mi |
| 4309 Elliott Ave Unit 1 Louisville, KY | 2.0 | 1.0 | 750 | $695 | $0.93 | 23d | 1 | 1.18mi |
| 4309 Elliott Ave Unit 1 Louisville, KY | 2.0 | 1.0 | 750 | $650 | $0.87 | 3d | 1 | 1.18mi |
| 2623 Cedar St Louisville, KY | 3.0 | 1.0 | 1000 | $1,000 | $1.00 | 23d | 1 | 1.20mi |
| 212 N 25th St Louisville, KY | 3.0 | 1.0 | 1104 | $895 | $0.81 | 23d | 1 | 1.20mi |
| 2433 Slevin St Unit 2433-2 Louisville, KY | 3.0 | 1.0 | 800 | $875 | $1.09 | 3d | 1 | 1.22mi |
| 2508 W Main St Louisville, KY | 3.0 | 1.0 | 1327 | $1,500 | $1.13 | 23d | 1 | 1.22mi |
Listing history 13 events
-
2026-06-18days on market $139,000 Active 18 DOM
-
2026-06-17days on market $139,000 Active 17 DOM
-
2026-06-16days on market $139,000 Active 16 DOM
-
2026-06-15days on market $139,000 Active 15 DOM
-
2026-06-13days on market $139,000 Active 13 DOM
-
2026-06-10days on market $139,000 Active 10 DOM
-
2026-06-09days on market $139,000 Active 9 DOM
-
2026-06-08days on market $139,000 Active 8 DOM
-
2026-06-07days on market $139,000 Active 7 DOM
-
2026-06-03days on market $139,000 Active 3 DOM
-
2026-06-02days on market $139,000 Active 2 DOM
-
2026-06-01remarks 699-char remark
-
2026-06-01$139,000 Active 1 DOM
ⓘ Source: listings_history table (triggers on properties + properties_extension) + one-shot
backfill from property_details.listing_events for pre-trigger history.
Tax reassessment forecast KY · Resets to sale price
- Current annual tax
- $851 · $71/mo
- Projected year-2 tax
- $1,195 · $100/mo
- Expected delta
- +$345/yr (+$29/mo · 40.6%)
ⓘ Screening estimate from a state-policy table — verify with the county assessor before closing.
Climate risk First Street
- Flood 1/10 Low FEMA zone X (shaded) · 0% chance over 30 yrs
- Wildfire 1/10 Low
- Heat 5/10 Major 7 d/yr ≥104°F today · 20 d/yr by 30 yrs out
- Wind 2/10 Low 2% chance of damaging wind over 30 yrs
- Air quality 2/10 Low 1 unhealthy d/yr today · 2 by 30 yrs out
Nearby sold comps map
Loading sold comps map…
Walkable amenities ~0.75 mi
Loading nearby amenities…
Taxation est. · year 1
- Rental income
- $14,213
- − Mortgage interest
- −$7,786
- − Property taxes
- −$851
- − Insurance
- −$695
- − Repairs & maintenance
- −$1,137
- − Management
- −$1,137
- − Depreciation
- −$4,044
- Taxable loss
- −$1,436
- Est. tax savings @ 24.0%
- +$345
- After-tax cash flow
- $1,280/yr
For passive investors: Depreciation is non-cash, so a rental often shows a tax loss while cash-flowing — sheltering income. Rental losses are passive: they offset passive income freely, and up to $25,000/yr can offset ordinary (W-2) income if you actively participate and your MAGI is under $100k (phasing out to $0 by $150k); unused losses carry forward. On sale, claimed depreciation is recaptured at up to 25%, and gains may owe capital-gains tax (a 1031 exchange can defer both). Figures are a year-1 estimate at your 24.0% rate — not tax advice; consult a CPA.
Schools (NCES district)
- District
- Jefferson County
- NCES district ID
- 2102990
- Math proficiency
- 19% ▼ -17.00%
- Reading proficiency
- 35% ▼ -11.00%
- Median HH income
- $47,885
- Composite
- 23.45/100
- National rank
- #7884
- State rank
- #121 of 165 in KY
Livability — Louisville
- Score
- 63/100
- State rank
- #333
- US rank
- #15887
Category grades
Schools grade is shown separately in the Schools card above.
Census & demographics
- Census place
- Louisville, KY
- County
- Jefferson County · 790,184 people
- City population
- 769,292
- Metro
- Louisville/Jefferson County, KY-IN
- Population (ZIP)
- 14,661
- Household income
- $35,753
- Rent vs Own
- Severe rent burden
- 1148.0
Population outlook (Jefferson County) Hauer SSP2
- Today (2025)
- 823,112 people
- By 2030
- 849,343 · +3.2%
- By 2040
- 895,696 · +8.8%
- By 2050
- 933,630 · +13.4%
- By 2075
- 1,028,262 · +24.9%
- By 2100
- 1,072,675 · +30.3%
Race, ethnicity, and origin ACS 2023
- Neighborhood character
- Majority Black (60%)
- Race & ethnicity
- Black 60% White 37% Two or more races 2% Hispanic / Latino 1%
- Common ancestry
- Slovak 1% Lithuanian 1% Iranian 1%
- Foreign-born
- 1% · Canada
- Languages at home
- 98% English-only · Spanish 1%
Political lean MEDSL · Jefferson
- 2024 margin
- D (+16.6) · D 57.4% · R 40.9% · Other 1.7%
- 2008→2024 swing
- +4.5pp toward D · 2008: 12.0pp · 2024: 16.6pp
- All cycles
- 2024: D+16.6 2020: D+20.1 2016: D+13.3 2012: D+11.1 2008: D+12.0
Not yet ingested
- Civics
- —
Market trends
- HPI YoY
- ▲ 29.02%
- Current HPI
- 293.2624
- Rent YoY
- ▲ 0.51%
- Metro
- Louisville/Jefferson County, KY-IN
- State GDP YoY
- ▲ 1.81%
- F500 in state
- 4
Industry mix (Fortune 500 HQ in KY)
| Industry | F500 HQs | Revenue |
|---|---|---|
| Healthcare | 1 | $118B |
|
||
| Food / Beverage | 1 | $7B |
|
||
Price history
+98.6% since first listed11 events — show timeline
- 2026-05-31 Listed $139,000 Metro Search MLS
- 2024-09-26 Rental Removed $1,350 BUILDIUM
- 2024-06-19 Listed for Rent $1,350 BUILDIUM
- 2023-12-22 Rental Removed $1,350 BUILDIUM
- 2023-12-15 Price Changed $1,350 BUILDIUM
- 2023-12-15 Listed for Rent $1,250 BUILDIUM
- 2022-04-04 Sold (Public Records) $67,500 Public Records
- 2022-04-01 Sold (MLS) $67,500 Metro Search MLS
- 2022-02-10 Pending — Metro Search MLS
- 2022-01-31 Contingent — Metro Search MLS
- 2022-01-29 Listed $70,000 Metro Search MLS
Property tax history
+9.8%/yrLatest (2025): $851 · -1.9% YoY. Source: county tax records.
Cash-flow waterfall
monthlySold comps — $/sqft
last 12 mo · ≤1 miLoading sold comps…