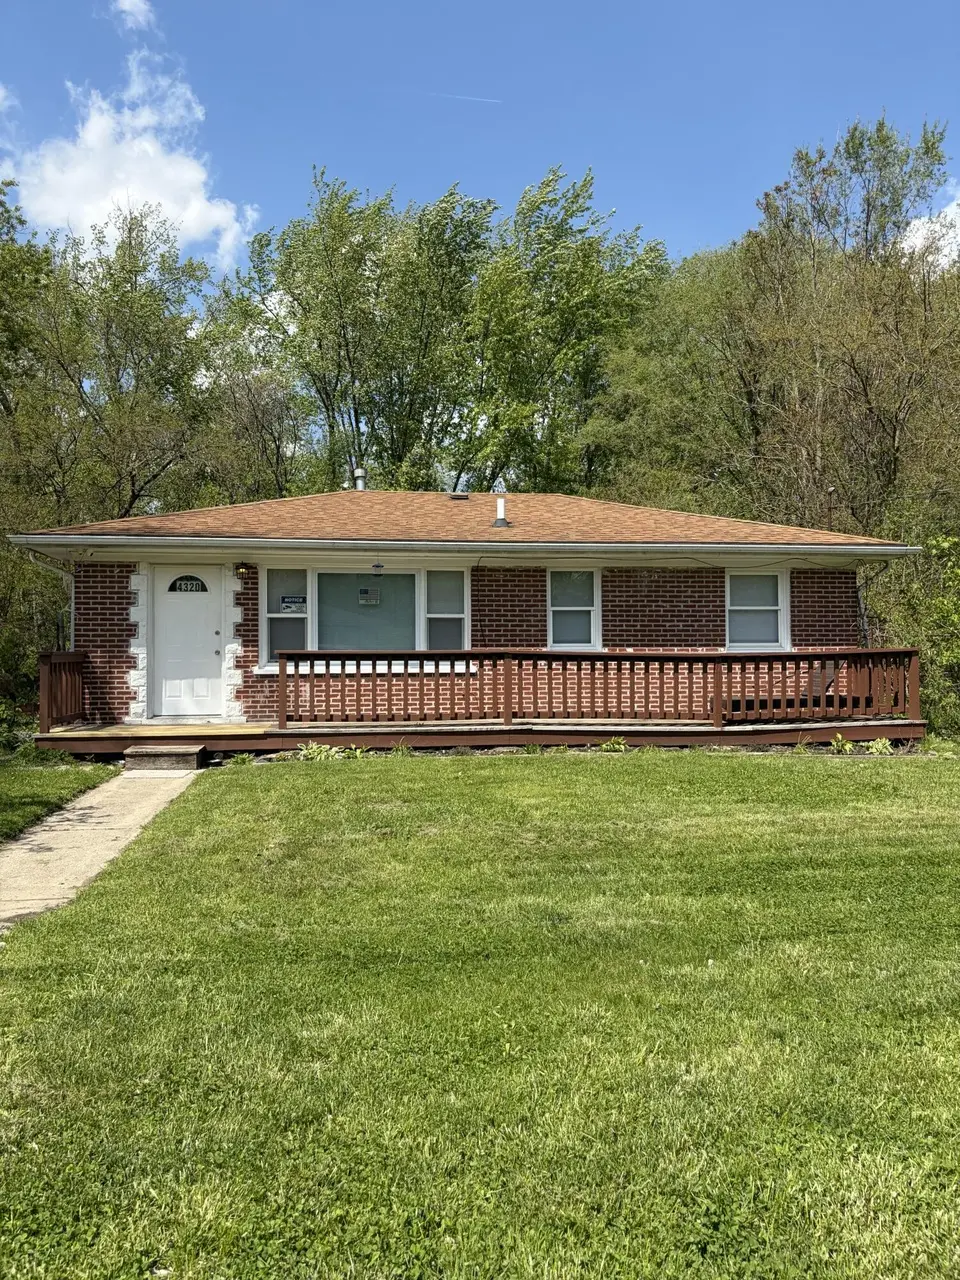
4320 W 25th Pl · Gary, IN
Flood risk 1/10 · Minimal
- FEMA flood zone
- X (unshaded)
- Chance of flooding over 30 yrs
- 0.0%
- Est. flood insurance / yr
- $507 – $1,088
Fire risk 1/10 · Minimal
- Est. fire insurance / yr
- $717 – $1,331
Heat risk 2/10 · Minimal
- Hot days now (above 102°F)
- 7 days/yr
- Hot days in 30 yrs
- 14 days/yr
Wind risk 2/10 · Minimal
- Chance of severe wind over 30 yrs
- 0.0%
Air-quality risk 4/10 · Minor
- Unhealthy air days now
- 5 days/yr
- Unhealthy air days in 30 yrs
- 6 days/yr
Risk factors via First Street. Map © Google.
Why this score? — see what drove the D+ grade
The composite is a weighted blend of 9 inputs, each scored 0–100. Each bar is that input's sub-score; the figure is the points it added to the 100-point composite (weight × sub-score).
- Cash flow +22.1/30.0
- DSCR +7.1/10.0
- Rent growth +5.0/5.0
- 1% rule +4.9/10.0
- Livability +3.7/5.0
- Condition / age +2.5/5.0
- Schools +1.3/10.0
- ARV discount +0.0/15.0
- Appreciation +0.0/10.0
$135,000
🖨 Deal sheet 📄 Offer letter ✓ Due diligence
Listing remarks
Great Investment Potential as an AirBNB with the Hard Rock Casino Music Venue nearby * * * Owner is giving 5,000 Closing Cost Credit to buyer!!! This beautifully updated home is within a mile from the exciting Hard Rock Casino featuring live entertainment, dining, and gaming! Enjoy the privacy with a fully fenced backyard backing to a forest and no backyard neighbors featuring a shed, swing set, and basketball court for summertime fun. This move-in ready home is freshly painted and has been thoughtfully converted into a spacious 2 bedroom to create an eat-in dining area offering an open and comfortable layout. (can easily be converted back into a 3 bedroom, if desired). With luxurious v
Key facts
- Shed
- Backing to a forest
- Basketball court
Tags
Property features AI
Exterior
- Parking: Oversized driveway with additional parking
- Security: Carbon monoxide detectors; Smoke detectors
- Utilities: Public water; Public sewer and septic tank
- Home design: Single-story home; Built in 1965
- Construction: Built in 1965
- Exterior features: Neighborhood view; Additional/oversized driveway parking on concrete
Interior
- Kitchen: Gas range; Microwave; Stainless steel appliances
- Bedrooms: Primary bedroom; Secondary bedroom
- Bathrooms: 1 full bathroom
- Heating & cooling: Forced air heating; Central air conditioning
- Interior features: Granite counters; Neighborhood view; Carbon monoxide and smoke detectors
- Laundry & utility: Washer and dryer on the main level
Neighborhood map
What this means for you Summary
Snapshot
- This is a 2-bed/1.0-bath single-family listed at $135k.
Deal economics
- At list price, monthly cash flow is $217 ($3k/yr) — positive.
- The deal already cash-flows at list — no discount required.
- To meet the 1% rule (rent ≥ 1% of price), the offer needs to be $134k (1.1% below list).
- Recommended offer: $134k (1.1% below list) — sets the bar for 1% rule.
Location & tenants
- Location reads 73/100 on livability (#105 in IN) — a middle-class / working-renter tenant base. Strengths: commute A+, cost of living A+, housing A+; Watch: schools F, crime F, employment F.
- Lake Ridge New Tech Schools (suburban): math 11% / reading 20% proficiency, ranked #287 of 301 in IN (top 95%) — low school quality limits family demand, transient renter base, plan for 1-2y turnover; 79% free/reduced lunch — lower-income household profile, screen leases tightly.
- Market conditions: Rents rising fast (+11.6%/yr); 67 active listings in the ZIP; 10 comparable units currently listed for rent nearby; rentals leasing fast (median 1d on market — plan ~1-2 weeks tenant-placement turnaround); lower-income renter base — watch delinquency; 1,642 units permitted in Lake County in 2024 (14 in 5+ unit buildings).
- This rent runs 38% of the median local income ($42k/yr) — at the standard rent-burdened threshold; future hikes will face affordability resistance.
Forward outlook
- Local home prices are declining (-3.0%/yr); year-one equity from $933 of loan paydown is wiped out by about $4k of value loss. Plan a longer hold.
- Lake County population projected to shrink 7% by 2050 — rents likely to lag national; underwrite the cash flow, not the appreciation.
- At projected returns (-3.0% appreciation + 8.0% rent growth), your $38k cash investment doubles in ~9 years — after that, you're playing with house money.
Negotiation context
- Only 5 days on market — expect competitive offers; lowballing is unlikely to land.
Questions for the listing agent
- Built in 1965 — when were the roof, HVAC, electrical panel, plumbing, and water heater last replaced?
- Is there a deadline driving the sale (1031 exchange, divorce, estate, relocation)? That informs how much negotiation room exists.
- Schools are F-rated, which usually means shorter tenancies and higher turnover. Who's the typical renter profile here, and what's been the actual vacancy rate?
- Crime grade is F in this area — have there been break-ins, vandalism, or insurance claims at this property in the last 3 years? What carrier currently insures it and at what premium?
- The area grade is low — what's the realistic commute time and amenity access for the typical tenant pool here? Any planned neighborhood developments (good or bad) we should know about?
- What's the average days-on-market for RENTAL listings here right now (not sales)? A rising rental-DOM trend means longer vacancies and softer asking-rent achievability than the comps imply.
- What's the recent tenant-quality profile in this submarket — average credit score on applications, eviction rate, late-payment / NSF rate, and stable-employment percentage? A property-management company in the area should have these aggregated.
- How much new for-sale + rental construction is in the pipeline within 1–3 miles? Heavy new supply typically softens prices + rents 12–24 months out; constrained supply supports both.
Investment metrics
- 1% rule
- 0.99% ✗
- Cap rate
- 8.22%
- Cash-on-cash
- 6.89%
- DSCR
- 1.31
- GRM
- 8.4
CMA / ARV
- ARV (on-the-fly)
- $114,912
- Comps found
- 12
Show comp detail 12 sales within ~0.75 mi
| Address | Dist | Beds/Ba | Sqft | Sold | Price | $/sf | Match |
|---|---|---|---|---|---|---|---|
| 4144 W 23rd Ave | 0.34mi | 3/1.5 (+1) | 900 (+4%) | 1mo | $80,000 | $89 | 69 |
| 4233 W 22nd Ave | 0.44mi | 3/1.0 (+1) | 850 (-2%) | 6mo | $82,000 | $96 | 67 |
| 4154 W 23rd Ave | 0.33mi | 3/1.0 (+1) | 900 (+4%) | 10mo | $57,000 | $63 | 64 |
| 4241 W 22nd Plz | 0.34mi | 3/1.0 (+1) | 925 (+7%) | 8mo | $63,000 | $68 | 60 |
| 2165 Williams St | 0.48mi | 3/1.5 (+1) | 890 (+3%) | 9mo | $135,000 | $152 | 58 |
| 4082 W 21st Pl | 0.54mi | 3/1.0 (+1) | 941 (+9%) | 1mo | $129,900 | $138 | 55 |
| 4050 W 22nd Plz | 0.41mi | 3/1.0 (+1) | 941 (+9%) | 13mo | $124,900 | $133 | 50 |
| 4317 W 19th Plz | 0.72mi | 3/1.0 (+1) | 873 (+1%) | 12mo | $119,900 | $137 | 50 |
| 3902 W 21st Ave | 0.63mi | 3/1.0 (+1) | 925 (+7%) | 9mo | $126,000 | $136 | 47 |
| 2173 Baker St | 0.46mi | 3/1.0 (+1) | 950 (+10%) | 13mo | $48,000 | $51 | 46 |
| 2217 Wright St | 0.47mi | 3/1.0 (+1) | 950 (+10%) | 14mo | $135,000 | $142 | 45 |
| 4251 W 20th Pl | 0.60mi | 3/1.0 (+1) | 950 (+10%) | 9mo | $100,000 | $105 | 43 |
Match score weights: distance 35% · size 25% · config 20% · recency 20%. Top-matched comps best support the ARV.
Projected returns pro-forma
-3.0% appreciation · 8.0% rent growth · sell at horizon
- IRR
- -0.7%
- Equity multiple
- 0.97×
- Total profit
- $-1,026
- Equity at exit
- $20,129
- IRR
- 13.3%
- Equity multiple
- 2.29×
- Total profit
- $48,886
- Equity at exit
- $11,672
Cash invested: $37,800 (down + closing). Projections, not guarantees.
Landlord ↔ Tenant lean methodology
- Overall (STATE)
- 90 Strongly Landlord-Friendly
- State Indiana
- 90 Strongly Landlord-Friendly · R+11
- County
- — inherits STATE
- City
- — inherits STATE
ZIP-level market 46404
- Home prices YoY
- -4.8%
- Rents YoY
- 11.6%
- Active inventory
- 67
- Price-to-rent
- 8.4×
Monthly cashflow live
- Estimated rent
- $1,336 high interval (Pro) →
- Mortgage (P&I)
- −$708
- Tax from tax record
- −$74 /mo · $886/yr
- Insurance
- −$56
- HOA
- −$0
- Vacancy / Maint / Mgmt
- −$280
- Net cashflow
- $217
Break-even live
UW: 25.0% down · 7.5% · 30yr · 1.5% tax · 5.0% vac · 8.0% maint · 8.0% mgmt
Financing live
Cash to close
- Down payment
- $33,750
- Closing costs
- $4,050
- Reserves months
- —
- Total cash needed
- —
Loan-product check · same deal, 3 products live
Conventional
25% down · 7.5% · 30yr
- Down + closing
- —
- Monthly P&I
- —
- Monthly cashflow
- —
- DSCR
- —
- Eligible?
- —
Personal DTI + credit; lowest rate.
DSCR
20% down · 8.5% · 30yr
- Down + closing
- —
- Monthly P&I
- —
- Monthly cashflow
- —
- DSCR
- —
- Eligible?
- —
No personal income docs; deal must DSCR.
Hard money
10% down · 12.0% · 12mo
- Down + closing
- —
- Monthly P&I
- —
- Monthly cashflow
- —
- DSCR
- —
- Eligible?
- —
Short-term bridge; refi at stabilization.
Rent comps 10 comps
| Address | Beds | Baths | Sqft | Rent | $/sqft | DOM | Units | Dist |
|---|---|---|---|---|---|---|---|---|
| 4328 W 22nd Plz Gary, IN | 3.0 | 1.0 | 950 | $1,300 | $1.37 | 2d | 1 | 0.34mi |
| 4300 W 22nd Pl Gary, IN | 3.0 | 1.0 | 977 | $1,395 | $1.43 | 2d | 1 | 0.39mi |
| 4134 W 22nd Pl Gary, IN | 3.0 | 1.0 | 825 | $1,395 | $1.69 | 1d | 1 | 0.42mi |
| 4061 W 20th Pl Gary, IN | 3.0 | 1.0 | 925 | $1,450 | $1.57 | 1d | 1 | 0.60mi |
| 1531 Taney Pl Gary, IN | 2.0 | 1.0 | 900 | $1,045 | $1.16 | 1d | 1 | 1.32mi |
| 2264 Taft St Gary, IN | 2.0 | 1.0 | 800 | $1,275 | $1.59 | 1d | 1 | 1.33mi |
| 2280 Roosevelt Pl Gary, IN | 3.0 | 1.0 | 864 | $1,560 | $1.81 | 1d | 1 | 1.38mi |
| 1043 Mount St Gary, IN | 3.0 | 1.0 | 750 | $1,200 | $1.60 | 1d | 1 | 1.41mi |
| 1595 Ellsworth St Unit 1 Gary, IN | 2.0 | 1.0 | 868 | $1,100 | $1.27 | 1d | 1 | 1.49mi |
| 1595 Ellsworth St Gary, IN | 2.0 | 1.0 | 868 | $1,100 | $1.27 | 2d | 1 | 1.49mi |
Listing history 4 events
-
2026-06-02status $135,000 Pending 5 DOM
-
2026-06-01days on market $135,000 Active 5 DOM
-
2026-05-31days on market $135,000 Active 4 DOM
-
2026-05-21$139,000 Active
ⓘ Source: listings_history table (triggers on properties + properties_extension) + one-shot
backfill from property_details.listing_events for pre-trigger history.
Tax reassessment forecast IN · Partial reset (capped growth)
- Current annual tax
- $886 · $74/mo
- Projected year-2 tax
- $1,017 · $85/mo
- Expected delta
- +$131/yr (+$11/mo · 14.8%)
ⓘ Screening estimate from a state-policy table — verify with the county assessor before closing.
Climate risk First Street
- Flood 1/10 Low FEMA zone X (unshaded) · 0% chance over 30 yrs
- Wildfire 1/10 Low
- Heat 2/10 Low 7 d/yr ≥102°F today · 14 d/yr by 30 yrs out
- Wind 2/10 Low 0% chance of damaging wind over 30 yrs
- Air quality 4/10 Moderate 5 unhealthy d/yr today · 6 by 30 yrs out
Nearby sold comps map
Loading sold comps map…
Walkable amenities ~0.75 mi
Loading nearby amenities…
Taxation est. · year 1
- Rental income
- $16,028
- − Mortgage interest
- −$7,562
- − Property taxes
- −$886
- − Insurance
- −$675
- − Repairs & maintenance
- −$1,282
- − Management
- −$1,282
- − Depreciation
- −$3,927
- Taxable income
- $413
- Est. tax owed @ 24.0%
- −$99
- After-tax cash flow
- $2,506/yr
For passive investors: Depreciation is non-cash, so a rental often shows a tax loss while cash-flowing — sheltering income. Rental losses are passive: they offset passive income freely, and up to $25,000/yr can offset ordinary (W-2) income if you actively participate and your MAGI is under $100k (phasing out to $0 by $150k); unused losses carry forward. On sale, claimed depreciation is recaptured at up to 25%, and gains may owe capital-gains tax (a 1031 exchange can defer both). Figures are a year-1 estimate at your 24.0% rate — not tax advice; consult a CPA.
Schools (NCES district)
- District
- Lake Ridge New Tech Schools
- NCES district ID
- 1805460
- Math proficiency
- 11% ▼ -18.00%
- Reading proficiency
- 20% ▼ -9.00%
- Median HH income
- $34,568
- Composite
- 12.67/100
- National rank
- #9607
- State rank
- #287 of 301 in IN
Livability — Gary
- Score
- 73/100
- State rank
- #105
- US rank
- #5592
Category grades
Schools grade is shown separately in the Schools card above.
Census & demographics
- Census place
- Gary, IN
- County
- Lake County · 422,878 people
- City population
- 63,701
- Metro
- Chicago-Naperville-Elgin, IL-IN-WI
- Population (ZIP)
- 15,428
- Household income
- $42,256
- Rent vs Own
- Severe rent burden
- 800.0
Population outlook (Lake County) Hauer SSP2
- Today (2025)
- 484,026 people
- By 2030
- 478,091 · -1.2%
- By 2040
- 462,974 · -4.3%
- By 2050
- 449,894 · -7.1%
- By 2075
- 436,169 · -9.9%
- By 2100
- 426,607 · -11.9%
Race, ethnicity, and origin ACS 2023
- Neighborhood character
- Predominantly Black (90%)
- Race & ethnicity
- Black 90% Two or more races 5% Hispanic / Latino 5% White 1%
- Foreign-born
- 1% · Canada
- Languages at home
- 99% English-only · Spanish 1%
Political lean MEDSL · Lake
- 2024 margin
- Lean D (+5.6) · D 52.1% · R 46.5% · Other 1.5%
- 2008→2024 swing
- -28.6pp toward R · 2008: 34.3pp · 2024: 5.6pp
- All cycles
- 2024: D+5.6 2020: D+15.1 2016: D+20.6 2012: D+31.0 2008: D+34.3
Not yet ingested
- Civics
- —
Market trends
- HPI YoY
- ▼ -12.76%
- Current HPI
- 252.6463
- Rent YoY
- ▲ 11.62%
- Metro
- Chicago-Naperville-Elgin, IL-IN-WI
- State GDP YoY
- ▲ 2.90%
- F500 in state
- 18
Industry mix (Fortune 500 HQ in IN)
| Industry | F500 HQs | Revenue |
|---|---|---|
| Industrial Machinery | 2 | $37B |
|
||
| Healthcare | 1 | $177B |
|
||
| Pharmaceuticals | 1 | $45B |
|
||
| Metals / Steel | 1 | $18B |
|
||
| Agriculture | 1 | $17B |
|
||
| Packaging | 1 | $12B |
|
||
Price history
1 event — show timeline
- 2026-05-21 Listed $139,000 NIRA MLS as Distributed by MLS Grid
Property tax history
-13.4%/yrLatest (2024): $886 · +6.7% YoY. Source: county tax records.
Cash-flow waterfall
monthlySold comps — $/sqft
last 12 mo · ≤1 miLoading sold comps…