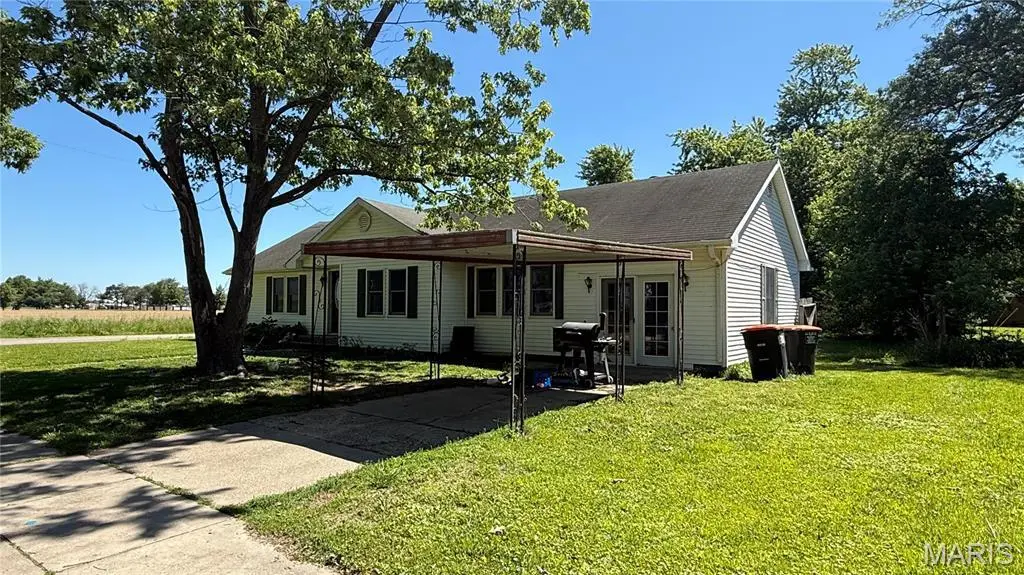
410 N Cypress St · Advance, MO
Flood risk 1/10 · Minimal
- FEMA flood zone
- —
- Chance of flooding over 30 yrs
- 0.0%
- Est. flood insurance / yr
- —
Fire risk 1/10 · Minimal
- Est. fire insurance / yr
- $1,054 – $1,958
Heat risk 5/10 · Moderate
- Hot days now (above 108°F)
- 7 days/yr
- Hot days in 30 yrs
- 20 days/yr
Wind risk 2/10 · Minimal
- Chance of severe wind over 30 yrs
- 4.0%
Air-quality risk 2/10 · Minimal
- Unhealthy air days now
- 0 days/yr
- Unhealthy air days in 30 yrs
- 1 days/yr
Risk factors via First Street. Map © Google.
Why this score? — see what drove the B- grade
The composite is a weighted blend of 9 inputs, each scored 0–100. Each bar is that input's sub-score; the figure is the points it added to the 100-point composite (weight × sub-score).
- Cash flow +19.0/30.0
- ARV discount +15.0/15.0
- Appreciation +10.0/10.0
- DSCR +6.0/10.0
- 1% rule +4.1/10.0
- Schools +4.1/10.0
- Livability +3.2/5.0
- Rent growth +2.5/5.0
- Condition / age +2.5/5.0
$118,828
🖨 Deal sheet 📄 Offer letter ✓ Due diligence
Listing remarks
Lots of space for a little bit of money! Situated on a corner lot, this approx 1875 sq ft home is all on one level for easy living. Large laundry/craft room, 4 bedrooms, 2 full baths, and spacious kitchen, living room and sun room. Additional storage in the outdoor shed. Add some fresh cosmetic updates and you'll have yourself a show place.
Key facts
- Outdoor shed
- Corner lot
- 9,931 sq ft lot
Tags
Property features AI
Finance
- Other: Shed(s) on the property
Exterior
- Parking: Carport (1 space)
- Utilities: Public water; Public sewer; 220 volt electric service; Cable available; Electricity connected; Natural gas connected
- Home design: Single family residence; One level (single-story); Residential property; House
- Construction: Vinyl siding; Shingle roof
- Exterior features: Front porch; Wood fencing; Corner lot; Paved road
Interior
- Kitchen: Dishwasher; Wall oven
- Bedrooms: 4 bedrooms on the main level (all bedrooms are on the main level)
- Flooring: Linoleum; Tile
- Bathrooms: 2 full bathrooms on the main level
- Heating & cooling: Forced air heating (natural gas); Central air conditioning; Ceiling fans; Electric cooling
- Interior features: Built-in features; Eat-in kitchen; No basement
- Laundry & utility: Laundry on the main level
Neighborhood map
What this means for you Summary
Snapshot
- This is a 4-bed/2.5-bath other listed at $119k.
Deal economics
- At list price, monthly cash flow is $125 ($1k/yr) — positive.
- The deal already cash-flows at list — no discount required.
- To meet the 1% rule (rent ≥ 1% of price), the offer needs to be $108k (9.0% below list).
- Recommended offer: $108k (9.0% below list) — sets the bar for 1% rule.
Location & tenants
- Location reads 63/100 on livability (#346 in MO) — a middle-class / working-renter tenant base. Strengths: cost of living A+, housing A+, crime A; Watch: amenities F, commute F, employment F.
- Advance R-IV (rural): math 46% / reading 53% proficiency, ranked #55 of 324 in MO (top 17%) — families likely to look elsewhere, expect single-tenant / working-renter base with shorter leases.
- Zoned schools: Advance Elem. (math 72% / reading 62%, grade B+, #46 of 1,115 statewide, top 5%, 237 students, 46% FRL); Advance High (math 22% / reading 42%, grade F, #356 of 521 statewide, top 71%, 183 students, 41% FRL) — zoned schools at 44% FRL track the district average.
- Market conditions: 6 active listings in the ZIP; 17 units permitted in Stoddard County in 2024 (0 in 5+ unit buildings).
Forward outlook
- In year one you build about $13k of equity ($822 loan paydown + $12k appreciation (10.0% local appreciation)).
- Stoddard County population projected at -12% by 2050 — secular population decline; favor cash flow + early exit over multi-decade hold.
- At projected returns (10.0% appreciation + 3.0% rent growth), your $33k cash investment doubles in ~3 years — after that, you're playing with house money.
- By year 3, paydown + projected appreciation supports a ~$32k cash-out refi (75% LTV) — recoverable capital for the next deal without selling this one.
Negotiation context
- It's been on market 34 days — a 3% lower offer ($115k) is reasonable based on typical stale-listing flexibility.
Risks & watch-outs
- Watch-outs: built in 1950 — expect roof / HVAC / electrical / plumbing capex.
- Climate carrying-cost: extreme-heat days projected 7→20/yr by 2055 (HVAC capex compounding) — expect insurance premiums to compound above CPI over the hold.
Questions for the listing agent
- It's been on market 34 days. Have you received any prior offers? Is the seller open to a 9% concession, seller financing, or rate buy-down credit?
- Built in 1950 — when were the roof, HVAC, electrical panel, plumbing, and water heater last replaced?
- Is there a deadline driving the sale (1031 exchange, divorce, estate, relocation)? That informs how much negotiation room exists.
- Schools are D-rated, which usually means shorter tenancies and higher turnover. Who's the typical renter profile here, and what's been the actual vacancy rate?
- What's the average days-on-market for RENTAL listings here right now (not sales)? A rising rental-DOM trend means longer vacancies and softer asking-rent achievability than the comps imply.
- What's the recent tenant-quality profile in this submarket — average credit score on applications, eviction rate, late-payment / NSF rate, and stable-employment percentage? A property-management company in the area should have these aggregated.
- How much new for-sale + rental construction is in the pipeline within 1–3 miles? Heavy new supply typically softens prices + rents 12–24 months out; constrained supply supports both.
Investment metrics
- 1% rule
- 0.91% ✗
- Cap rate
- 7.55%
- Cash-on-cash
- 4.50%
- DSCR
- 1.20
- GRM
- 9.2
CMA / ARV
- ARV (median comp)
- $184,782
- List price
- $118,828
- Delta
- -35.69%
- Verdict
- UNDERPRICED
- Comps
- 20 within 1.0 mi
Projected returns pro-forma
10.0% appreciation · 3.0% rent growth · sell at horizon
- IRR
- 27.5%
- Equity multiple
- 3.18×
- Total profit
- $72,625
- Equity at exit
- $107,050
- IRR
- 24.0%
- Equity multiple
- 7.24×
- Total profit
- $207,539
- Equity at exit
- $230,857
Cash invested: $33,272 (down + closing). Projections, not guarantees.
Landlord ↔ Tenant lean methodology
- Overall (STATE)
- 81 Strongly Landlord-Friendly
- State Missouri
- 81 Strongly Landlord-Friendly · R+10
- County
- — inherits STATE
- City
- — inherits STATE
ZIP-level market 63730
- Home prices YoY
- 33.1%
- Active inventory
- 6
- Price-to-rent
- 9.2×
Monthly cashflow live
- Estimated rent
- $1,081 medium interval (Pro) →
- Mortgage (P&I)
- −$623
- Tax from tax record
- −$57 /mo · $683/yr
- Insurance
- −$50
- HOA
- −$0
- Vacancy / Maint / Mgmt
- −$227
- Net cashflow
- $125
Break-even live
UW: 25.0% down · 7.5% · 30yr · 1.5% tax · 5.0% vac · 8.0% maint · 8.0% mgmt
Financing live
Cash to close
- Down payment
- $29,707
- Closing costs
- $3,565
- Reserves months
- —
- Total cash needed
- —
Loan-product check · same deal, 3 products live
Conventional
25% down · 7.5% · 30yr
- Down + closing
- —
- Monthly P&I
- —
- Monthly cashflow
- —
- DSCR
- —
- Eligible?
- —
Personal DTI + credit; lowest rate.
DSCR
20% down · 8.5% · 30yr
- Down + closing
- —
- Monthly P&I
- —
- Monthly cashflow
- —
- DSCR
- —
- Eligible?
- —
No personal income docs; deal must DSCR.
Hard money
10% down · 12.0% · 12mo
- Down + closing
- —
- Monthly P&I
- —
- Monthly cashflow
- —
- DSCR
- —
- Eligible?
- —
Short-term bridge; refi at stabilization.
Listing history 16 events
-
2026-06-18days on market $118,828 Active 34 DOM
-
2026-06-17days on market $118,828 Active 33 DOM
-
2026-06-16days on market $118,828 Active 32 DOM
-
2026-06-15days on market $118,828 Active 31 DOM
-
2026-06-13days on market $118,828 Active 29 DOM
-
2026-06-12days on market $118,828 Active 28 DOM
-
2026-06-09days on market $118,828 Active 25 DOM
-
2026-06-08days on market $118,828 Active 24 DOM
-
2026-06-07days on market $118,828 Active 23 DOM
-
2026-06-07pricedays on market $118,828 Active 22 DOM
-
2026-06-04days on market $121,875 Active 19 DOM
-
2026-06-02days on market $121,875 Active 18 DOM
-
2026-06-01days on market $121,875 Active 17 DOM
-
2026-05-31days on market $121,875 Active 16 DOM
-
2026-05-15$125,000 Active 346-char remark
-
2021-10-12soldstatus
ⓘ Source: listings_history table (triggers on properties + properties_extension) + one-shot
backfill from property_details.listing_events for pre-trigger history.
Tax reassessment forecast MO · Resets to sale price
- Current annual tax
- $683 · $57/mo
- Projected year-2 tax
- $1,153 · $96/mo
- Expected delta
- +$470/yr (+$39/mo · 68.9%)
ⓘ Screening estimate from a state-policy table — verify with the county assessor before closing.
Climate risk First Street
- Flood 1/10 Low 0% chance over 30 yrs
- Wildfire 1/10 Low
- Heat 5/10 Major 7 d/yr ≥108°F today · 20 d/yr by 30 yrs out
- Wind 2/10 Low 4% chance of damaging wind over 30 yrs
- Air quality 2/10 Low 0 unhealthy d/yr today · 1 by 30 yrs out
Nearby sold comps map
Loading sold comps map…
Walkable amenities ~0.75 mi
Loading nearby amenities…
Taxation est. · year 1
- Rental income
- $12,977
- − Mortgage interest
- −$6,656
- − Property taxes
- −$683
- − Insurance
- −$594
- − Repairs & maintenance
- −$1,038
- − Management
- −$1,038
- − Depreciation
- −$3,457
- Taxable loss
- −$489
- Est. tax savings @ 24.0%
- +$117
- After-tax cash flow
- $1,615/yr
For passive investors: Depreciation is non-cash, so a rental often shows a tax loss while cash-flowing — sheltering income. Rental losses are passive: they offset passive income freely, and up to $25,000/yr can offset ordinary (W-2) income if you actively participate and your MAGI is under $100k (phasing out to $0 by $150k); unused losses carry forward. On sale, claimed depreciation is recaptured at up to 25%, and gains may owe capital-gains tax (a 1031 exchange can defer both). Figures are a year-1 estimate at your 24.0% rate — not tax advice; consult a CPA.
Schools (NCES district)
- District
- Advance R-IV
- NCES district ID
- 2902880
- Math proficiency
- 46% ▲ 3.00%
- Reading proficiency
- 53% ▲ 3.00%
- Median HH income
- $37,982
- Composite
- 41.2/100
- National rank
- #3541
- State rank
- #55 of 324 in MO
Livability — Advance
- Score
- 63/100
- State rank
- #346
- US rank
- #15586
Category grades
Schools grade is shown separately in the Schools card above.
Census & demographics
- Census place
- Advance, MO
- Population (ZIP)
- 3,667
Population outlook (Stoddard County) Hauer SSP2
- Today (2025)
- 29,096 people
- By 2030
- 28,478 · -2.1%
- By 2040
- 27,073 · -7.0%
- By 2050
- 25,512 · -12.3%
- By 2075
- 21,740 · -25.3%
- By 2100
- 17,841 · -38.7%
Race, ethnicity, and origin ACS 2023
- Neighborhood character
- Predominantly White (96%)
- Race & ethnicity
- White 96% Two or more races 4%
- Common ancestry
- Iranian 2% Italian 1% Lithuanian 1%
- Foreign-born
- 0%
- Languages at home
- 99% English-only · Spanish 1%
Political lean MEDSL · Stoddard
- 2024 margin
- Solid R (+73.9) · D 12.8% · R 86.7%
- 2008→2024 swing
- -34.1pp toward R · 2008: -39.8pp · 2024: -73.9pp
- All cycles
- 2024: R+73.9 2020: R+72.0 2016: R+69.3 2012: R+49.3 2008: R+39.8
Not yet ingested
- Civics
- —
Market trends
- HPI YoY
- ▲ 56.06%
- Current HPI
- 225.37
- Rent YoY
- —
- Metro
- —
- State GDP YoY
- ▲ 1.84%
- F500 in state
- 20
Industry mix (Fortune 500 HQ in MO)
| Industry | F500 HQs | Revenue |
|---|---|---|
| Healthcare | 1 | $163B |
|
||
| Insurance | 1 | $21B |
|
||
| Industrial Technology | 1 | $17B |
|
||
| Retail | 1 | $16B |
|
||
| Industrial Distribution | 1 | $10B |
|
||
| Utilities | 1 | $9B |
|
||
Price history
-4.9% since first listed4 events — show timeline
- 2026-06-04 Price Changed $118,828 MARIS as Distributed by MLS Grid
- 2026-05-26 Price Changed $121,875 MARIS as Distributed by MLS Grid
- 2026-05-15 Listed $125,000 MARIS as Distributed by MLS Grid
- 2021-10-12 Sold (Public Records) — Public Records
Property tax history
+2.9%/yrLatest (2025): $683 · +8.9% YoY. Source: county tax records.
Cash-flow waterfall
monthlySold comps — $/sqft
last 12 mo · ≤1 miLoading sold comps…