 Duplex
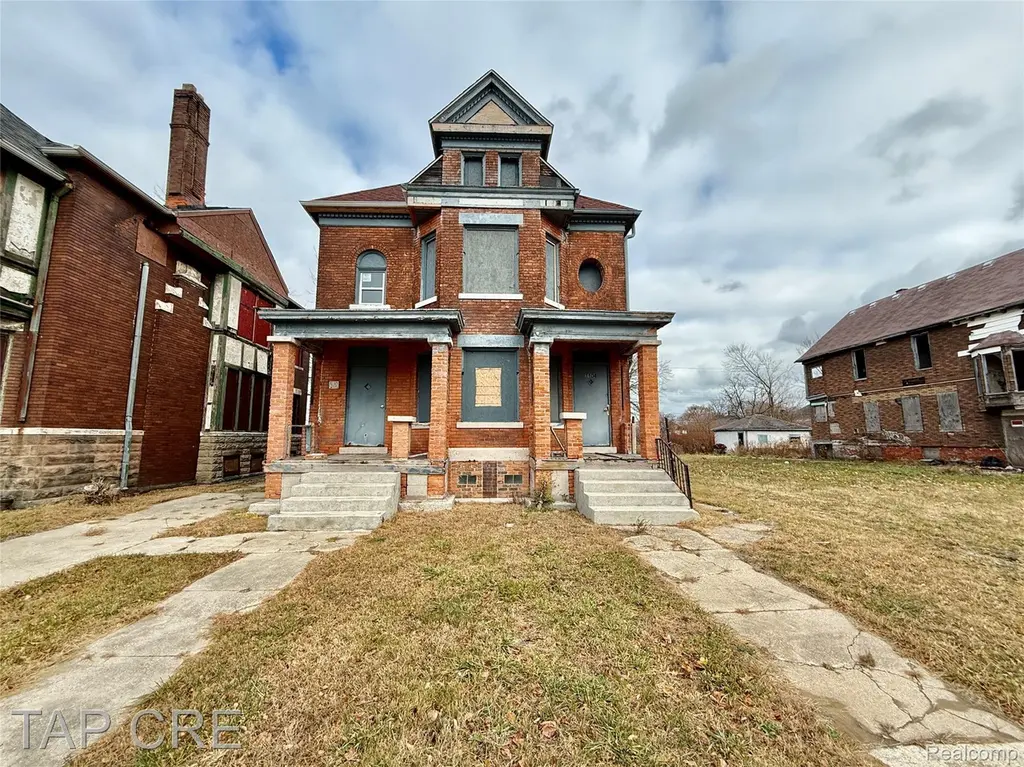
1104 E Grand Blvd · Detroit, MI
Flood risk 1/10 · Minimal
- FEMA flood zone
- X (unshaded)
- Chance of flooding over 30 yrs
- 0.0%
- Est. flood insurance / yr
- $473 – $860
Fire risk 1/10 · Minimal
- Est. fire insurance / yr
- $784 – $1,456
Heat risk 3/10 · Minor
- Hot days now (above 96°F)
- 7 days/yr
- Hot days in 30 yrs
- 14 days/yr
Wind risk 2/10 · Minimal
- Chance of severe wind over 30 yrs
- —
Air-quality risk 3/10 · Minor
- Unhealthy air days now
- 2 days/yr
- Unhealthy air days in 30 yrs
- 5 days/yr
Risk factors via First Street. Map © Google.
Why this score? — see what drove the B grade
The composite is a weighted blend of 9 inputs, each scored 0–100. Each bar is that input's sub-score; the figure is the points it added to the 100-point composite (weight × sub-score).
- Cash flow +30.0/30.0
- 1% rule +10.0/10.0
- DSCR +10.0/10.0
- ARV discount +7.5/15.0
- Livability +3.7/5.0
- Appreciation +3.6/10.0
- Rent growth +3.4/5.0
- Condition / age +2.5/5.0
- Schools +1.3/10.0
$140,000
🖨 Deal sheet (PDF) 📄 Offer letter ✓ Due diligence
Multi-family units
County records classify this as Multi-Family (2-4 Unit). Listing-text estimate: 2 units. confirmed
Listing remarks MLS
Vacant 2-family on Detroit's historic East Grand Boulevard - value-add opportunity in a corridor seeing real investment near Islandview, West Village, Belle Isle, and the East Riverfront. Solid 1908 brick duplex, approximately 3,174 SF across two units, each laid out for 2 bed / 1 bath / 1 kitchen. All interiors are undeveloped and ready for full build-out, giving an investor or owner-occupant a clean slate. Full unfinished basement adds storage or expansion capacity. Sits on a 6,011 SF lot (0.138 acres) with 43' x 139' parcel dimensions. Zoned R5 – Medium Density Residential, which keeps redevelopment options open. On-street parking, pitched roof, no HVAC installed, electrical condition to be verified by buyer. Surrounding blocks are seeing active residential and mixed-use redevelopment. Ideal for investors, developers, or buyers chasing a value-add multi-family project with upside. Sold as-is.
Key facts
- Zoned r5
- 6,098 sq ft lot
- Built 1908
Tags
Property features AI
Finance
- Other: Zoned for MultiFamily/Residential
Exterior
- Utilities: Public water; Public sewer
- Home design: Multi-family residential property; Residential income property
- Construction: Brick construction; Brick/mortar foundation; Built above grade finished area of 3,174
- Exterior features: Paved road access; Alley frontage; Pets allowed
Interior
- Bathrooms: Three full bathrooms; One half bathroom
- Heating & cooling: Forced air heating (natural gas); No central cooling
- Interior features: Unfinished basement
Neighborhood map
What this means for you Summary
Snapshot
- This is a 2 × 2-bed/1.8-bath units multifamily listed at $140k.
Deal economics
- At list price, monthly cash flow is $1k ($16k/yr) — positive. Per door: $649/mo.
- The deal already cash-flows at list — no discount required.
- Meets the 1% rule at list price ($3k rent vs $140k).
- Cap rate 17.4% vs local median 10.2% in Detroit — top-decile yield for the area; either an underpriced asset or a hidden risk that comps aren't pricing in. Stress-test before assuming the spread holds.
Location & tenants
- Location reads 73/100 on livability (#218 in MI) — a middle-class / working-renter tenant base. Strengths: amenities A+, commute A+, cost of living A+; Watch: schools F, crime F, employment F.
- Detroit Public Schools Community District (urban): math 10% / reading 24% proficiency, ranked #499 of 540 in MI (top 92%) — low school quality limits family demand, transient renter base, plan for 1-2y turnover; 90% free/reduced lunch — lower-income household profile, screen leases tightly.
- Market conditions: Rents rising (+3.5%/yr); 244 active listings in the ZIP; 2 comparable units currently listed for rent nearby; 2,639 units permitted in Wayne County in 2024 (1,216 in 5+ unit buildings).
- At $2,711/mo this rent would consume 68% of the median local household income ($48k/yr) (locally 2017% of renters already pay >50% of income on rent) — very limited rent-growth headroom before tenants either downsize or default.
Forward outlook
- Local home prices are declining (-2.8%/yr); year-one equity from $968 of loan paydown is wiped out by about $4k of value loss. Plan a longer hold.
- Wayne County population projected at -17% by 2050 — secular population decline; favor cash flow + early exit over multi-decade hold.
- At projected returns (-2.8% appreciation + 3.5% rent growth), your $39k cash investment doubles in ~3 years — after that, you're playing with house money.
Negotiation context
- Only 1 days on market — expect competitive offers; lowballing is unlikely to land.
- 4 sale attempts with the ask held roughly flat each time — persistent listings suggest the price (not the market) is what's stuck; bring a comps-based counter.
Risks & watch-outs
- Watch-outs: built in 1908 — expect roof / HVAC / electrical / plumbing capex.
Questions for the listing agent
- Can we see the unit-by-unit rent roll, current vacancy, and any below-market leases? What's the average tenancy length?
- What capital expenditures (roof, boiler, parking lot, exteriors) have been made in the last 5 years, and what's planned in the next 2?
- Built in 1908 — when were the roof, HVAC, electrical panel, plumbing, and water heater last replaced?
- Is there a deadline driving the sale (1031 exchange, divorce, estate, relocation)? That informs how much negotiation room exists.
- Schools are F-rated, which usually means shorter tenancies and higher turnover. Who's the typical renter profile here, and what's been the actual vacancy rate?
- Crime grade is F in this area — have there been break-ins, vandalism, or insurance claims at this property in the last 3 years? What carrier currently insures it and at what premium?
- What's the average days-on-market for RENTAL listings here right now (not sales)? A rising rental-DOM trend means longer vacancies and softer asking-rent achievability than the comps imply.
- What's the recent tenant-quality profile in this submarket — average credit score on applications, eviction rate, late-payment / NSF rate, and stable-employment percentage? A property-management company in the area should have these aggregated.
- How much new apartment / multifamily construction is in the pipeline within 1–3 miles? Heavy new supply (>2% of stock underway) typically softens rents 12–24 months out; light construction supports rent growth.
Investment metrics
- 1% rule
- 1.94% ✓
- Cap rate
- 17.42%
- Cash-on-cash
- 39.73%
- DSCR
- 2.77
- GRM
- 4.3
CMA / ARV
- ARV (median comp)
- $314,618
- List price
- $140,000
- Delta
- -49.14%
- Verdict
- UNDERPRICED
- Comps
- 11 within 2.0 mi
Show comp detail 2 sales within ~0.75 mi
| Address | Dist | Beds/Ba | Sqft | Sold | Price | $/sf | Match |
|---|---|---|---|---|---|---|---|
| 4613 Meldrum St | 0.46mi | 4/2.0 | 2,878 (-9%) | 1mo | $4,250 | $1 | 56 |
| 3631 Helen St | 0.58mi | 5/2.0 (+1) | 2,860 (-10%) | 16mo | $85,000 | $30 | 33 |
Match score weights: distance 35% · size 25% · config 20% · recency 20%. Top-matched comps best support the ARV.
Projected returns pro-forma
-2.79% appreciation · 3.53% rent growth · sell at horizon
- IRR
- 36.9%
- Equity multiple
- 2.60×
- Total profit
- $62,611
- Equity at exit
- $22,180
- IRR
- 43.6%
- Equity multiple
- 5.28×
- Total profit
- $167,885
- Equity at exit
- $14,358
Cash invested: $39,200 (down + closing). Projections, not guarantees.
Landlord ↔ Tenant lean methodology
- Overall (STATE)
- 62 Landlord-Friendly
- State Michigan
- 62 Landlord-Friendly · EVEN
- County
- — inherits STATE
- City
- — inherits STATE
ZIP-level market 48207
- Home prices YoY
- -2.0%
- Rents YoY
- 3.5%
- Active inventory
- 244
- Price-to-rent
- 8.6×
Monthly cashflow live
- Estimated rent
- $2,711 high interval (Pro) →
- Mortgage (P&I)
- −$734
- Tax from tax record
- −$51 /mo · $618/yr
- Insurance
- −$58
- HOA
- −$0
- Vacancy / Maint / Mgmt
- −$569
- Net cashflow
- $1,298
Break-even live
Sensitivity live
| Price | -10% $1,377 | -5% $1,337 | +0% $1,298 | +5% $1,258 | +10% $1,218 |
|---|---|---|---|---|---|
| Rent | -10% $1,084 | -5% $1,191 | +0% $1,298 | +5% $1,405 | +10% $1,512 |
| Rate | -1.0pp $1,368 | -0.5pp $1,333 | base $1,298 | +0.5pp $1,261 | +1.0pp $1,225 |
2-unit breakdown (identical units grouped — click to expand)
| Units | Beds | Baths | Est. rent |
|---|---|---|---|
| 2× units | 2 | 1.8 | $2,712 |
| #1 | 2 | 1.8 | $1,356 |
| #2 | 2 | 1.8 | $1,356 |
| Total (2 units) | $2,711 | ||
UW: 25.0% down · 7.5% · 30yr · 1.5% tax · 5.0% vac · 8.0% maint · 8.0% mgmt
Financing live
Cash to close
- Down payment
- $35,000
- Closing costs
- $4,200
- Reserves months
- —
- Total cash needed
- —
Loan-product check · same deal, 3 products live
Conventional
25% down · 7.5% · 30yr
- Down + closing
- —
- Monthly P&I
- —
- Monthly cashflow
- —
- DSCR
- —
- Eligible?
- —
Personal DTI + credit; lowest rate.
DSCR
20% down · 8.5% · 30yr
- Down + closing
- —
- Monthly P&I
- —
- Monthly cashflow
- —
- DSCR
- —
- Eligible?
- —
No personal income docs; deal must DSCR.
Hard money
10% down · 12.0% · 12mo
- Down + closing
- —
- Monthly P&I
- —
- Monthly cashflow
- —
- DSCR
- —
- Eligible?
- —
Short-term bridge; refi at stabilization.
Rent comps 2 comps
| Address | Beds | Baths | Sqft | Rent | $/sqft | DOM | Units | Dist |
|---|---|---|---|---|---|---|---|---|
| 3631 Helen St Unit 3635 Detroit, MI | 4.0 | 2.0 | 2157 | $1,650 | $0.76 | 44d | 1 | 0.55mi |
| 1738 Canton St Unit 1 Detroit, MI | 4.0 | 1.0 | 2244 | $1,650 | $0.74 | 44d | 1 | 1.37mi |
Listing history 3 events
-
2026-06-17pricedays on market $140,000 Active 1 DOM
Show marketing remark (929 chars)
Vacant 2-family on Detroit's historic East Grand Boulevard - value-add opportunity in a corridor seeing real investment near Islandview, West Village, Belle Isle, and the East Riverfront. Solid 1908 brick duplex, approximately 3,174 SF across two units, each laid out for 2 bed / 1 bath / 1 kitchen. All interiors are undeveloped and ready for full build-out, giving an investor or owner-occupant a clean slate. Full unfinished basement adds storage or expansion capacity. Sits on a 6,011 SF lot (0.138 acres) with 43' x 139' parcel dimensions. Zoned R5 – Medium Density Residential, which keeps redevelopment options open. On-street parking, pitched roof, no HVAC installed, electrical condition to be verified by buyer. Surrounding blocks are seeing active residential and mixed-use redevelopment. Ideal for investors, developers, or buyers chasing a value-add multi-family project with upside. Sold as-is.
-
2025-12-02$160,000 Active 1160-char remark
-
2025-12-02$160,000 Active 1163-char remark
ⓘ Source: listings_history table (triggers on properties + properties_extension) + one-shot
backfill from property_details.listing_events for pre-trigger history.
Tax reassessment forecast MI · Partial reset (capped growth)
- Current annual tax
- $618 · $51/mo
- Projected year-2 tax
- $1,387 · $116/mo
- Expected delta
- +$769/yr (+$64/mo · 124.6%)
ⓘ Screening estimate from a state-policy table — verify with the county assessor before closing.
Climate risk First Street
- Flood 1/10 Low FEMA zone X (unshaded) · 0% chance over 30 yrs
- Wildfire 1/10 Low
- Heat 3/10 Moderate 7 d/yr ≥96°F today · 14 d/yr by 30 yrs out
- Wind 2/10 Low
- Air quality 3/10 Moderate 2 unhealthy d/yr today · 5 by 30 yrs out
Nearby sold comps map
Loading sold comps map…
Walkable amenities ~0.75 mi
Loading nearby amenities…
Taxation est. · year 1
- Rental income
- $32,532
- − Mortgage interest
- −$7,842
- − Property taxes
- −$618
- − Insurance
- −$700
- − Repairs & maintenance
- −$2,603
- − Management
- −$2,603
- − Depreciation
- −$4,073
- Taxable income
- $14,094
- Est. tax owed @ 24.0%
- −$3,383
- After-tax cash flow
- $12,190/yr
For passive investors: Depreciation is non-cash, so a rental often shows a tax loss while cash-flowing — sheltering income. Rental losses are passive: they offset passive income freely, and up to $25,000/yr can offset ordinary (W-2) income if you actively participate and your MAGI is under $100k (phasing out to $0 by $150k); unused losses carry forward. On sale, claimed depreciation is recaptured at up to 25%, and gains may owe capital-gains tax (a 1031 exchange can defer both). Figures are a year-1 estimate at your 24.0% rate — not tax advice; consult a CPA.
Schools (NCES district)
- District
- Detroit Public Schools Community District
- NCES district ID
- 2601103
- Math proficiency
- 10% ▼ -2.00%
- Reading proficiency
- 24% ▲ 6.00%
- Median HH income
- $25,815
- Composite
- 13.06/100
- National rank
- #9564
- State rank
- #499 of 540 in MI
Livability — Detroit
- Score
- 73/100
- State rank
- #218
- US rank
- #5427
Category grades
Schools grade is shown separately in the Schools card above.
Census & demographics
- Census place
- Detroit, MI
- County
- Wayne County · 1,562,939 people
- City population
- 572,865
- Metro
- Detroit-Warren-Dearborn, MI
- Population (ZIP)
- 20,848
- Household income
- $47,831
- Rent vs Own
- Severe rent burden
- 2017.0
Population outlook (Wayne County) Hauer SSP2
- Today (2025)
- 1,675,273 people
- By 2030
- 1,620,300 · -3.3%
- By 2040
- 1,502,341 · -10.3%
- By 2050
- 1,384,039 · -17.4%
- By 2075
- 1,124,592 · -32.9%
- By 2100
- 881,193 · -47.4%
Race, ethnicity, and origin ACS 2023
- Neighborhood character
- Predominantly Black (74%)
- Race & ethnicity
- Black 74% White 18% Two or more races 4% Asian 3% Hispanic / Latino 2%
- Common ancestry
- Romanian 2% Italian 1% Lithuanian 1%
- Foreign-born
- 5% · Canada, South Korea
- Languages at home
- 94% English-only · Spanish 2% Other Indo-European 1% Arabic 1%
Political lean MEDSL · Wayne
- 2024 margin
- Strong D (+29.0) · D 62.7% · R 33.7% · Other 3.6%
- 2008→2024 swing
- -20.5pp toward R · 2008: 49.5pp · 2024: 29.0pp
- All cycles
- 2024: D+29.0 2020: D+38.1 2016: D+37.3 2012: D+46.9 2008: D+49.5
Not yet ingested
- Civics
- —
Market trends
- HPI YoY
- ▼ -2.79%
- Current HPI
- 136.6328
- Rent YoY
- ▲ 3.53%
- Metro
- Detroit-Warren-Dearborn, MI
- State GDP YoY
- ▲ 1.37%
- F500 in state
- 28
Industry mix (Fortune 500 HQ in MI)
| Industry | F500 HQs | Revenue |
|---|---|---|
| Automotive Parts | 3 | $48B |
|
||
| Automotive | 2 | $372B |
|
||
| Chemicals | 1 | $45B |
|
||
| Automotive Retail | 1 | $29B |
|
||
| Healthcare / Medical Devices | 1 | $23B |
|
||
| Automotive Technology | 1 | $20B |
|
||
Price history
-12.5% since first listed6 events — show timeline
- 2026-06-17 Listed $140,000 REALCOMP
- 2026-06-17 Listed $140,000 MiRealSource-MiMLS
- 2026-05-30 Listing Removed — MiRealSource-MiMLS
- 2026-05-30 Listing Removed — REALCOMP
- 2025-12-02 Listed $160,000 MiRealSource-MiMLS
- 2025-12-02 Listed $160,000 REALCOMP
Property tax history
-9.2%/yrLatest (2025): $618 · +1.3% YoY. Source: county tax records.
Cash-flow waterfall
monthlySold comps — $/sqft
last 12 mo · ≤1 miLoading sold comps…