6718 Bliss Trl · Houston, TX
Flood risk 1/10 · Minimal
- FEMA flood zone
- X (unshaded)
- Chance of flooding over 30 yrs
- 0.0%
- Est. flood insurance / yr
- $507 – $1,088
Fire risk 1/10 · Minimal
- Est. fire insurance / yr
- $1,222 – $2,270
Heat risk 9/10 · Severe
- Hot days now (above 110°F)
- 7 days/yr
- Hot days in 30 yrs
- 23 days/yr
Wind risk 9/10 · Severe
- Chance of severe wind over 30 yrs
- 99.0%
Air-quality risk 2/10 · Minimal
- Unhealthy air days now
- 2 days/yr
- Unhealthy air days in 30 yrs
- 2 days/yr
Risk factors via First Street. Map © Google.
Why this score? — see what drove the C+ grade
The composite is a weighted blend of 9 inputs, each scored 0–100. Each bar is that input's sub-score; the figure is the points it added to the 100-point composite (weight × sub-score).
- Cash flow +22.5/30.0
- 1% rule +9.2/10.0
- ARV discount +7.5/15.0
- DSCR +7.2/10.0
- Schools +4.4/10.0
- Appreciation +4.3/10.0
- Livability +3.7/5.0
- Condition / age +2.5/5.0
- Rent growth +1.8/5.0
$125,000
🖨 Deal sheet 📄 Offer letter ✓ Due diligence
Listing remarks
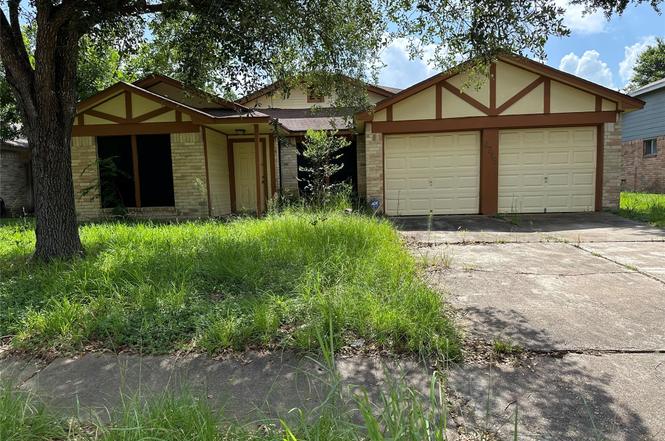
Calling all investors and visionaries-this Stone Creek gem is bursting with potential and ready for your personal touch! Unlock the potential of this 3-bedroom, 2-bathroom home located in the highly sought-after Stone Creek subdivision of Houston, Texas. Zoned to the top-rated Cypress-Fairbanks ISD, this property offers over 1,600 sqft of living space with endless possibilities-perfect for investors, DIY enthusiasts, or first-time homebuyers looking to personalize their space. Enjoy peace of mind with a whole house generator, ensuring uninterrupted power during any weather. The home's spacious layout provides flexibility to create a dream residence or a profitable rental property in a growi
Key facts
- Shopping
- Dining
- Major highways
Tags
Neighborhood map
What this means for you Summary
Snapshot
- This is a 3-bed/2.0-bath single-family listed at $125k.
Deal economics
- At list price, monthly cash flow is $210 ($3k/yr) — positive.
- The deal already cash-flows at list — no discount required.
- Meets the 1% rule at list price ($2k rent vs $125k).
- Cap rate 8.3% vs local median 3.2% in Houston — top-decile yield for the area; either an underpriced asset or a hidden risk that comps aren't pricing in. Stress-test before assuming the spread holds.
Location & tenants
- Location reads 74/100 on livability (#184 in TX, #4,771 nationally) — a middle-class / working-renter tenant base. Strengths: amenities A+, cost of living A+, housing A+; Watch: crime F.
- Cypress-Fairbanks ISD (suburban): math 45% / reading 52% proficiency, ranked #161 of 826 in TX (top 20%) — families likely to look elsewhere, expect single-tenant / working-renter base with shorter leases.
- Zoned schools: Kahla Middle (math 33% / reading 40%, grade F, #786 of 1,662 statewide, top 48%, 1,176 students, 82% FRL); Langham Creek H S (math 56% / reading 65%, grade C+, #268 of 1,632 statewide, top 17%, 2,781 students, 56% FRL) — zoned schools average 69% FRL vs 43% district-wide (26 pts higher); higher-poverty schools than district average — tighter screening recommended.
- Market conditions: Rents soft (-2.9%/yr); 494 active listings in the ZIP; 40 comparable units currently listed for rent nearby; rentals leasing fast (median 12d on market — plan ~1-2 weeks tenant-placement turnaround); solid renter incomes; 29,883 units permitted in Harris County in 2024 (8,621 in 5+ unit buildings).
Forward outlook
- Local home prices are declining (-1.4%/yr); year-one equity from $864 of loan paydown is wiped out by about $2k of value loss. Plan a longer hold.
- Harris County population projected at +47% by 2050 — long-run rental-demand tailwind backs the buy-and-hold thesis.
Negotiation context
- Only 6 days on market — expect competitive offers; lowballing is unlikely to land.
- Current owner paid $50k; list at $125k implies a 150% gain — meaningful room to come down on a strong offer.
Risks & watch-outs
- Watch-outs: property tax is 4.3% of price.
- Climate carrying-cost: severe wind risk, 99% chance of damaging wind over 30y; extreme-heat days projected 7→23/yr by 2055 (HVAC capex compounding) — expect insurance premiums to compound above CPI over the hold.
Questions for the listing agent
- Property tax is high relative to price — has the assessment been appealed recently, and will the sale trigger a re-assessment?
- What does the HOA fee cover, when was the last increase, and are there any pending special assessments or reserve-fund shortfalls?
- Is there a deadline driving the sale (1031 exchange, divorce, estate, relocation)? That informs how much negotiation room exists.
- Schools are D-rated, which usually means shorter tenancies and higher turnover. Who's the typical renter profile here, and what's been the actual vacancy rate?
- Crime grade is F in this area — have there been break-ins, vandalism, or insurance claims at this property in the last 3 years? What carrier currently insures it and at what premium?
- What's the average days-on-market for RENTAL listings here right now (not sales)? A rising rental-DOM trend means longer vacancies and softer asking-rent achievability than the comps imply.
- What's the recent tenant-quality profile in this submarket — average credit score on applications, eviction rate, late-payment / NSF rate, and stable-employment percentage? A property-management company in the area should have these aggregated.
- How much new for-sale + rental construction is in the pipeline within 1–3 miles? Heavy new supply typically softens prices + rents 12–24 months out; constrained supply supports both.
Investment metrics
- 1% rule
- 1.42% ✓
- Cap rate
- 8.30%
- Cash-on-cash
- 7.19%
- DSCR
- 1.32
- GRM
- 5.9
CMA / ARV
- ARV (on-the-fly)
- $255,672
- Comps found
- 12
Show comp detail 12 sales within ~0.75 mi
| Address | Dist | Beds/Ba | Sqft | Sold | Price | $/sf | Match |
|---|---|---|---|---|---|---|---|
| 16627 Live Oak Canyon Dr | 0.33mi | 3/2.0 | 1,655 (+3%) | 5mo | $280,000 | $169 | 76 |
| 6839 Catarina Cir | 0.20mi | 3/2.0 | 1,720 (+7%) | 6mo | $205,000 | $119 | 74 |
| 16714 Rockbend | 0.29mi | 3/2.0 | 1,707 (+6%) | 4mo | $230,000 | $135 | 73 |
| 6907 Renata Cir | 0.26mi | 3/2.0 | 1,457 (-9%) | 1mo | $243,000 | $167 | 71 |
| 7235 Sonnet Glen Ln | 0.67mi | 3/2.0 | 1,602 (-0%) | 1mo | $250,000 | $156 | 68 |
| 6503 Laughton Lane Ln | 0.47mi | 3/2.0 | 1,510 (-6%) | 2mo | $250,000 | $166 | 66 |
| 7254 Sonnet Glen Ln | 0.71mi | 3/2.0 | 1,602 (-0%) | 1mo | $240,000 | $150 | 65 |
| 17419 Lobo Trl | 0.56mi | 4/2.0 (+1) | 1,602 (-0%) | 4mo | $244,990 | $153 | 65 |
| 17218 Valemist Ct | 0.36mi | 3/2.0 | 1,396 (-13%) | 2mo | $229,900 | $165 | 60 |
| 17323 Lobo Trl | 0.49mi | 3/2.5 | 1,760 (+10%) | 1mo | $239,900 | $136 | 59 |
| 17002 Dew Drop Ln | 0.66mi | 3/2.0 | 1,381 (-14%) | 0mo | $220,000 | $159 | 46 |
| 17303 Fernchase Cir | 0.63mi | 3/2.0 | 1,842 (+15%) | 4mo | $315,000 | $171 | 43 |
Match score weights: distance 35% · size 25% · config 20% · recency 20%. Top-matched comps best support the ARV.
Projected returns pro-forma
-1.4% appreciation · 0.0% rent growth · sell at horizon
- IRR
- -2.3%
- Equity multiple
- 0.91×
- Total profit
- $-3,253
- Equity at exit
- $27,813
- IRR
- 1.1%
- Equity multiple
- 1.09×
- Total profit
- $3,128
- Equity at exit
- $27,238
Cash invested: $35,000 (down + closing). Projections, not guarantees.
Landlord ↔ Tenant lean methodology
- Overall (STATE)
- 87 Strongly Landlord-Friendly
- State Texas
- 87 Strongly Landlord-Friendly · R+5
- County
- — inherits STATE
- City
- — inherits STATE
ZIP-level market 77084
- Home prices YoY
- -0.6%
- Rents YoY
- -2.9%
- Active inventory
- 494
- Price-to-rent
- 5.9×
Monthly cashflow live
- Estimated rent
- $1,774 high interval (Pro) →
- Mortgage (P&I)
- −$656
- Tax from tax record
- −$446 /mo · $5,353/yr
- Insurance
- −$52
- HOA
- −$38
- Vacancy / Maint / Mgmt
- −$372
- Net cashflow
- $210
Break-even live
UW: 25.0% down · 7.5% · 30yr · 1.5% tax · 5.0% vac · 8.0% maint · 8.0% mgmt
Financing live
Cash to close
- Down payment
- $31,250
- Closing costs
- $3,750
- Reserves months
- —
- Total cash needed
- —
Loan-product check · same deal, 3 products live
Conventional
25% down · 7.5% · 30yr
- Down + closing
- —
- Monthly P&I
- —
- Monthly cashflow
- —
- DSCR
- —
- Eligible?
- —
Personal DTI + credit; lowest rate.
DSCR
20% down · 8.5% · 30yr
- Down + closing
- —
- Monthly P&I
- —
- Monthly cashflow
- —
- DSCR
- —
- Eligible?
- —
No personal income docs; deal must DSCR.
Hard money
10% down · 12.0% · 12mo
- Down + closing
- —
- Monthly P&I
- —
- Monthly cashflow
- —
- DSCR
- —
- Eligible?
- —
Short-term bridge; refi at stabilization.
Rent comps 40 comps
| Address | Beds | Baths | Sqft | Rent | $/sqft | DOM | Units | Dist |
|---|---|---|---|---|---|---|---|---|
| 6700 Queenston Blvd Unit 2162 Houston, TX | 2.0 | 2.0 | 1156 | $1,394 | $1.21 | 5d | 1 | 0.23mi |
| 6700 Queenston Blvd Unit 6737 Houston, TX | 2.0 | 2.0 | 1267 | $1,675 | $1.32 | 44d | 1 | 0.23mi |
| 6700 Queenston Blvd Unit 422 Houston, TX | 2.0 | 2.0 | 1156 | $1,394 | $1.21 | 7d | 1 | 0.23mi |
| 6700 Queenston Blvd Unit 2112 Houston, TX | 2.0 | 2.0 | 1156 | $1,386 | $1.20 | 3d | 1 | 0.23mi |
| 6700 Queenston Blvd Unit 2047 Houston, TX | 2.0 | 2.0 | 1156 | $1,429 | $1.24 | 11d | 1 | 0.23mi |
| 6700 Queenston Blvd Unit 6757 Houston, TX | 2.0 | 2.0 | 1156 | $1,418 | $1.23 | 10d | 1 | 0.23mi |
| 16811 Creek Trl Houston, TX | 3.0 | 2.0 | 1490 | $1,820 | $1.22 | 44d | 1 | 0.27mi |
| 17211 Pleasant Lily Ct Houston, TX | 4.0 | 2.0 | 1884 | $2,000 | $1.06 | 44d | 1 | 0.33mi |
| 16550 Bouldgreen St Houston, TX | 3.0 | 2.5 | 2237 | $2,386 | $1.07 | 44d | 1 | 0.33mi |
| 17169 Spencer Rd Houston, TX | 2.0 | 2.0 | 1092 | $1,790 | $1.64 | 12d | 1 | 0.39mi |
| 17039 Kemble Creek Dr Houston, TX | 3.0 | 3.0 | 2000 | $1,845 | $0.92 | 44d | 1 | 0.40mi |
| 17503 Nordway Dr Houston, TX | 3.0 | 2.0 | 1953 | $1,729 | $0.89 | 3d | 1 | 0.58mi |
| 17169 Farm to Market Road 529 Unit SNPS2 Houston, TX | 2.0 | 2.0 | 1092 | $1,790 | $1.64 | 44d | 1 | 0.58mi |
| 17019 Wilthorne Gardens Ct Houston, TX | 3.0 | 2.5 | 1826 | $1,900 | $1.04 | 44d | 1 | 0.59mi |
| 6395 Crossway Dr Houston, TX | 3.0 | 2.0 | 1200 | $1,750 | $1.46 | 2d | 1 | 0.60mi |
| 6777 Sommerall Dr Houston, TX | 1.0–3.0 | 1.0–2.0 | 1049 | $1,959 | $1.87 | 2d | 35 | 0.61mi |
| 5926 Clerkenwell Dr Houston, TX | 3.0 | 2.5 | 2119 | $2,000 | $0.94 | 44d | 1 | 0.72mi |
| 7207 Glenbank Way Houston, TX | 3.0 | 2.0 | 2084 | $2,100 | $1.01 | 44d | 1 | 0.72mi |
| 6013 Queenston Blvd Unit 510 Houston, TX | 3.0 | 2.0 | 1198 | $1,208 | $1.01 | 3d | 1 | 0.83mi |
| 6013 Queenston Blvd Unit 6046 Houston, TX | 3.0 | 2.0 | 1272 | $2,025 | $1.59 | 13d | 1 | 0.83mi |
| 6706 Honey Harvest Ln Houston, TX | 3.0 | 3.0 | 1873 | $2,049 | $1.09 | 44d | 1 | 0.85mi |
| 16222 Summer Dew Ln Houston, TX | 3.0 | 2.0 | 1402 | $1,750 | $1.25 | 13d | 1 | 0.87mi |
| 17719 Glenpatti Dr Houston, TX | 3.0 | 2.0 | 1402 | $1,669 | $1.19 | 7d | 1 | 0.90mi |
| 6356 Porterway Dr Houston, TX | 3.0 | 2.0 | 1144 | $1,531 | $1.34 | 24d | 1 | 0.92mi |
| 15910 Farm to Market Road 529 Houston, TX | 1.0–2.0 | 1.0–2.0 | 812 | $1,310 | $1.61 | 3d | 32 | 0.93mi |
| 15915 Kingfield Dr Houston, TX | 2.0 | 1.0–2.0 | 843 | $1,995 | $2.37 | 3d | 44 | 1.01mi |
| 6329 Porterway Dr Houston, TX | 3.0 | 2.0 | 1144 | $1,599 | $1.40 | 44d | 1 | 1.02mi |
| 6316 Porterway Dr Houston, TX | 3.0 | 2.0 | 1144 | $1,581 | $1.38 | 2d | 1 | 1.04mi |
| 17807 Northway Ct Houston, TX | 3.0 | 2.0 | 1144 | $1,700 | $1.49 | 44d | 1 | 1.11mi |
| 5703 Afton Ridge Ln Houston, TX | 4.0 | 2.5 | 2203 | $1,896 | $0.86 | 22d | 1 | 1.12mi |
| 18015 Autumn Hills Dr Katy, TX | 4.0 | 3.0 | 2163 | $2,050 | $0.95 | 44d | 1 | 1.16mi |
| 7202 Barker Cypress Rd Cypress, TX | 1.0–3.0 | 1.0–2.0 | 1129 | $1,829 | $1.62 | 1d | 36 | 1.17mi |
| 15909 Yorktown Crossing Pkwy Unit 1033 Houston, TX | 2.0 | 2.0 | 1144 | $1,427 | $1.25 | 44d | 1 | 1.24mi |
| 7711 Thorncreek Way Houston, TX | 4.0 | 2.5 | 2085 | $2,075 | $1.00 | 7d | 1 | 1.25mi |
| 15903 Yorktown Crossing Pkwy Houston, TX | 1.0–2.0 | 1.0–2.0 | 989 | $1,628 | $1.65 | 3d | 33 | 1.28mi |
| 15831 Yorktown Crossing Pkwy Unit 424 Houston, TX | 2.0 | 2.0 | 1050 | $1,780 | $1.70 | 5d | 1 | 1.35mi |
| 15831 Yorktown Crossing Pkwy Unit 2174 Houston, TX | 2.0 | 2.0 | 1050 | $1,815 | $1.73 | 12d | 1 | 1.35mi |
| 15831 Yorktown Crossing Pkwy Unit 3174 Houston, TX | 3.0 | 2.0 | 1487 | $2,309 | $1.55 | 10d | 1 | 1.35mi |
| 15831 Yorktown Crossing Pkwy Unit 422 Houston, TX | 2.0 | 2.0 | 1050 | $1,780 | $1.70 | 7d | 1 | 1.35mi |
| 15831 Yorktown Crossing Pkwy Unit 525 Houston, TX | 3.0 | 2.0 | 1487 | $2,277 | $1.53 | 3d | 1 | 1.35mi |
HOA detail
- Monthly dues
- $38 · $456/yr
Listing history 4 events
-
2025-08-06status Pending
-
2025-07-31$125,000 Active
-
1994-05-10soldstatus
-
1989-11-01soldstatus $50,000
ⓘ Source: listings_history table (triggers on properties + properties_extension) + one-shot
backfill from property_details.listing_events for pre-trigger history.
Tax reassessment forecast TX · Resets to sale price
- Current annual tax
- $5,353 · $446/mo
- Projected year-2 tax
- $5,353 · $446/mo
- Expected delta
- $0/yr ($0/mo · 0.0%)
ⓘ Screening estimate from a state-policy table — verify with the county assessor before closing.
Climate risk First Street
- Flood 1/10 Low FEMA zone X (unshaded) · 0% chance over 30 yrs
- Wildfire 1/10 Low
- Heat 9/10 Extreme 7 d/yr ≥110°F today · 23 d/yr by 30 yrs out
- Wind 9/10 Extreme 99% chance of damaging wind over 30 yrs
- Air quality 2/10 Low 2 unhealthy d/yr today · 2 by 30 yrs out
Nearby sold comps map
Loading sold comps map…
Walkable amenities ~0.75 mi
Loading nearby amenities…
Taxation est. · year 1
- Rental income
- $21,285
- − Mortgage interest
- −$7,002
- − Property taxes
- −$5,353
- − Insurance
- −$625
- − Repairs & maintenance
- −$1,703
- − Management
- −$1,703
- − HOA
- −$456
- − Depreciation
- −$3,636
- Taxable income
- $807
- Est. tax owed @ 24.0%
- −$194
- After-tax cash flow
- $2,321/yr
For passive investors: Depreciation is non-cash, so a rental often shows a tax loss while cash-flowing — sheltering income. Rental losses are passive: they offset passive income freely, and up to $25,000/yr can offset ordinary (W-2) income if you actively participate and your MAGI is under $100k (phasing out to $0 by $150k); unused losses carry forward. On sale, claimed depreciation is recaptured at up to 25%, and gains may owe capital-gains tax (a 1031 exchange can defer both). Figures are a year-1 estimate at your 24.0% rate — not tax advice; consult a CPA.
Schools (NCES district)
- District
- Cypress-Fairbanks ISD
- NCES district ID
- 4816110
- Math proficiency
- 45% ▼ -12.00%
- Reading proficiency
- 52% ▼ -2.00%
- Median HH income
- $72,025
- Composite
- 43.63/100
- National rank
- #2968
- State rank
- #161 of 826 in TX
Livability — Houston
- Score
- 74/100
- State rank
- #184
- US rank
- #4771
Category grades
Schools grade is shown separately in the Schools card above.
Census & demographics
- County
- Harris County · 4,702,590 people
- City population
- 3,226,434
- Metro
- Houston-The Woodlands-Sugar Land, TX
- Population (ZIP)
- 110,217
- Household income
- $80,575
- Rent vs Own
- Severe rent burden
- 3257.0
Population outlook (Harris County) Hauer SSP2
- Today (2025)
- 5,571,493 people
- By 2030
- 6,089,821 · +9.3%
- By 2040
- 7,142,806 · +28.2%
- By 2050
- 8,185,864 · +46.9%
- By 2075
- 10,574,329 · +89.8%
- By 2100
- 12,109,958 · +117.4%
Race, ethnicity, and origin ACS 2023
- Neighborhood character
- Diverse neighborhood (Simpson 0.69)
- Race & ethnicity
- Hispanic / Latino 48% Two or more races 22% White 22% Black 16% Asian 11% Native American 2%
- Hispanic origin (detail)
- Mexican 27% Cuban 2%
- Common ancestry
- Lithuanian 1% Romanian 1% Slovak 1%
- Foreign-born
- 32% · Canada, Vietnam, Jamaica
- Languages at home
- 48% English-only · Spanish 38% Other Indo-European 5% Vietnamese 3%
Political lean MEDSL · Harris
- 2024 margin
- Lean D (+5.5) · D 52.0% · R 46.4% · Other 1.6%
- 2008→2024 swing
- +3.9pp toward D · 2008: 1.6pp · 2024: 5.5pp
- All cycles
- 2024: D+5.5 2020: D+13.3 2016: D+12.4 2012: D+0.1 2008: D+1.6
Not yet ingested
- Civics
- —
Market trends
- HPI YoY
- ▼ -1.40%
- Current HPI
- 251.8474
- Rent YoY
- ▼ -2.89%
- Metro
- Houston-The Woodlands-Sugar Land, TX
- State GDP YoY
- ▲ 3.95%
- F500 in state
- 110
Industry mix (Fortune 500 HQ in TX)
| Industry | F500 HQs | Revenue |
|---|---|---|
| Energy | 16 | $1,198B |
|
||
| Technology | 5 | $198B |
|
||
| Engineering / Construction | 4 | $72B |
|
||
| Energy Services | 3 | $60B |
|
||
| Utilities | 3 | $41B |
|
||
| Healthcare | 2 | $330B |
|
||
Price history
+150.0% since first listed4 events — show timeline
- 2025-08-06 Pending — HARMLS
- 2025-07-31 Listed $125,000 HARMLS
- 1994-05-10 Sold (Public Records) — Public Records
- 1989-11-01 Sold (Public Records) $50,000 Public Records
Property tax history
+3.3%/yrLatest (2025): $5,353 · -0.9% YoY. Source: county tax records.
Cash-flow waterfall
monthlySold comps — $/sqft
last 12 mo · ≤1 miLoading sold comps…