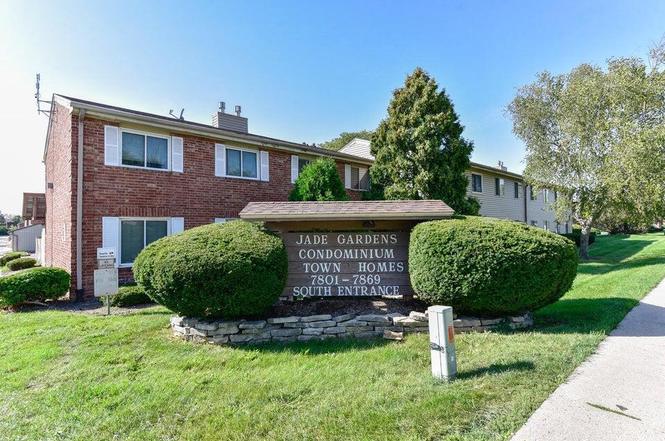
7801 N 60th St Unit E · Milwaukee, WI
Flood risk 7/10 · Major
- FEMA flood zone
- X (unshaded)
- Chance of flooding over 30 yrs
- 0.76%
- Est. flood insurance / yr
- $507 – $1,088
Fire risk 1/10 · Minimal
- Est. fire insurance / yr
- $636 – $1,182
Heat risk 2/10 · Minimal
- Hot days now (above 99°F)
- 7 days/yr
- Hot days in 30 yrs
- 13 days/yr
Wind risk 2/10 · Minimal
- Chance of severe wind over 30 yrs
- —
Air-quality risk 2/10 · Minimal
- Unhealthy air days now
- 1 days/yr
- Unhealthy air days in 30 yrs
- 2 days/yr
Risk factors via First Street. Map © Google.
Why this score? — see what drove the C grade
The composite is a weighted blend of 9 inputs, each scored 0–100. Each bar is that input's sub-score; the figure is the points it added to the 100-point composite (weight × sub-score).
- Cash flow +24.0/30.0
- 1% rule +9.5/10.0
- DSCR +7.7/10.0
- ARV discount +7.5/15.0
- Livability +4.0/5.0
- Rent growth +2.5/5.0
- Condition / age +2.5/5.0
- Schools +1.2/10.0
- Appreciation +0.0/10.0
$115,000
🖨 Deal sheet 📄 Offer letter ✓ Due diligence
Listing remarks
Jade Gardens awaits! This townhome style unit delivers the carefree condo lifestyle in a spacious 2 story package! Main level offers half bath and generously sized Living/Dining Room combo with built-in. Kitchen opens up to a large deck - great for morning coffee and sweet summer nights! Upstairs has all bedrooms including Primary Suite. Great closet space throughout plus full basement! Entertain at home or in the community clubhouse and spend hot Summer days lounging by the outdoor pool. This condo has loads of potential. Great sweat equity opportunity! Outdoor parking space included. Schedule your showing today!
Key facts
- Large deck
- Townhome style unit
- Half bath
Tags
Property features AI
Finance
- HOA & community: Condo fee: $340/month; Community amenities include clubhouse and outdoor pool
Exterior
- Parking: Assigned parking space (1 assigned space); 1-car garage
- Utilities: Municipal water; Municipal sewer; Natural gas available
- Home design: Condo unit in a 2-story building; Unit type: 2 story
- Construction: Condominium (Jade Gardens)
- Exterior features: Wood exterior
Interior
- Kitchen: Dishwasher; Oven/Range; Microwave; Refrigerator
- Bedrooms: Primary bedroom (Upper level) — approx. 12 x 14; Bedroom 2 (Upper level) — approx. 11 x 11; Bedroom 3 (Upper level) — approx. 11 x 11
- Bathrooms: Two full bathrooms; One half bathroom; Master bathroom with walk-in shower; Additional baths with tub and shower options; ceramic tile
- Heating & cooling: Forced air heating; Central air conditioning; Natural gas heat
- Interior features: Cable/satellite available; High-speed internet; Full basement
- Laundry & utility: Washer; Dryer
Neighborhood map
What this means for you Summary
Snapshot
- This is a 3-bed/2.5-bath condo listed at $115k.
Deal economics
- At list price, monthly cash flow is $159 ($2k/yr) — positive.
- The deal already cash-flows at list — no discount required.
- Meets the 1% rule at list price ($2k rent vs $115k).
- Cap rate 8.6% vs local median 5.1% in Milwaukee — top-decile yield for the area; either an underpriced asset or a hidden risk that comps aren't pricing in. Stress-test before assuming the spread holds.
Location & tenants
- Location reads 81/100 on livability (#55 in WI, #1,534 nationally) — a professional / high-income tenant draw. Strengths: amenities A+, commute A+, cost of living A+; Watch: employment D+, schools F, crime F.
- Milwaukee School District (urban): math 10% / reading 18% proficiency, ranked #337 of 342 in WI (top 98%) — low school quality limits family demand, transient renter base, plan for 1-2y turnover; 77% free/reduced lunch — lower-income household profile, screen leases tightly.
- Market conditions: 46 active listings in the ZIP; 10 comparable units currently listed for rent nearby; rentals leasing fast (median 10d on market — plan ~1-2 weeks tenant-placement turnaround); 1,017 units permitted in Milwaukee County in 2024 (803 in 5+ unit buildings).
- This rent runs 33% of the median local income ($61k/yr) — at the standard rent-burdened threshold; future hikes will face affordability resistance.
Forward outlook
- Local home prices are declining (-3.0%/yr); year-one equity from $795 of loan paydown is wiped out by about $3k of value loss. Plan a longer hold.
- Milwaukee County population projected at +4% by 2050 — modest demand growth; plan on rents tracking national, not racing it.
Negotiation context
- Only 7 days on market — expect competitive offers; lowballing is unlikely to land.
- Current owner paid $25k; list at $115k implies a 360% gain — meaningful room to come down on a strong offer.
Risks & watch-outs
- Watch-outs: flood insurance adds $66/mo; HOA is 20% of rent.
- Climate carrying-cost: major flood risk — expect insurance premiums to compound above CPI over the hold.
Questions for the listing agent
- Built in 1967 — when were the roof, HVAC, electrical panel, plumbing, and water heater last replaced?
- What's the actual annual flood-insurance premium (NFIP or private), and is the property in a SFHA with mandatory coverage?
- What does the HOA fee cover, when was the last increase, and are there any pending special assessments or reserve-fund shortfalls?
- Any open or pending special assessments — roof, HVAC, plumbing, elevator, façade? What's the per-unit balance and payoff schedule, and is the seller paying it off at close or rolling it to the buyer?
- Is there a deadline driving the sale (1031 exchange, divorce, estate, relocation)? That informs how much negotiation room exists.
- Schools are F-rated, which usually means shorter tenancies and higher turnover. Who's the typical renter profile here, and what's been the actual vacancy rate?
- Crime grade is F in this area — have there been break-ins, vandalism, or insurance claims at this property in the last 3 years? What carrier currently insures it and at what premium?
- What's the average days-on-market for RENTAL listings here right now (not sales)? A rising rental-DOM trend means longer vacancies and softer asking-rent achievability than the comps imply.
- What's the recent tenant-quality profile in this submarket — average credit score on applications, eviction rate, late-payment / NSF rate, and stable-employment percentage? A property-management company in the area should have these aggregated.
- How much new apartment / multifamily construction is in the pipeline within 1–3 miles? Heavy new supply (>2% of stock underway) typically softens rents 12–24 months out; light construction supports rent growth.
Investment metrics
- 1% rule
- 1.45% ✓
- Cap rate
- 8.64%
- Cash-on-cash
- 8.39%
- DSCR
- 1.37
- GRM
- 5.7
CMA / ARV
No comps found within radius.
Projected returns pro-forma
-3.0% appreciation · 3.0% rent growth · sell at horizon
- IRR
- -6.9%
- Equity multiple
- 0.74×
- Total profit
- $-8,286
- Equity at exit
- $17,147
- IRR
- 2.9%
- Equity multiple
- 1.21×
- Total profit
- $6,809
- Equity at exit
- $9,943
Cash invested: $32,200 (down + closing). Projections, not guarantees.
Landlord ↔ Tenant lean methodology
- Overall (STATE)
- 73 Landlord-Friendly
- State Wisconsin
- 73 Landlord-Friendly · R+2
- County
- — inherits STATE
- City
- — inherits STATE
ZIP-level market 53223
- Home prices YoY
- -27.7%
- Active inventory
- 46
- Price-to-rent
- 5.7×
Monthly cashflow live
- Estimated rent
- $1,673 high interval (Pro) →
- Mortgage (P&I)
- −$603
- Tax from tax record
- −$105 /mo · $1,265/yr
- Insurance
- −$48
- Flood insurance flood zone
- −$66 /mo · $798/yr
- HOA
- −$340
- Vacancy / Maint / Mgmt
- −$351
- Net cashflow
- $159
Break-even live
UW: 25.0% down · 7.5% · 30yr · 1.5% tax · 5.0% vac · 8.0% maint · 8.0% mgmt
Financing live
Cash to close
- Down payment
- $28,750
- Closing costs
- $3,450
- Reserves months
- —
- Total cash needed
- —
Loan-product check · same deal, 3 products live
Conventional
25% down · 7.5% · 30yr
- Down + closing
- —
- Monthly P&I
- —
- Monthly cashflow
- —
- DSCR
- —
- Eligible?
- —
Personal DTI + credit; lowest rate.
DSCR
20% down · 8.5% · 30yr
- Down + closing
- —
- Monthly P&I
- —
- Monthly cashflow
- —
- DSCR
- —
- Eligible?
- —
No personal income docs; deal must DSCR.
Hard money
10% down · 12.0% · 12mo
- Down + closing
- —
- Monthly P&I
- —
- Monthly cashflow
- —
- DSCR
- —
- Eligible?
- —
Short-term bridge; refi at stabilization.
Rent comps 10 comps
| Address | Beds | Baths | Sqft | Rent | $/sqft | DOM | Units | Dist |
|---|---|---|---|---|---|---|---|---|
| 6401 W Bradley Rd Milwaukee, WI | 1.0–3.0 | 1.0–2.5 | 882 | $1,750 | $1.98 | 1d | 2 | 0.25mi |
| 5005 W Bradley Rd Milwaukee, WI | 2.0 | 1.0 | 1064 | $1,299 | $1.22 | 14d | 2 | 0.73mi |
| 5005 W Bradley Rd Milwaukee, WI | 2.0 | 1.0 | 1149 | $1,299 | $1.13 | 43d | 1 | 0.73mi |
| 5829 W Helena St Milwaukee, WI | 3.0 | 2.0 | 1212 | $2,200 | $1.82 | 10d | 1 | 0.97mi |
| 7290 W Dean Rd Milwaukee, WI | 2.0 | 1.0–1.5 | 625 | $1,545 | $2.47 | 1d | 8 | 0.99mi |
| 5401 W Presidio Ln Milwaukee, WI | 2.0 | 2.0 | 1200 | $1,685 | $1.40 | 1d | 13 | 1.03mi |
| 7300 W Dean Rd Milwaukee, WI | 1.0–2.0 | 1.0–1.5 | 850 | $1,545 | $1.82 | 2d | 8 | 1.09mi |
| 6951 N 76th St Apt 112 Milwaukee, WI | 2.0 | 1.0 | 1025 | $1,100 | $1.07 | 23d | 1 | 1.41mi |
| 6762 N 52nd St Milwaukee, WI | 2.0 | 2.0 | 1309 | $1,500 | $1.15 | 14d | 1 | 1.44mi |
| 8901 N Park Plaza Ct Milwaukee, WI | 1.0–2.0 | 1.0–2.0 | 975 | $1,505 | $1.54 | 1d | 1 | 1.49mi |
HOA detail condo
- Monthly dues
- $340 · $4,080/yr
- Likely covers
- pool
- Assessments
- None detected in remarks — confirm with the listing agent.
Listing history 7 events
-
2026-06-18days on market $115,000 Active 7 DOM
-
2026-06-17days on market $115,000 Active 6 DOM
-
2026-06-16days on market $115,000 Active 5 DOM
-
2026-06-15days on market $115,000 Active 4 DOM
-
2026-06-13days on market $115,000 Active 2 DOM
-
2026-06-13remarks 621-char remark
-
2026-06-13$115,000 Active 1 DOM
ⓘ Source: listings_history table (triggers on properties + properties_extension) + one-shot
backfill from property_details.listing_events for pre-trigger history.
Tax reassessment forecast WI · Partial reset (capped growth)
- Current annual tax
- $1,265 · $105/mo
- Projected year-2 tax
- $1,696 · $141/mo
- Expected delta
- +$431/yr (+$36/mo · 34.1%)
ⓘ Screening estimate from a state-policy table — verify with the county assessor before closing.
Climate risk First Street
- Flood 7/10 Severe FEMA zone X (unshaded) · 76% chance over 30 yrs
- Wildfire 1/10 Low
- Heat 2/10 Low 7 d/yr ≥99°F today · 13 d/yr by 30 yrs out
- Wind 2/10 Low
- Air quality 2/10 Low 1 unhealthy d/yr today · 2 by 30 yrs out
Nearby sold comps map
Loading sold comps map…
Walkable amenities ~0.75 mi
Loading nearby amenities…
Taxation est. · year 1
- Rental income
- $20,072
- − Mortgage interest
- −$6,442
- − Property taxes
- −$1,265
- − Insurance
- −$1,372
- − Repairs & maintenance
- −$1,606
- − Management
- −$1,606
- − HOA
- −$4,080
- − Depreciation
- −$3,345
- Taxable income
- $356
- Est. tax owed @ 24.0%
- −$85
- After-tax cash flow
- $1,817/yr
For passive investors: Depreciation is non-cash, so a rental often shows a tax loss while cash-flowing — sheltering income. Rental losses are passive: they offset passive income freely, and up to $25,000/yr can offset ordinary (W-2) income if you actively participate and your MAGI is under $100k (phasing out to $0 by $150k); unused losses carry forward. On sale, claimed depreciation is recaptured at up to 25%, and gains may owe capital-gains tax (a 1031 exchange can defer both). Figures are a year-1 estimate at your 24.0% rate — not tax advice; consult a CPA.
Schools (NCES district)
- District
- Milwaukee School District
- NCES district ID
- 5509600
- Math proficiency
- 10% ▼ -5.00%
- Reading proficiency
- 18% ▬ 0.00%
- Median HH income
- $36,339
- Composite
- 11.61/100
- National rank
- #9696
- State rank
- #337 of 342 in WI
Livability — Milwaukee
- Score
- 81/100
- State rank
- #55
- US rank
- #1534
Category grades
Schools grade is shown separately in the Schools card above.
Census & demographics
- Census place
- Milwaukee, WI
- County
- Milwaukee County · 926,379 people
- City population
- 573,768
- Metro
- Milwaukee-Waukesha, WI
- Population (ZIP)
- 28,793
- Household income
- $60,839
- Rent vs Own
- Severe rent burden
- 1084.0
Population outlook (Milwaukee County) Hauer SSP2
- Today (2025)
- 995,758 people
- By 2030
- 1,009,124 · +1.3%
- By 2040
- 1,028,128 · +3.3%
- By 2050
- 1,040,066 · +4.4%
- By 2075
- 1,057,849 · +6.2%
- By 2100
- 1,039,774 · +4.4%
Race, ethnicity, and origin ACS 2023
- Neighborhood character
- Diverse neighborhood (Simpson 0.59)
- Race & ethnicity
- Black 57% White 29% Asian 6% Two or more races 5% Hispanic / Latino 4%
- Common ancestry
- Romanian 3% Portuguese 1% Lithuanian 1%
- Foreign-born
- 7% · Canada
- Languages at home
- 89% English-only · Other Asian/Pacific 4% Spanish 2% French/Haitian/Cajun 1%
Political lean MEDSL · Milwaukee
- 2024 margin
- Solid D (+38.5) · D 68.3% · R 29.8% · Other 1.8%
- 2008→2024 swing
- +2.7pp toward D · 2008: 35.9pp · 2024: 38.5pp
- All cycles
- 2024: D+38.5 2020: D+39.9 2016: D+37.5 2012: D+34.6 2008: D+35.9
Not yet ingested
- Civics
- —
Market trends
- HPI YoY
- ▼ -108.51%
- Current HPI
- 283.4147
- Rent YoY
- —
- Metro
- Milwaukee-Waukesha, WI
- State GDP YoY
- ▲ 2.10%
- F500 in state
- 20
Industry mix (Fortune 500 HQ in WI)
| Industry | F500 HQs | Revenue |
|---|---|---|
| Industrial Machinery | 4 | $23B |
|
||
| Industrial Technology | 2 | $36B |
|
||
| Insurance | 1 | $36B |
|
||
| Professional Services | 1 | $19B |
|
||
| Utilities | 1 | $9B |
|
||
| Consumer Goods | 1 | $3B |
|
||
Price history
+668.4% since first listed4 events — show timeline
- 2026-06-10 Listed $115,000 METROMLS
- 2021-06-23 Sold (Public Records) $50,000 Public Records
- 2021-06-23 Sold (Public Records) $25,000 Public Records
- 1982-12-01 Sold (Public Records) $14,966 Public Records
Property tax history
+2.0%/yrLatest (2024): $1,265 · +41.2% YoY. Source: county tax records.
Cash-flow waterfall
monthlySold comps — $/sqft
last 12 mo · ≤1 miLoading sold comps…