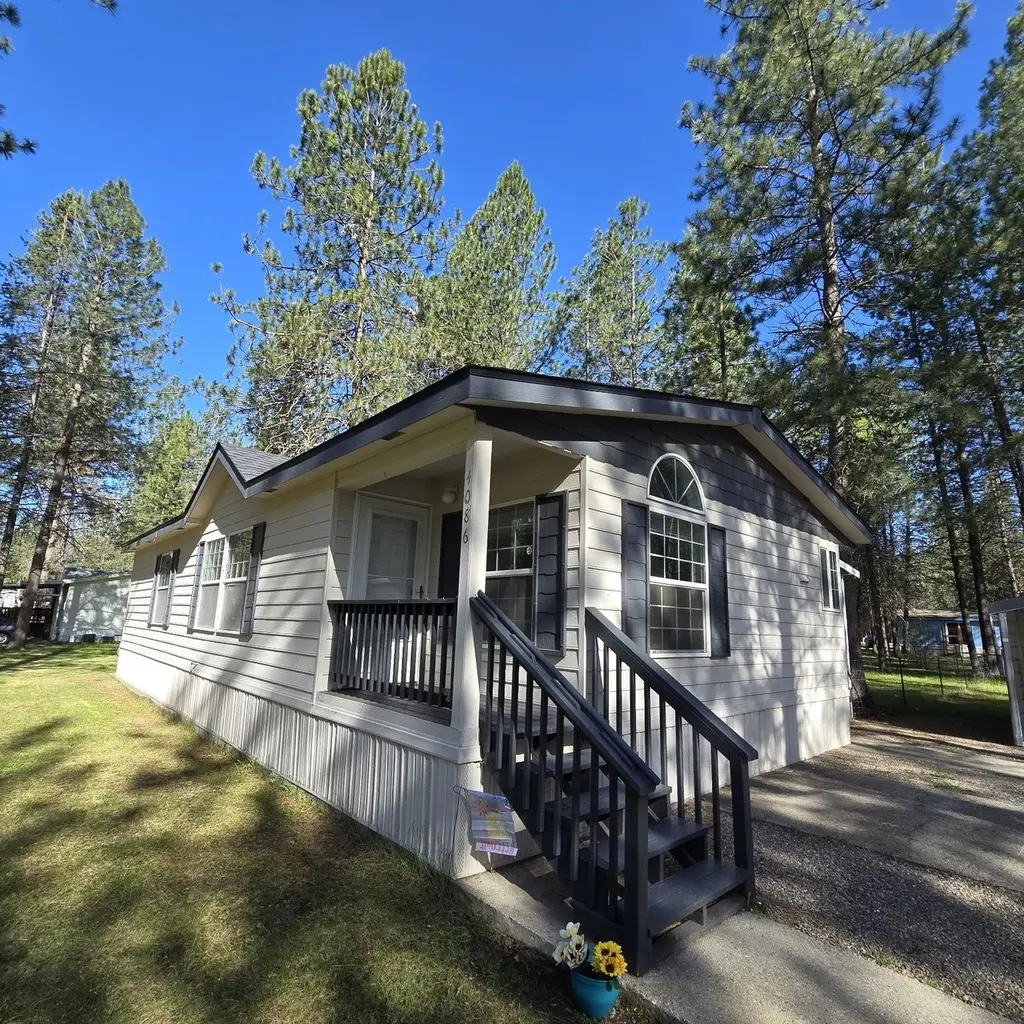
4086 Meadowlark Ln · Loon Lake, WA
Flood risk 1/10 · Minimal
- FEMA flood zone
- X
- Chance of flooding over 30 yrs
- 0.0%
- Est. flood insurance / yr
- $507 – $1,088
Fire risk 7/10 · Major
- Est. fire insurance / yr
- $604 – $1,122
Heat risk 2/10 · Minimal
- Hot days now (above 90°F)
- 7 days/yr
- Hot days in 30 yrs
- 16 days/yr
Wind risk 1/10 · Minimal
- Chance of severe wind over 30 yrs
- —
Air-quality risk 9/10 · Severe
- Unhealthy air days now
- 16 days/yr
- Unhealthy air days in 30 yrs
- 19 days/yr
Risk factors via First Street. Map © Google.
Why this score? — see what drove the B- grade
The composite is a weighted blend of 9 inputs, each scored 0–100. Each bar is that input's sub-score; the figure is the points it added to the 100-point composite (weight × sub-score).
- Cash flow +29.5/30.0
- DSCR +10.0/10.0
- 1% rule +8.3/10.0
- ARV discount +7.5/15.0
- Schools +3.5/10.0
- Livability +2.9/5.0
- Rent growth +2.5/5.0
- Condition / age +2.5/5.0
- Appreciation +0.0/10.0
$135,000
🖨 Deal sheet (PDF) 📄 Offer letter ✓ Due diligence
Listing remarks
Peace and tranquility define life in Loon Lake Acres, a welcoming 55+ manufactured home community designed for comfort, convenience, and connection. This well-maintained 1999 home features a brand-new roof installed in 2026 and sits on a generously sized, oversized lot—offering both space and privacy. Located just a scenic 30-minute drive from North Spokane’s Costco, this property delivers the perfect balance of peaceful living with easy access to everyday amenities. For those who have dreamed of lake life, the Loon Lake public boat launch is just minutes away—making it simple to enjoy boating, fishing, and waterfront relaxation whenever you choose. Loon Lake Acres is thou
Key facts
- Public boat launch
- Oversized lot
- New roof
Tags
Property features AI
Finance
- Other: Waterfront: see remarks
- HOA & community: Located in a senior community (Loon Lake Acres); Land lease: $575
Exterior
- Parking: 2-space carport; Off-site parking available
- Utilities: Gravel and city street frontage
- Home design: Manufactured home (Redman); Residential property; Skirted foundation
- Construction: Fiber cement exterior; Composition roof
- Exterior features: Deck; Fenced yard with cross-fencing; Treed and secluded setting; Level, open and oversized lot; Views
Interior
- Kitchen: Free-standing range; Dishwasher
- Bedrooms: 3 bedrooms
- Heating & cooling: Forced air heating
- Interior features: Smart thermostat; Skylights; Utility room
- Laundry & utility: Washer; Dryer
Neighborhood map
What this means for you Summary
Snapshot
- This is a 3-bed/2.0-bath manufactured listed at $135k.
Deal economics
- At list price, monthly cash flow is $482 ($6k/yr) — positive.
- The deal already cash-flows at list — no discount required.
- Meets the 1% rule at list price ($2k rent vs $135k).
- Recommended offer: $131k (3.0% below list) — sets the bar for market timing.
- Cap rate 10.6% vs local median 1.8% in Loon Lake — top-decile yield for the area; either an underpriced asset or a hidden risk that comps aren't pricing in. Stress-test before assuming the spread holds.
Location & tenants
- Location reads 58/100 on livability (#514 in WA) — a working-class tenant base; expect higher turnover. Strengths: housing A+; Watch: crime D+, amenities F, commute F.
- Loon Lake School District (rural): math 30% / reading 45% proficiency, ranked #234 of 291 in WA (top 80%) — families likely to look elsewhere, expect single-tenant / working-renter base with shorter leases.
- Zoned schools: Loon Lake Homelink Program (103 students, 46% FRL) — zoned schools average 46% FRL vs 30% district-wide (16 pts higher); higher-poverty schools than district average — tighter screening recommended.
- Market conditions: 66 active listings in the ZIP; 341 units permitted in Stevens County in 2024 (72 in 5+ unit buildings).
Forward outlook
- Local home prices are declining (-3.0%/yr); year-one equity from $933 of loan paydown is wiped out by about $4k of value loss. Plan a longer hold.
- Stevens County population projected at -12% by 2050 — secular population decline; favor cash flow + early exit over multi-decade hold.
- At projected returns (-3.0% appreciation + 3.0% rent growth), your $38k cash investment doubles in ~8 years — after that, you're playing with house money.
Negotiation context
- It's been on market 49 days — a 3% lower offer ($131k) is reasonable based on typical stale-listing flexibility.
- 2 sale attempts; this cycle's ask has dropped $10k (7%) from the opening price — seller is motivated, your offer sets the floor, not the list.
Risks & watch-outs
- Climate carrying-cost: major wildfire risk — expect insurance premiums to compound above CPI over the hold.
Questions for the listing agent
- It's been on market 49 days. Have you received any prior offers? Is the seller open to a 3% concession, seller financing, or rate buy-down credit?
- Is there a deadline driving the sale (1031 exchange, divorce, estate, relocation)? That informs how much negotiation room exists.
- Schools are D-rated, which usually means shorter tenancies and higher turnover. Who's the typical renter profile here, and what's been the actual vacancy rate?
- Crime grade is D in this area — have there been break-ins, vandalism, or insurance claims at this property in the last 3 years? What carrier currently insures it and at what premium?
- What's the average days-on-market for RENTAL listings here right now (not sales)? A rising rental-DOM trend means longer vacancies and softer asking-rent achievability than the comps imply.
- What's the recent tenant-quality profile in this submarket — average credit score on applications, eviction rate, late-payment / NSF rate, and stable-employment percentage? A property-management company in the area should have these aggregated.
- How much new for-sale + rental construction is in the pipeline within 1–3 miles? Heavy new supply typically softens prices + rents 12–24 months out; constrained supply supports both.
Investment metrics
- 1% rule
- 1.33% ✓
- Cap rate
- 10.58%
- Cash-on-cash
- 15.30%
- DSCR
- 1.68
- GRM
- 6.3
CMA / ARV
- ARV (median comp)
- $346,405
- List price
- $135,000
- Delta
- -61.03%
- Verdict
- UNDERPRICED
- Comps
- 5 within 1.0 mi
Show comp detail 5 sales within ~0.75 mi
| Address | Dist | Beds/Ba | Sqft | Sold | Price | $/sf | Match |
|---|---|---|---|---|---|---|---|
| 4079 Bluebird Dr | 0.04mi | 3/2.0 | 1,458 (+0%) | 12mo | $203,000 | $139 | 88 |
| 4081 Lacey Ln | 0.22mi | 3/2.0 | 1,400 (-4%) | 9mo | $345,000 | $246 | 76 |
| 4085 Bluebird Dr | 0.06mi | 3/2.0 | 1,620 (+11%) | 9mo | $211,000 | $130 | 71 |
| 3833 Meadowlark Way | 0.46mi | 3/2.0 | 1,512 (+4%) | 2mo | $465,000 | $308 | 71 |
| 4098 Meadowlark Ln | 0.07mi | 3/2.0 | 1,362 (-6%) | 21mo | $195,000 | $143 | 68 |
Match score weights: distance 35% · size 25% · config 20% · recency 20%. Top-matched comps best support the ARV.
Projected returns pro-forma
-3.0% appreciation · 3.0% rent growth · sell at horizon
- IRR
- 6.0%
- Equity multiple
- 1.23×
- Total profit
- $8,837
- Equity at exit
- $20,129
- IRR
- 15.4%
- Equity multiple
- 2.25×
- Total profit
- $47,317
- Equity at exit
- $11,672
Cash invested: $37,800 (down + closing). Projections, not guarantees.
Landlord ↔ Tenant lean methodology
- Overall (STATE)
- 28 Tenant-Leaning
- State Washington
- 28 Tenant-Leaning · D+8
- County
- — inherits STATE
- City
- — inherits STATE
ZIP-level market 99148
- Home prices YoY
- -29.0%
- Active inventory
- 66
- Price-to-rent
- 6.3×
Monthly cashflow live
- Estimated rent
- $1,791 medium interval (Pro) →
- Mortgage (P&I)
- −$708
- Tax est. 1.5%
- −$169 /mo · $2,025/yr
- Insurance
- −$56
- HOA
- −$0
- Vacancy / Maint / Mgmt
- −$376
- Net cashflow
- $482
Break-even live
Sensitivity live
| Price | -10% $575 | -5% $528 | +0% $482 | +5% $435 | +10% $388 |
|---|---|---|---|---|---|
| Rent | -10% $340 | -5% $411 | +0% $482 | +5% $553 | +10% $623 |
| Rate | -1.0pp $550 | -0.5pp $516 | base $482 | +0.5pp $447 | +1.0pp $411 |
UW: 25.0% down · 7.5% · 30yr · 1.5% tax · 5.0% vac · 8.0% maint · 8.0% mgmt
Financing live
Cash to close
- Down payment
- $33,750
- Closing costs
- $4,050
- Reserves months
- —
- Total cash needed
- —
Loan-product check · same deal, 3 products live
Conventional
25% down · 7.5% · 30yr
- Down + closing
- —
- Monthly P&I
- —
- Monthly cashflow
- —
- DSCR
- —
- Eligible?
- —
Personal DTI + credit; lowest rate.
DSCR
20% down · 8.5% · 30yr
- Down + closing
- —
- Monthly P&I
- —
- Monthly cashflow
- —
- DSCR
- —
- Eligible?
- —
No personal income docs; deal must DSCR.
Hard money
10% down · 12.0% · 12mo
- Down + closing
- —
- Monthly P&I
- —
- Monthly cashflow
- —
- DSCR
- —
- Eligible?
- —
Short-term bridge; refi at stabilization.
Listing history 20 events
-
2026-06-18days on market $135,000 Active 49 DOM
-
2026-06-17days on market $135,000 Active 48 DOM
-
2026-06-16days on market $135,000 Active 47 DOM
-
2026-06-15days on market $135,000 Active 46 DOM
-
2026-06-14days on market $135,000 Active 44 DOM
-
2026-06-13days on market $135,000 Active 43 DOM
-
2026-06-10days on market $135,000 Active 41 DOM
-
2026-06-09days on market $135,000 Active 40 DOM
-
2026-06-08days on market $135,000 Active 39 DOM
-
2026-06-07days on market $135,000 Active 38 DOM
-
2026-06-03days on market $135,000 Active 34 DOM
-
2026-06-02days on market $135,000 Active 33 DOM
-
2026-06-01pricedays on market $135,000 Active 32 DOM
-
2026-05-31days on market $145,000 Active 31 DOM
-
2026-05-31days on market $145,000 Active 30 DOM
-
2026-04-30$145,000 Active 992-char remark
-
2026-03-19historical
-
2026-01-11price $149,500
-
2025-12-18price $154,999
-
2025-11-20$169,999 Active
ⓘ Source: listings_history table (triggers on properties + properties_extension) + one-shot
backfill from property_details.listing_events for pre-trigger history.
Climate risk First Street
- Flood 1/10 Low FEMA zone X · 0% chance over 30 yrs
- Wildfire 7/10 Severe
- Heat 2/10 Low 7 d/yr ≥90°F today · 16 d/yr by 30 yrs out
- Wind 1/10 Low
- Air quality 9/10 Extreme 16 unhealthy d/yr today · 19 by 30 yrs out
Nearby sold comps map
Loading sold comps map…
Walkable amenities ~0.75 mi
Loading nearby amenities…
Taxation est. · year 1
- Rental income
- $21,490
- − Mortgage interest
- −$7,562
- − Property taxes
- −$2,025
- − Insurance
- −$675
- − Repairs & maintenance
- −$1,719
- − Management
- −$1,719
- − Depreciation
- −$3,927
- Taxable income
- $3,862
- Est. tax owed @ 24.0%
- −$927
- After-tax cash flow
- $4,855/yr
For passive investors: Depreciation is non-cash, so a rental often shows a tax loss while cash-flowing — sheltering income. Rental losses are passive: they offset passive income freely, and up to $25,000/yr can offset ordinary (W-2) income if you actively participate and your MAGI is under $100k (phasing out to $0 by $150k); unused losses carry forward. On sale, claimed depreciation is recaptured at up to 25%, and gains may owe capital-gains tax (a 1031 exchange can defer both). Figures are a year-1 estimate at your 24.0% rate — not tax advice; consult a CPA.
Schools (NCES district)
- District
- Loon Lake School District
- NCES district ID
- 5304500
- Math proficiency
- 30% ▲ 5.00%
- Reading proficiency
- 45% ▲ 5.00%
- Median HH income
- $47,184
- Composite
- 34.65/100
- National rank
- #10072
- State rank
- #234 of 291 in WA
Livability — Loon Lake
- Score
- 58/100
- State rank
- #514
- US rank
- #21206
Category grades
Schools grade is shown separately in the Schools card above.
Census & demographics
- Census place
- Loon Lake, WA
- Population (ZIP)
- 2,381
Population outlook (Stevens County) Hauer SSP2
- Today (2025)
- 43,696 people
- By 2030
- 43,203 · -1.1%
- By 2040
- 41,190 · -5.7%
- By 2050
- 38,231 · -12.5%
- By 2075
- 31,260 · -28.5%
- By 2100
- 22,931 · -47.5%
Race, ethnicity, and origin ACS 2023
- Neighborhood character
- Predominantly White (87%)
- Race & ethnicity
- White 87% Two or more races 9% Hispanic / Latino 3% Native American 1%
- Common ancestry
- Italian 8% Portuguese 6% Slovak 3%
- Foreign-born
- 1%
- Languages at home
- 97% English-only · Spanish 2% Other Indo-European 1%
Political lean MEDSL · Stevens
- 2024 margin
- Solid R (+44.1) · D 26.7% · R 70.8% · Other 2.5%
- 2008→2024 swing
- -23.4pp toward R · 2008: -20.7pp · 2024: -44.1pp
- All cycles
- 2024: R+44.1 2020: R+42.1 2016: R+40.8 2012: R+27.7 2008: R+20.7
Not yet ingested
- Civics
- —
Market trends
- HPI YoY
- ▼ -122.85%
- Current HPI
- 301.1876
- Rent YoY
- —
- Metro
- —
- State GDP YoY
- ▲ 4.65%
- F500 in state
- 22
Industry mix (Fortune 500 HQ in WA)
| Industry | F500 HQs | Revenue |
|---|---|---|
| Retail | 2 | $269B |
|
||
| Technology / Retail | 1 | $638B |
|
||
| Technology | 1 | $245B |
|
||
| Telecommunications | 1 | $38B |
|
||
| Food / Beverage | 1 | $36B |
|
||
| Automotive / Trucks | 1 | $34B |
|
||
Price history
-20.6% since first listed6 events — show timeline
- 2026-06-01 Price Changed $135,000 SPOKANEMLS as Distributed by MLS Grid
- 2026-04-30 Listed $145,000 SPOKANEMLS as Distributed by MLS Grid
- 2026-03-19 Listing Removed — SPOKANEMLS as Distributed by MLS Grid
- 2026-01-11 Price Changed $149,500 SPOKANEMLS as Distributed by MLS Grid
- 2025-12-18 Price Changed $154,999 SPOKANEMLS as Distributed by MLS Grid
- 2025-11-20 Listed $169,999 SPOKANEMLS as Distributed by MLS Grid
Property tax history
-7.5%/yrLatest (2024): $270 · -7.9% YoY. Source: county tax records.
Cash-flow waterfall
monthlySold comps — $/sqft
last 12 mo · ≤1 miLoading sold comps…