 🏗️ New Construction
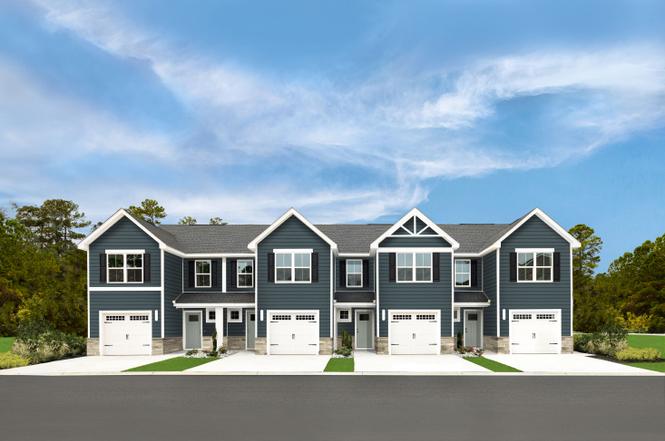
Poplar Plan · Fountain Inn, SC
Flood risk No data
- FEMA flood zone
- —
- Chance of flooding over 30 yrs
- —
- Est. flood insurance / yr
- —
Fire risk No data
- Est. fire insurance / yr
- —
Heat risk No data
- Hot days now (above threshold)
- —
- Hot days in 30 yrs
- —
Wind risk No data
- Chance of severe wind over 30 yrs
- —
Air-quality risk No data
- Unhealthy air days now
- —
- Unhealthy air days in 30 yrs
- —
Risk factors via First Street. Map © Google.
Why this score? — see what drove the D grade
The composite is a weighted blend of 9 inputs, each scored 0–100. Each bar is that input's sub-score; the figure is the points it added to the 100-point composite (weight × sub-score).
- Cash flow +12.6/30.0
- ARV discount +7.5/15.0
- Schools +4.2/10.0
- Livability +4.1/5.0
- DSCR +3.7/10.0
- 1% rule +3.6/10.0
- Rent growth +3.6/5.0
- Condition / age +2.5/5.0
- Appreciation +0.0/10.0
$219,990
🖨 Deal sheet (PDF) 📄 Offer letter ✓ Due diligence
Listing remarks
Welcome to Canterbrook Farms Townhomes by Ryan Homes. Here you can own a new townhome for less than rent in Fountain Inn with premier amenities and all appliances included. The Poplar Enter the foyer from the covered porch or garage - the perfect location for a drop zone. The wide-open great room flows seamlessly into the kitchen and dining area, where the island provides extra storage and counter space. Upstairs you'll find two secondary bedrooms and a full bath; continue past the second-floor laundry toward the owners suite. This private retreat includes a dual vanity bath and walk-in closet. Don't let The Poplar pass you by - Schedule Your Visit today!
Key facts
- Covered porch
- Welcoming foyer
- Gourmet kitchen
Tags
Property features AI
Finance
- Financial info: List price $224,990
Exterior
- Home design: New construction plan; Single-family residential (Poplar plan)
- Exterior features: Living area approximately 1442
Interior
- Bedrooms: 3 bedrooms
- Bathrooms: 2 full bathrooms, 1 half bathroom (2.5 total)
- Heating & cooling: Central air conditioning
- Interior features: Plan name: Poplar
Neighborhood map
What this means for you Summary
Snapshot
- This is a 3-bed/2.5-bath townhouse listed at $220k.
Deal economics
- At list price, monthly cash flow is $-29 ($-354/yr) — negative.
- To cash-flow at today's rent, offer at most $216k (1.9% below list).
- To meet the 1% rule (rent ≥ 1% of price), the offer needs to be $189k (14.2% below list).
- Recommended offer: $189k (14.2% below list) — sets the bar for 1% rule.
- Cap rate 6.1% vs local median 4.2% in Fountain Inn — top-decile yield for the area; either an underpriced asset or a hidden risk that comps aren't pricing in. Stress-test before assuming the spread holds.
Location & tenants
- Location reads 82/100 on livability (#4 in SC, #1,162 nationally) — a professional / high-income tenant draw. Strengths: crime A+, cost of living A+, housing A+; Watch: commute F.
- Greenville 01 (suburban): math 44% / reading 54% proficiency, ranked #10 of 80 in SC (top 12%) — families likely to look elsewhere, expect single-tenant / working-renter base with shorter leases.
- Market conditions: Rents rising fast (+4.5%/yr); 481 active listings in the ZIP; 1 comparable units currently listed for rent nearby; 621 units permitted in Laurens County in 2024 (0 in 5+ unit buildings).
- This rent runs 32% of the median local income ($70k/yr) — at the standard rent-burdened threshold; future hikes will face affordability resistance.
Forward outlook
- Local home prices are declining (-3.0%/yr); year-one equity from $2k of loan paydown is wiped out by about $7k of value loss. Plan a longer hold.
- Laurens County population projected to shrink 7% by 2050 — rents likely to lag national; underwrite the cash flow, not the appreciation.
Negotiation context
- It's been on market 394 days — a 12% lower offer ($194k) is reasonable based on typical stale-listing flexibility.
Questions for the listing agent
- What do current leases actually rent for vs. the listed asking? Can we see a recent rent roll and the last 12 months of T-12 income?
- It's been on market 394 days. Have you received any prior offers? Is the seller open to a 14% concession, seller financing, or rate buy-down credit?
- Why hasn't it sold? Are there any deal-killer items the seller is aware of (foundation, flood, title, zoning, code violations)?
- Is there a deadline driving the sale (1031 exchange, divorce, estate, relocation)? That informs how much negotiation room exists.
- The area grade is low — what's the realistic commute time and amenity access for the typical tenant pool here? Any planned neighborhood developments (good or bad) we should know about?
- What's the average days-on-market for RENTAL listings here right now (not sales)? A rising rental-DOM trend means longer vacancies and softer asking-rent achievability than the comps imply.
- What's the recent tenant-quality profile in this submarket — average credit score on applications, eviction rate, late-payment / NSF rate, and stable-employment percentage? A property-management company in the area should have these aggregated.
- How much new for-sale + rental construction is in the pipeline within 1–3 miles? Heavy new supply typically softens prices + rents 12–24 months out; constrained supply supports both.
Investment metrics
- 1% rule
- 0.86% ✗
- Cap rate
- 6.13%
- Cash-on-cash
- -0.57%
- DSCR
- 0.97
- GRM
- 9.7
CMA / ARV
No comps found within radius.
Projected returns pro-forma
-3.0% appreciation · 4.55% rent growth · sell at horizon
- IRR
- -15.5%
- Equity multiple
- 0.44×
- Total profit
- $-34,509
- Equity at exit
- $32,801
- IRR
- -4.6%
- Equity multiple
- 0.68×
- Total profit
- $-19,695
- Equity at exit
- $19,021
Cash invested: $61,597 (down + closing). Projections, not guarantees.
Landlord ↔ Tenant lean methodology
- Overall (STATE)
- 90 Strongly Landlord-Friendly
- State South Carolina
- 90 Strongly Landlord-Friendly · R+6
- County
- — inherits STATE
- City
- — inherits STATE
ZIP-level market 29644
- Home prices YoY
- -28.6%
- Rents YoY
- 4.5%
- Active inventory
- 481
- Price-to-rent
- 9.7×
Monthly cashflow live
- Estimated rent
- $1,887 medium interval (Pro) →
- Mortgage (P&I)
- −$1,154
- Tax est. 1.5%
- −$275 /mo · $3,300/yr
- Insurance
- −$92
- HOA
- −$0
- Lot rent
- −$0
- Vacancy / Maint / Mgmt
- −$396
- Net cashflow
- $-29
Break-even live
Sensitivity live
| Price | -10% $123 | -5% $47 | +0% $-29 | +5% $-105 | +10% $-182 |
|---|---|---|---|---|---|
| Rent | -10% $-179 | -5% $-104 | +0% $-29 | +5% $45 | +10% $120 |
| Rate | -1.0pp $81 | -0.5pp $26 | base $-29 | +0.5pp $-86 | +1.0pp $-144 |
UW: 25.0% down · 7.5% · 30yr · 1.5% tax · 5.0% vac · 8.0% maint · 8.0% mgmt
Financing live
Cash to close
- Down payment
- $54,998
- Closing costs
- $6,600
- Reserves months
- —
- Total cash needed
- —
Loan-product check · same deal, 3 products live
Conventional
25% down · 7.5% · 30yr
- Down + closing
- —
- Monthly P&I
- —
- Monthly cashflow
- —
- DSCR
- —
- Eligible?
- —
Personal DTI + credit; lowest rate.
DSCR
20% down · 8.5% · 30yr
- Down + closing
- —
- Monthly P&I
- —
- Monthly cashflow
- —
- DSCR
- —
- Eligible?
- —
No personal income docs; deal must DSCR.
Hard money
10% down · 12.0% · 12mo
- Down + closing
- —
- Monthly P&I
- —
- Monthly cashflow
- —
- DSCR
- —
- Eligible?
- —
Short-term bridge; refi at stabilization.
Rent comps 1 comps
| Address | Beds | Baths | Sqft | Rent | $/sqft | DOM | Units | Dist |
|---|---|---|---|---|---|---|---|---|
| 108 Forrest Dr Fountain Inn, SC | 2.0 | 2.0 | 1104 | $1,495 | $1.35 | 14d | 1 | 1.45mi |
Listing history 16 events
-
2026-06-22days on market $219,990 Active 394 DOM
-
2026-06-22days on market $219,990 Active 393 DOM
-
2026-06-18days on market $219,990 Active 390 DOM
-
2026-06-17days on market $219,990 Active 389 DOM
-
2026-06-16days on market $219,990 Active 388 DOM
-
2026-06-15days on market $219,990 Active 387 DOM
-
2026-06-13days on market $219,990 Active 385 DOM
-
2026-06-13days on market $219,990 Active 384 DOM
-
2026-06-10days on market $219,990 Active 382 DOM
-
2026-06-09days on market $219,990 Active 381 DOM
-
2026-06-08days on market $219,990 Active 380 DOM
-
2026-06-07days on market $219,990 Active 379 DOM
-
2026-06-03days on market $219,990 Active 375 DOM
-
2026-06-03days on market $219,990 Active 374 DOM
-
2026-06-01days on market $219,990 Active 373 DOM
-
2026-05-31days on market $219,990 Active 372 DOM
ⓘ Source: listings_history table (triggers on properties + properties_extension) + one-shot
backfill from property_details.listing_events for pre-trigger history.
Nearby sold comps map
Loading sold comps map…
Walkable amenities ~0.75 mi
Loading nearby amenities…
Taxation est. · year 1
- Rental income
- $22,645
- − Mortgage interest
- −$12,323
- − Property taxes
- −$3,300
- − Insurance
- −$1,100
- − Repairs & maintenance
- −$1,812
- − Management
- −$1,812
- − Depreciation
- −$6,400
- Taxable loss
- −$4,100
- Est. tax savings @ 24.0%
- +$984
- After-tax cash flow
- $630/yr
For passive investors: Depreciation is non-cash, so a rental often shows a tax loss while cash-flowing — sheltering income. Rental losses are passive: they offset passive income freely, and up to $25,000/yr can offset ordinary (W-2) income if you actively participate and your MAGI is under $100k (phasing out to $0 by $150k); unused losses carry forward. On sale, claimed depreciation is recaptured at up to 25%, and gains may owe capital-gains tax (a 1031 exchange can defer both). Figures are a year-1 estimate at your 24.0% rate — not tax advice; consult a CPA.
Schools (NCES district)
- District
- Greenville 01
- NCES district ID
- 4502310
- Math proficiency
- 44% ▼ -10.00%
- Reading proficiency
- 54% ▼ -2.00%
- Median HH income
- $49,596
- Composite
- 41.88/100
- National rank
- #3370
- State rank
- #10 of 80 in SC
Livability — Fountain Inn
- Score
- 82/100
- State rank
- #4
- US rank
- #1162
Category grades
Schools grade is shown separately in the Schools card above.
Census & demographics
- County
- Greenville County · 573,815 people
- City population
- 22,907
- Metro
- Greenville-Anderson, SC
- Population (ZIP)
- 22,907
- Household income
- $70,301
- Rent vs Own
- Severe rent burden
- 475.0
Population outlook (Laurens County) Hauer SSP2
- Today (2025)
- 66,741 people
- By 2030
- 66,454 · -0.4%
- By 2040
- 64,881 · -2.8%
- By 2050
- 61,941 · -7.2%
- By 2075
- 53,266 · -20.2%
- By 2100
- 41,495 · -37.8%
Race, ethnicity, and origin ACS 2023
- Neighborhood character
- Predominantly White (66%)
- Race & ethnicity
- White 66% Black 18% Two or more races 10% Hispanic / Latino 10%
- Hispanic origin (detail)
- Mexican 3% Puerto Rican 2%
- Common ancestry
- Slovak 3% Romanian 2% Lithuanian 2%
- Foreign-born
- 6% · Canada, Jamaica
- Languages at home
- 89% English-only · Spanish 9% Tagalog/Filipino 1%
Political lean MEDSL · Laurens
- 2024 margin
- Solid R (+40.9) · D 29.0% · R 69.9% · Other 1.1%
- 2008→2024 swing
- -22.8pp toward R · 2008: -18.1pp · 2024: -40.9pp
- All cycles
- 2024: R+40.9 2020: R+32.3 2016: R+29.9 2012: R+17.5 2008: R+18.1
Not yet ingested
- Civics
- —
Market trends
- HPI YoY
- ▼ -100.45%
- Current HPI
- 250.5271
- Rent YoY
- ▲ 4.55%
- Metro
- Greenville-Anderson, SC
- State GDP YoY
- ▲ 4.51%
- F500 in state
- 2
Industry mix (Fortune 500 HQ in SC)
| Industry | F500 HQs | Revenue |
|---|---|---|
| Packaging | 1 | $7B |
|
||
Cash-flow waterfall
monthlySold comps — $/sqft
last 12 mo · ≤1 miLoading sold comps…