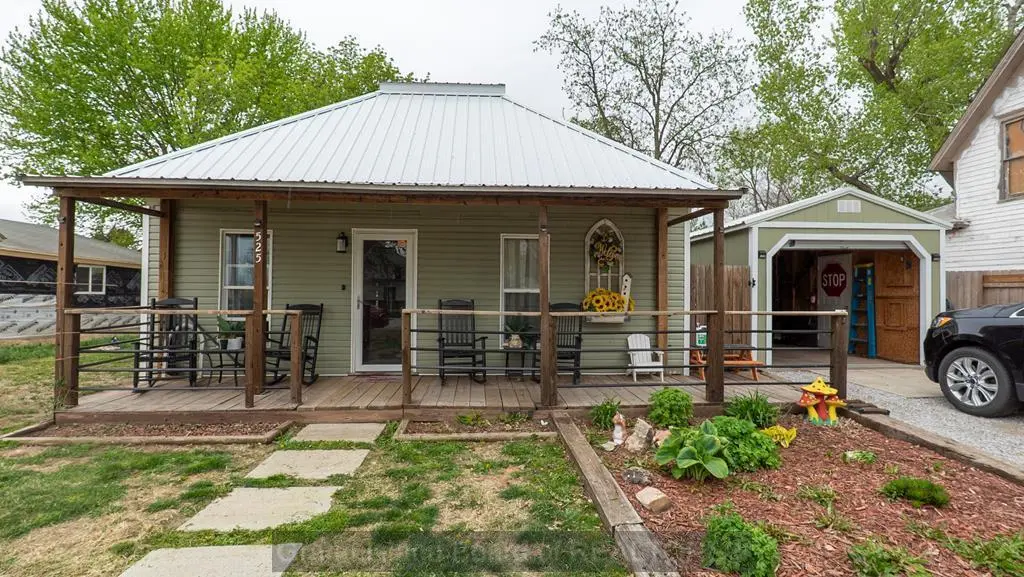
525 Stockton St · Bradshaw, NE
Flood risk 1/10 · Minimal
- FEMA flood zone
- X (unshaded)
- Chance of flooding over 30 yrs
- 0.0%
- Est. flood insurance / yr
- $507 – $1,088
Fire risk 2/10 · Minimal
- Est. fire insurance / yr
- $1,161 – $2,155
Heat risk 3/10 · Minor
- Hot days now (above 104°F)
- 7 days/yr
- Hot days in 30 yrs
- 15 days/yr
Wind risk 2/10 · Minimal
- Chance of severe wind over 30 yrs
- —
Air-quality risk 1/10 · Minimal
- Unhealthy air days now
- 0 days/yr
- Unhealthy air days in 30 yrs
- 0 days/yr
Risk factors via First Street. Map © Google.
Why this score? — see what drove the C grade
The composite is a weighted blend of 9 inputs, each scored 0–100. Each bar is that input's sub-score; the figure is the points it added to the 100-point composite (weight × sub-score).
- ARV discount +15.0/15.0
- Cash flow +14.3/30.0
- Appreciation +6.4/10.0
- Schools +5.7/10.0
- DSCR +4.4/10.0
- Livability +3.3/5.0
- 1% rule +2.8/10.0
- Rent growth +2.5/5.0
- Condition / age +2.5/5.0
$125,000
🖨 Deal sheet 📄 Offer letter ✓ Due diligence
Listing remarks
This charming property is completely updated with new flooring throughout and a new metal roof. Updated windows, electrical, plumbing, and added insulation. All-electric home with an updated PTAC HVAC system. Added storage with attic access. Bathroom is in progress with some unfinished wall areas—tile and materials included. One-car attached garage. Alley access behind the fenced backyard.
Key facts
- New metal roof
- Updated electrical
- Updated windows
Tags
Property features AI
Exterior
- Parking: 1-car garage
- Security: Smoke detectors
- Utilities: Sewer connected
- Home design: Single-family residence; Residential property
- Construction: Frame construction; Vinyl siding
- Exterior features: Wood fencing; Metal roof
Interior
- Kitchen: Electric range; Microwave; Refrigerator
- Bedrooms: 2 main-level bedrooms
- Bathrooms: 1 full bathroom
- Interior features: Pantry; Window coverings; Partial basement
- Laundry & utility: Main-level laundry; Electric water heater
Neighborhood map
What this means for you Summary
Snapshot
- This is a 3-bed/1.0-bath single-family listed at $125k.
Deal economics
- At list price, monthly cash flow is $24 ($288/yr) — positive.
- The deal already cash-flows at list — no discount required.
- To meet the 1% rule (rent ≥ 1% of price), the offer needs to be $97k (22.3% below list).
- Recommended offer: $97k (22.3% below list) — sets the bar for 1% rule.
Location & tenants
- Location reads 66/100 on livability (#315 in NE) — a middle-class / working-renter tenant base. Strengths: cost of living A+, housing A+; Watch: employment C-, health & safety C-, amenities F.
- Heartland Community Schools (rural): math 70% / reading 60% proficiency, ranked #30 of 245 in NE (top 12%) — acceptable for families but not a draw, mixed tenant base, ~2y average lease; only 18% free/reduced lunch — higher-income household profile.
- Zoned schools: Heartland Community Elementary (math 52% / reading 62%, grade C+, #136 of 502 statewide, top 31%, 197 students, 36% FRL); Heartland Community High Sch (math 72% / reading 57%, grade B-, #25 of 261 statewide, top 13%, 156 students, 29% FRL).
- Market conditions: 2 active listings in the ZIP; 29 units permitted in York County in 2024 (0 in 5+ unit buildings).
Forward outlook
- In year one you build about $4k of equity ($864 loan paydown + $4k appreciation (2.9% local appreciation)).
- York County population projected at +8% by 2050 — modest demand growth; plan on rents tracking national, not racing it.
- At projected returns (2.9% appreciation + 3.0% rent growth), your $35k cash investment doubles in ~6 years — after that, you're playing with house money.
- By year 8, paydown + projected appreciation supports a ~$33k cash-out refi (75% LTV) — recoverable capital for the next deal without selling this one.
Negotiation context
- It's been on market 42 days — a 3% lower offer ($121k) is reasonable based on typical stale-listing flexibility.
- 2 sale attempts with the ask held roughly flat each time — persistent listings suggest the price (not the market) is what's stuck; bring a comps-based counter.
Risks & watch-outs
- Watch-outs: built in 1900 — expect roof / HVAC / electrical / plumbing capex.
Questions for the listing agent
- It's been on market 42 days. Have you received any prior offers? Is the seller open to a 22% concession, seller financing, or rate buy-down credit?
- Built in 1900 — when were the roof, HVAC, electrical panel, plumbing, and water heater last replaced?
- Is there a deadline driving the sale (1031 exchange, divorce, estate, relocation)? That informs how much negotiation room exists.
- Schools are D-rated, which usually means shorter tenancies and higher turnover. Who's the typical renter profile here, and what's been the actual vacancy rate?
- What's the average days-on-market for RENTAL listings here right now (not sales)? A rising rental-DOM trend means longer vacancies and softer asking-rent achievability than the comps imply.
- What's the recent tenant-quality profile in this submarket — average credit score on applications, eviction rate, late-payment / NSF rate, and stable-employment percentage? A property-management company in the area should have these aggregated.
- How much new for-sale + rental construction is in the pipeline within 1–3 miles? Heavy new supply typically softens prices + rents 12–24 months out; constrained supply supports both.
Investment metrics
- 1% rule
- 0.78% ✗
- Cap rate
- 6.52%
- Cash-on-cash
- 0.82%
- DSCR
- 1.04
- GRM
- 10.7
CMA / ARV
- ARV (median comp)
- $164,891
- List price
- $125,000
- Delta
- -24.19%
- Verdict
- UNDERPRICED
- Comps
- 4 within 1.0 mi
Projected returns pro-forma
2.87% appreciation · 3.0% rent growth · sell at horizon
- IRR
- 7.9%
- Equity multiple
- 1.45×
- Total profit
- $15,691
- Equity at exit
- $55,317
- IRR
- 10.6%
- Equity multiple
- 2.56×
- Total profit
- $54,698
- Equity at exit
- $84,566
Cash invested: $35,000 (down + closing). Projections, not guarantees.
Landlord ↔ Tenant lean methodology
- Overall (STATE)
- 83 Strongly Landlord-Friendly
- State Nebraska
- 83 Strongly Landlord-Friendly · R+13
- County
- — inherits STATE
- City
- — inherits STATE
ZIP-level market 68319
- Home prices YoY
- 2.5%
- Active inventory
- 2
- Price-to-rent
- 10.7×
Monthly cashflow live
- Estimated rent
- $971 medium interval (Pro) →
- Mortgage (P&I)
- −$656
- Tax from tax record
- −$36 /mo · $430/yr
- Insurance
- −$52
- HOA
- −$0
- Vacancy / Maint / Mgmt
- −$204
- Net cashflow
- $24
Break-even live
UW: 25.0% down · 7.5% · 30yr · 1.5% tax · 5.0% vac · 8.0% maint · 8.0% mgmt
Financing live
Cash to close
- Down payment
- $31,250
- Closing costs
- $3,750
- Reserves months
- —
- Total cash needed
- —
Loan-product check · same deal, 3 products live
Conventional
25% down · 7.5% · 30yr
- Down + closing
- —
- Monthly P&I
- —
- Monthly cashflow
- —
- DSCR
- —
- Eligible?
- —
Personal DTI + credit; lowest rate.
DSCR
20% down · 8.5% · 30yr
- Down + closing
- —
- Monthly P&I
- —
- Monthly cashflow
- —
- DSCR
- —
- Eligible?
- —
No personal income docs; deal must DSCR.
Hard money
10% down · 12.0% · 12mo
- Down + closing
- —
- Monthly P&I
- —
- Monthly cashflow
- —
- DSCR
- —
- Eligible?
- —
Short-term bridge; refi at stabilization.
Listing history 10 events
-
2026-06-12statusdays on market $125,000 Pending 42 DOM
-
2026-06-09days on market $125,000 Active 40 DOM
-
2026-06-08days on market $125,000 Active 39 DOM
-
2026-06-07days on market $125,000 Active 38 DOM
-
2026-06-05days on market $125,000 Active 36 DOM
-
2026-06-04days on market $125,000 Active 34 DOM
-
2026-06-02days on market $125,000 Active 33 DOM
-
2026-06-01days on market $125,000 Active 32 DOM
-
2026-05-31days on market $125,000 Active 31 DOM
-
2026-04-28$125,000 Active 398-char remark
ⓘ Source: listings_history table (triggers on properties + properties_extension) + one-shot
backfill from property_details.listing_events for pre-trigger history.
Tax reassessment forecast NE · Resets to sale price
- Current annual tax
- $430 · $36/mo
- Projected year-2 tax
- $2,162 · $180/mo
- Expected delta
- +$1,733/yr (+$144/mo · 403.0%)
ⓘ Screening estimate from a state-policy table — verify with the county assessor before closing.
Climate risk First Street
- Flood 1/10 Low FEMA zone X (unshaded) · 0% chance over 30 yrs
- Wildfire 2/10 Low
- Heat 3/10 Moderate 7 d/yr ≥104°F today · 15 d/yr by 30 yrs out
- Wind 2/10 Low
- Air quality 1/10 Low 0 unhealthy d/yr today · 0 by 30 yrs out
Nearby sold comps map
Loading sold comps map…
Walkable amenities ~0.75 mi
Loading nearby amenities…
Taxation est. · year 1
- Rental income
- $11,657
- − Mortgage interest
- −$7,002
- − Property taxes
- −$430
- − Insurance
- −$625
- − Repairs & maintenance
- −$933
- − Management
- −$933
- − Depreciation
- −$3,636
- Taxable loss
- −$1,902
- Est. tax savings @ 24.0%
- +$456
- After-tax cash flow
- $744/yr
For passive investors: Depreciation is non-cash, so a rental often shows a tax loss while cash-flowing — sheltering income. Rental losses are passive: they offset passive income freely, and up to $25,000/yr can offset ordinary (W-2) income if you actively participate and your MAGI is under $100k (phasing out to $0 by $150k); unused losses carry forward. On sale, claimed depreciation is recaptured at up to 25%, and gains may owe capital-gains tax (a 1031 exchange can defer both). Figures are a year-1 estimate at your 24.0% rate — not tax advice; consult a CPA.
Schools (NCES district)
- District
- Heartland Community Schools
- NCES district ID
- 3100117
- Math proficiency
- 70% ▲ 5.00%
- Reading proficiency
- 60% ▼ -5.00%
- Median HH income
- $57,754
- Composite
- 57.38/100
- National rank
- #2285
- State rank
- #30 of 245 in NE
Livability — Bradshaw
- Score
- 66/100
- State rank
- #315
- US rank
- #11773
Category grades
Schools grade is shown separately in the Schools card above.
Census & demographics
- Census place
- Bradshaw, NE
- Population (ZIP)
- 607
Population outlook (York County) Hauer SSP2
- Today (2025)
- 13,976 people
- By 2030
- 14,103 · +0.9%
- By 2040
- 14,490 · +3.7%
- By 2050
- 15,059 · +7.7%
- By 2075
- 18,276 · +30.8%
- By 2100
- 21,449 · +53.5%
Race, ethnicity, and origin ACS 2023
- Neighborhood character
- Predominantly White (75%)
- Race & ethnicity
- White 75% Hispanic / Latino 21% Two or more races 14% Black 3%
- Hispanic origin (detail)
- Mexican 20% Puerto Rican 1%
- Common ancestry
- Scottish 4% Romanian 2% Lithuanian 1%
- Languages at home
- 87% English-only · Spanish 12% German/W. Germanic 1%
Political lean MEDSL · York
- 2024 margin
- Solid R (+51.3) · D 23.6% · R 74.9% · Other 1.5%
- 2008→2024 swing
- -2.0pp toward R · 2008: -49.3pp · 2024: -51.3pp
- All cycles
- 2024: R+51.3 2020: R+51.8 2016: R+56.0 2012: R+55.4 2008: R+49.3
Not yet ingested
- Civics
- —
Market trends
- HPI YoY
- ▲ 2.87%
- Current HPI
- 118.2419
- Rent YoY
- —
- Metro
- —
- State GDP YoY
- ▲ 0.68%
- F500 in state
- 2
Industry mix (Fortune 500 HQ in NE)
| Industry | F500 HQs | Revenue |
|---|---|---|
| Conglomerate | 1 | $371B |
|
||
Price history
4 events — show timeline
- 2026-06-11 Pending — GIBOR
- 2026-05-23 Relisted — GIBOR
- 2026-05-21 Pending — GIBOR
- 2026-04-28 Listed $125,000 GIBOR
Property tax history
+16.6%/yrLatest (2025): $430 · -14.3% YoY. Source: county tax records.
Cash-flow waterfall
monthlySold comps — $/sqft
last 12 mo · ≤1 miLoading sold comps…