5522 Clove Row · Haines City, FL
Flood risk No data
- FEMA flood zone
- —
- Chance of flooding over 30 yrs
- —
- Est. flood insurance / yr
- —
Fire risk No data
- Est. fire insurance / yr
- —
Heat risk No data
- Hot days now (above threshold)
- —
- Hot days in 30 yrs
- —
Wind risk No data
- Chance of severe wind over 30 yrs
- —
Air-quality risk No data
- Unhealthy air days now
- —
- Unhealthy air days in 30 yrs
- —
Risk factors via First Street. Map © Google.
Why this score? — see what drove the F grade
The composite is a weighted blend of 9 inputs, each scored 0–100. Each bar is that input's sub-score; the figure is the points it added to the 100-point composite (weight × sub-score).
- Cash flow +7.6/30.0
- ARV discount +7.5/15.0
- Livability +3.7/5.0
- Schools +3.5/10.0
- Rent growth +2.8/5.0
- Condition / age +2.5/5.0
- 1% rule +2.4/10.0
- DSCR +1.7/10.0
- Appreciation +0.0/10.0
$325,990
🖨 Deal sheet 📄 Offer letter ✓ Due diligence
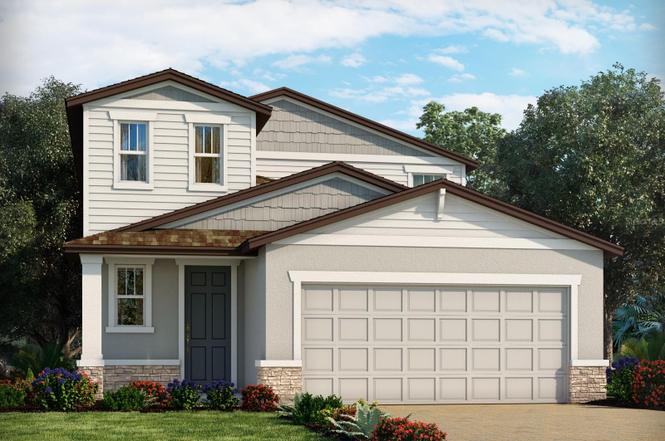
Listing remarks
Brand new, energy-efficient home available by NOW! First-floor primary suite ensures everyone has their own private space. Second floor offers a spacious loft that can be used to best fit your family's needs. Enjoy preparing meals with your family in the open kitchen with spacious work island. Now pre-selling from the low $300s, Crosswinds Classic Series offers single-family homes in Davenport and Haines City. Residents will have access to an array of resort-style amenities including a pool and cabana, 2 dog parks, playground, walking trails, and 2 sports fields. Schedule an appointment today. Each of our homes is built with innovative, energy-efficient features designed to help you enjoy m
Key facts
- Spacious loft
- Pool and cabana
- Open kitchen
Tags
Neighborhood map
What this means for you Summary
Snapshot
- This is a 4-bed/2.5-bath land listed at $326k.
Deal economics
- At list price, monthly cash flow is $-387 ($-5k/yr) — negative.
- To cash-flow at today's rent, offer at most $270k (17.2% below list).
- To meet the 1% rule (rent ≥ 1% of price), the offer needs to be $242k (25.6% below list).
- Recommended offer: $242k (25.6% below list) — sets the bar for 1% rule.
Location & tenants
- Location reads 74/100 on livability (#285 in FL, #4,575 nationally) — a middle-class / working-renter tenant base. Strengths: crime A+, cost of living A+, housing A+; Watch: amenities F, commute F, employment F.
- Polk (suburban): math 39% / reading 43% proficiency, ranked #62 of 73 in FL (top 85%) — families likely to look elsewhere, expect single-tenant / working-renter base with shorter leases.
- Zoned schools: Eastside Elementary School (math 33% / reading 29%, grade F, #1,854 of 2,144 statewide, top 87%, 615 students, 66% FRL); Ridge Community High School (math 12% / reading 33%, grade F, #539 of 667 statewide, top 81%, 2,711 students, 48% FRL) — zoned schools at 57% FRL track the district average.
- Zoned-school proficiency averages 27% at this address vs 41% district-wide (-14 pts) — the specific schools serving this property underperform the Polk average; the district grade overstates school quality for this exact location.
- Market conditions: Rents rising (+1.2%/yr); 1333 active listings in the ZIP; 40 comparable units currently listed for rent nearby; rentals at typical pace (median 23d on market — plan ~3-4 weeks tenant-placement turnaround); 10,384 units permitted in Polk County in 2024 (1,716 in 5+ unit buildings).
- At $2,425/mo this rent would consume 46% of the median local household income ($64k/yr) (locally 1107% of renters already pay >50% of income on rent) — very limited rent-growth headroom before tenants either downsize or default.
Forward outlook
- Local home prices are declining (-3.0%/yr); year-one equity from $2k of loan paydown is wiped out by about $10k of value loss. Plan a longer hold.
- Polk County population projected at +33% by 2050 — long-run rental-demand tailwind backs the buy-and-hold thesis.
Negotiation context
- It's been on market 174 days — a 12% lower offer ($287k) is reasonable based on typical stale-listing flexibility.
Questions for the listing agent
- What do current leases actually rent for vs. the listed asking? Can we see a recent rent roll and the last 12 months of T-12 income?
- It's been on market 174 days. Have you received any prior offers? Is the seller open to a 26% concession, seller financing, or rate buy-down credit?
- What does the HOA fee cover, when was the last increase, and are there any pending special assessments or reserve-fund shortfalls?
- Why hasn't it sold? Are there any deal-killer items the seller is aware of (foundation, flood, title, zoning, code violations)?
- Is there a deadline driving the sale (1031 exchange, divorce, estate, relocation)? That informs how much negotiation room exists.
- Schools are D-rated, which usually means shorter tenancies and higher turnover. Who's the typical renter profile here, and what's been the actual vacancy rate?
- The area grade is low — what's the realistic commute time and amenity access for the typical tenant pool here? Any planned neighborhood developments (good or bad) we should know about?
- What's the average days-on-market for RENTAL listings here right now (not sales)? A rising rental-DOM trend means longer vacancies and softer asking-rent achievability than the comps imply.
- What's the recent tenant-quality profile in this submarket — average credit score on applications, eviction rate, late-payment / NSF rate, and stable-employment percentage? A property-management company in the area should have these aggregated.
- How much new for-sale + rental construction is in the pipeline within 1–3 miles? Heavy new supply typically softens prices + rents 12–24 months out; constrained supply supports both.
Investment metrics
- 1% rule
- 0.74% ✗
- Cap rate
- 4.87%
- Cash-on-cash
- -5.09%
- DSCR
- 0.77
- GRM
- 11.2
CMA / ARV
No comps found within radius.
Projected returns pro-forma
-3.0% appreciation · 1.16% rent growth · sell at horizon
- IRR
- -27.1%
- Equity multiple
- 0.10×
- Total profit
- $-81,831
- Equity at exit
- $48,606
- IRR
- -32.9%
- Equity multiple
- -0.32×
- Total profit
- $-120,177
- Equity at exit
- $28,186
Cash invested: $91,277 (down + closing). Projections, not guarantees.
Landlord ↔ Tenant lean methodology
- Overall (STATE)
- 87 Strongly Landlord-Friendly
- State Florida
- 87 Strongly Landlord-Friendly · R+3
- County
- — inherits STATE
- City
- — inherits STATE
ZIP-level market 33844
- Home prices YoY
- -26.7%
- Rents YoY
- 1.2%
- Active inventory
- 1333
- Price-to-rent
- 11.2×
Monthly cashflow live
- Estimated rent
- $2,425 high interval (Pro) →
- Mortgage (P&I)
- −$1,710
- Tax est. 1.5%
- −$407 /mo · $4,890/yr
- Insurance
- −$136
- HOA
- −$50
- Vacancy / Maint / Mgmt
- −$509
- Net cashflow
- $-387
Break-even live
UW: 25.0% down · 7.5% · 30yr · 1.5% tax · 5.0% vac · 8.0% maint · 8.0% mgmt
Financing live
Cash to close
- Down payment
- $81,498
- Closing costs
- $9,780
- Reserves months
- —
- Total cash needed
- —
Loan-product check · same deal, 3 products live
Conventional
25% down · 7.5% · 30yr
- Down + closing
- —
- Monthly P&I
- —
- Monthly cashflow
- —
- DSCR
- —
- Eligible?
- —
Personal DTI + credit; lowest rate.
DSCR
20% down · 8.5% · 30yr
- Down + closing
- —
- Monthly P&I
- —
- Monthly cashflow
- —
- DSCR
- —
- Eligible?
- —
No personal income docs; deal must DSCR.
Hard money
10% down · 12.0% · 12mo
- Down + closing
- —
- Monthly P&I
- —
- Monthly cashflow
- —
- DSCR
- —
- Eligible?
- —
Short-term bridge; refi at stabilization.
Rent comps 40 comps
| Address | Beds | Baths | Sqft | Rent | $/sqft | DOM | Units | Dist |
|---|---|---|---|---|---|---|---|---|
| 5009 Katrina Dr Haines City, FL | 4.0 | 2.0 | 1840 | $2,500 | $1.36 | 23d | 1 | 0.04mi |
| 5153 Green Belt Dr Haines City, FL | 4.0 | 2.0 | 1824 | $2,300 | $1.26 | 14d | 1 | 0.11mi |
| 5157 Green Belt Dr Haines City, FL | 4.0 | 3.0 | 2109 | $2,900 | $1.38 | 3d | 1 | 0.11mi |
| 5161 Green Belt Dr Haines City, FL | 4.0 | 2.5 | 2500 | $2,100 | $0.84 | 23d | 1 | 0.11mi |
| 5177 Green Belt Dr Haines City, FL | 4.0 | 3.0 | 2109 | $2,920 | $1.38 | 2d | 1 | 0.11mi |
| 5193 Green Belt Dr Haines City, FL | 4.0 | 2.0 | 1824 | $2,099 | $1.15 | 23d | 1 | 0.12mi |
| 4770 Katrina Dr Haines City, FL | 3.0 | 2.0 | 2109 | $2,000 | $0.95 | 23d | 1 | 0.16mi |
| 4746 Katrina Dr Haines City, FL | 4.0 | 2.0 | 1818 | $2,095 | $1.15 | 23d | 1 | 0.16mi |
| 4757 Katrina Dr Haines City, FL | 4.0 | 2.0 | 2451 | $2,050 | $0.84 | 23d | 1 | 0.19mi |
| 4813 Katrina Dr Haines City, FL | 4.0 | 2.0 | 2000 | $2,000 | $1.00 | 23d | 1 | 0.21mi |
| 914 Princess Sabal Pt Haines City, FL | 3.0 | 2.0 | 1677 | $1,775 | $1.06 | 14d | 1 | 0.33mi |
| 1433 Princess Tree Ct Haines City, FL | 4.0 | 2.0 | 1828 | $1,999 | $1.09 | 23d | 1 | 0.42mi |
| 4034 Old Mill Rd Haines City, FL | 5.0 | 2.5 | 2326 | $2,400 | $1.03 | 3d | 1 | 0.47mi |
| 3910 Amers Loop Haines City, FL | 5.0 | 2.5 | 2112 | $2,600 | $1.23 | 23d | 1 | 0.50mi |
| 3898 Amers Loop Haines City, FL | 4.0 | 2.5 | 1874 | $2,150 | $1.15 | 23d | 1 | 0.51mi |
| 3874 Amers Loop Haines City, FL | 4.0 | 2.5 | 1874 | $2,130 | $1.14 | 3d | 1 | 0.54mi |
| 2203 Pigeon Plum Dr Haines City, FL | 4.0 | 3.0 | 1887 | $2,190 | $1.16 | 10d | 1 | 0.59mi |
| 4156 Hummock Pl Haines City, FL | 3.0 | 2.5 | 1548 | $1,850 | $1.20 | 23d | 1 | 0.65mi |
| 3754 King Hill Dr Haines City, FL | 3.0 | 2.5 | 1720 | $1,800 | $1.05 | 23d | 1 | 0.66mi |
| 144 Towns Cir Haines City, FL | 5.0 | 3.0 | 2712 | $2,600 | $0.96 | 23d | 1 | 0.69mi |
| 1950 Pond Pine Ct Haines City, FL | 4.0 | 2.0 | 1939 | $1,975 | $1.02 | 23d | 1 | 0.71mi |
| 621 Sand Pine Ln Haines City, FL | 4.0 | 2.5 | 2040 | $2,350 | $1.15 | 10d | 1 | 0.74mi |
| 600 Silver Palm Dr Haines City, FL | 4.0 | 2.5 | 2267 | $2,800 | $1.24 | 10d | 1 | 0.75mi |
| 1276 Tupelo Trl Haines City, FL | 4.0 | 3.0 | 1900 | $1,895 | $1.00 | 11d | 1 | 0.75mi |
| 1361 Current Pl Haines City, FL | 4.0 | 2.0 | 1630 | $2,100 | $1.29 | 23d | 1 | 0.84mi |
| 429 Silver Palm Dr Haines City, FL | 4.0 | 2.0 | 1625 | $1,990 | $1.22 | 18d | 1 | 0.86mi |
| 1462 Sea Glass Rd Haines City, FL | 4.0 | 2.5 | 2168 | $2,200 | $1.01 | 23d | 1 | 0.92mi |
| 1138 Foreshore Ln Haines City, FL | 3.0 | 2.0 | 1734 | $2,200 | $1.27 | 23d | 1 | 0.94mi |
| 202 Hidden Lake Loop Haines City, FL | 4.0 | 2.0 | 1981 | $1,905 | $0.96 | 11d | 1 | 0.94mi |
| 148 Summerlin Loop Haines City, FL | 3.0 | 2.0 | 1579 | $1,850 | $1.17 | 14d | 1 | 0.94mi |
| 333 Hidden Lake Loop Haines City, FL | 4.0 | 2.0 | 1909 | $1,985 | $1.04 | 11d | 1 | 0.97mi |
| 299 Bottle Brush Dr Haines City, FL | 4.0 | 2.0 | 1763 | $2,300 | $1.30 | 23d | 1 | 0.97mi |
| 167 Hidden Lake Loop Haines City, FL | 4.0 | 2.0 | 1981 | $2,020 | $1.02 | 18d | 1 | 1.00mi |
| 219 Bottle Brush Dr Haines City, FL | 4.0 | 3.0 | 2420 | $2,450 | $1.01 | 23d | 1 | 1.00mi |
| 1105 Lexington Ln Haines City, FL | 4.0 | 2.0 | 2123 | $1,995 | $0.94 | 18d | 1 | 1.03mi |
| 117 Hidden Lake Loop Haines City, FL | 4.0 | 2.5 | 2099 | $2,085 | $0.99 | 23d | 1 | 1.04mi |
| 120 Hidden Lake Loop Haines City, FL | 4.0 | 2.0 | 1909 | $2,020 | $1.06 | 13d | 1 | 1.06mi |
| 1364 Conch Key Ln Davenport, FL | 3.0 | 2.0 | 1485 | $2,150 | $1.45 | 3d | 1 | 1.07mi |
| 851 Folklore Ln Haines City, FL | 4.0 | 3.0 | 2290 | $2,195 | $0.96 | 3d | 1 | 1.11mi |
| 239 Summerlin Ln Haines City, FL | 4.0 | 2.0 | 2168 | $2,300 | $1.06 | 23d | 1 | 1.16mi |
HOA detail
- Monthly dues
- $50 · $600/yr
- Likely covers
- pool
Listing history 7 events
-
2026-03-26status Pending
-
2026-03-04price $325,990
-
2026-03-03price $339,195
-
2026-02-26price $336,345
-
2026-02-19price $339,195
-
2026-02-13price $348,195
-
2025-10-03$353,195 Active
ⓘ Source: listings_history table (triggers on properties + properties_extension) + one-shot
backfill from property_details.listing_events for pre-trigger history.
Nearby sold comps map
Loading sold comps map…
Walkable amenities ~0.75 mi
Loading nearby amenities…
Taxation est. · year 1
- Rental income
- $29,097
- − Mortgage interest
- −$18,261
- − Property taxes
- −$4,890
- − Insurance
- −$1,630
- − Repairs & maintenance
- −$2,328
- − Management
- −$2,328
- − HOA
- −$600
- − Depreciation
- −$9,483
- Taxable loss
- −$10,422
- Est. tax savings @ 24.0%
- +$2,501
- After-tax cash flow
- $-2,146/yr
For passive investors: Depreciation is non-cash, so a rental often shows a tax loss while cash-flowing — sheltering income. Rental losses are passive: they offset passive income freely, and up to $25,000/yr can offset ordinary (W-2) income if you actively participate and your MAGI is under $100k (phasing out to $0 by $150k); unused losses carry forward. On sale, claimed depreciation is recaptured at up to 25%, and gains may owe capital-gains tax (a 1031 exchange can defer both). Figures are a year-1 estimate at your 24.0% rate — not tax advice; consult a CPA.
Schools (NCES district)
- District
- Polk
- NCES district ID
- 1201590
- Math proficiency
- 39% ▼ -11.00%
- Reading proficiency
- 43% ▼ -4.00%
- Median HH income
- $43,979
- Composite
- 34.74/100
- National rank
- #5132
- State rank
- #62 of 73 in FL
Livability — Haines City
- Score
- 74/100
- State rank
- #285
- US rank
- #4575
Category grades
Schools grade is shown separately in the Schools card above.
Census & demographics
- Census place
- Haines City, FL
- County
- Polk County · 740,051 people
- City population
- 51,255
- Metro
- Lakeland-Winter Haven, FL
- Population (ZIP)
- 51,255
- Household income
- $63,650
- Rent vs Own
- Severe rent burden
- 1107.0
Population outlook (Polk County) Hauer SSP2
- Today (2025)
- 752,975 people
- By 2030
- 804,621 · +6.9%
- By 2040
- 906,117 · +20.3%
- By 2050
- 1,000,476 · +32.9%
- By 2075
- 1,197,520 · +59.0%
- By 2100
- 1,271,518 · +68.9%
Race, ethnicity, and origin ACS 2023
- Neighborhood character
- Diverse neighborhood (Simpson 0.64)
- Race & ethnicity
- Hispanic / Latino 48% White 31% Black 18% Two or more races 12% Asian 1%
- Hispanic origin (detail)
- Mexican 19% Puerto Rican 19% Cuban 1% Dominican 3%
- Common ancestry
- Hispanic 4% Lithuanian 1% Romanian 1%
- Foreign-born
- 15% · Canada, Jamaica, Guatemala
- Languages at home
- 55% English-only · Spanish 39% French/Haitian/Cajun 4% Other Indo-European 0%
Political lean MEDSL · Polk
- 2024 margin
- Strong R (+20.7) · D 39.2% · R 59.9%
- 2008→2024 swing
- -14.6pp toward R · 2008: -6.1pp · 2024: -20.7pp
- All cycles
- 2024: R+20.7 2020: R+14.4 2016: R+14.1 2012: R+6.8 2008: R+6.1
Not yet ingested
- Civics
- —
Market trends
- HPI YoY
- ▼ -105.94%
- Current HPI
- 291.0798
- Rent YoY
- ▲ 1.16%
- Metro
- Lakeland-Winter Haven, FL
- State GDP YoY
- ▲ 3.28%
- F500 in state
- 36
Industry mix (Fortune 500 HQ in FL)
| Industry | F500 HQs | Revenue |
|---|---|---|
| Industrial Technology | 2 | $29B |
|
||
| Insurance | 2 | $17B |
|
||
| Retail | 1 | $60B |
|
||
| Technology Distribution | 1 | $58B |
|
||
| Homebuilding | 1 | $35B |
|
||
| Technology Manufacturing | 1 | $35B |
|
||
Price history
-7.7% since first listed7 events — show timeline
- 2026-03-26 Pending — Stellar MLS as Distributed by MLS Grid
- 2026-03-04 Price Changed $325,990 Stellar MLS as Distributed by MLS Grid
- 2026-03-03 Price Changed $339,195 Stellar MLS as Distributed by MLS Grid
- 2026-02-26 Price Changed $336,345 Stellar MLS as Distributed by MLS Grid
- 2026-02-19 Price Changed $339,195 Stellar MLS as Distributed by MLS Grid
- 2026-02-13 Price Changed $348,195 Stellar MLS as Distributed by MLS Grid
- 2025-10-03 Listed $353,195 Stellar MLS as Distributed by MLS Grid
Cash-flow waterfall
monthlySold comps — $/sqft
last 12 mo · ≤1 miLoading sold comps…