 Triplex
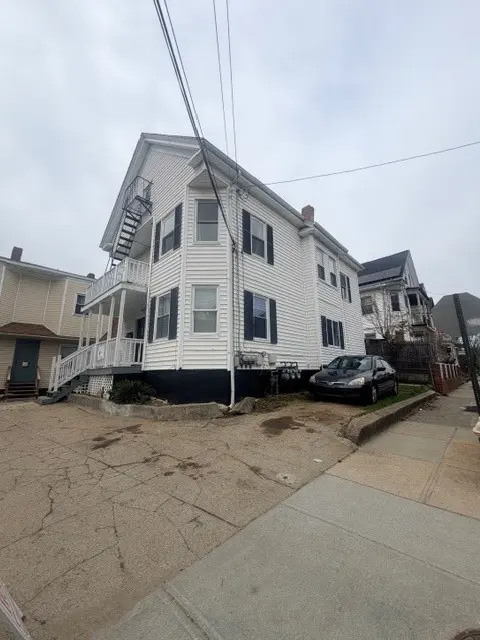
41 Carter St · Providence, RI
Flood risk 1/10 · Minimal
- FEMA flood zone
- X (unshaded)
- Chance of flooding over 30 yrs
- 0.0%
- Est. flood insurance / yr
- $473 – $860
Fire risk 1/10 · Minimal
- Est. fire insurance / yr
- $835 – $1,551
Heat risk 6/10 · Moderate
- Hot days now (above 97°F)
- 7 days/yr
- Hot days in 30 yrs
- 15 days/yr
Wind risk 6/10 · Moderate
- Chance of severe wind over 30 yrs
- 75.0%
Air-quality risk 2/10 · Minimal
- Unhealthy air days now
- 1 days/yr
- Unhealthy air days in 30 yrs
- 2 days/yr
Risk factors via First Street. Map © Google.
Why this score? — see what drove the B grade
The composite is a weighted blend of 9 inputs, each scored 0–100. Each bar is that input's sub-score; the figure is the points it added to the 100-point composite (weight × sub-score).
- Cash flow +30.0/30.0
- DSCR +10.0/10.0
- ARV discount +9.6/15.0
- 1% rule +9.5/10.0
- Rent growth +5.0/5.0
- Livability +4.2/5.0
- Condition / age +2.5/5.0
- Schools +1.0/10.0
- Appreciation +0.0/10.0
$599,000
🖨 Deal sheet 📄 Offer letter ✓ Due diligence
Multi-family units
County records classify this as Multi-Family (2-4 Unit). Listing-text estimate: 3 units. confirmed
Listing remarks MLS
Great Owner Occupied or Investment 3 Unit Property. The 1st and 3rd Fl units are ready to be rented or lived in. Laminate Floors throughout, Newer Kitchens with Granite Counters and Newer Cabinets. 2nd Floor needs a little updatig to make a profitable investment. Ceramic Tiled Bathrooms. Parking for 4-5 Cars. Near All Amenities. .. Shopping, Schools, Highways, Restaurants Etc.
Key facts
- Laminate floors
- Newer cabinets
- Newer kitchens
Tags
Neighborhood map
What this means for you Summary
Snapshot
- This is a 3 × 5-bed/3.0-bath units multifamily listed at $599k.
Deal economics
- At list price, monthly cash flow is $3k ($36k/yr) — positive. Per door: $995/mo.
- The deal already cash-flows at list — no discount required.
- Meets the 1% rule at list price ($9k rent vs $599k).
- Recommended offer: $563k (6.0% below list) — sets the bar for market timing.
- Cap rate 12.3% vs local median 4.2% in Providence — top-decile yield for the area; either an underpriced asset or a hidden risk that comps aren't pricing in. Stress-test before assuming the spread holds.
Location & tenants
- Location reads 84/100 on livability (#2 in RI, #794 nationally) — a professional / high-income tenant draw. Strengths: amenities A+, commute A+, housing A+; Watch: employment C-, schools F.
- Providence (urban): math 8% / reading 16% proficiency, ranked #34 of 39 in RI (top 87%) — low school quality limits family demand, transient renter base, plan for 1-2y turnover; 79% free/reduced lunch — lower-income household profile, screen leases tightly.
- Market conditions: Rents rising fast (+15.3%/yr); 61 active listings in the ZIP; 1 comparable units currently listed for rent nearby; 776 units permitted in Providence County in 2024 (229 in 5+ unit buildings).
- At $8,704/mo this rent would consume 199% of the median local household income ($52k/yr) (locally 2189% of renters already pay >50% of income on rent) — very limited rent-growth headroom before tenants either downsize or default.
Forward outlook
- Local home prices are declining (-3.0%/yr); year-one equity from $4k of loan paydown is wiped out by about $18k of value loss. Plan a longer hold.
- Providence County population projected at +5% by 2050 — modest demand growth; plan on rents tracking national, not racing it.
- At projected returns (-3.0% appreciation + 8.0% rent growth), your $168k cash investment doubles in ~5 years — after that, you're playing with house money.
Negotiation context
- It's been on market 61 days — a 6% lower offer ($563k) is reasonable based on typical stale-listing flexibility.
- 8 sale attempts since 27y ago; this cycle's ask has dropped $51k (8%) from the opening price — seller is motivated, your offer sets the floor, not the list.
- Current owner paid $58k; list at $599k implies a 933% gain — meaningful room to come down on a strong offer.
Risks & watch-outs
- Watch-outs: built in 1900 — expect roof / HVAC / electrical / plumbing capex.
- Climate carrying-cost: major wind risk, 75% chance of damaging wind over 30y; extreme-heat days projected 7→15/yr by 2055 (HVAC capex compounding) — expect insurance premiums to compound above CPI over the hold.
Questions for the listing agent
- It's been on market 61 days. Have you received any prior offers? Is the seller open to a 6% concession, seller financing, or rate buy-down credit?
- Can we see the unit-by-unit rent roll, current vacancy, and any below-market leases? What's the average tenancy length?
- What capital expenditures (roof, boiler, parking lot, exteriors) have been made in the last 5 years, and what's planned in the next 2?
- Built in 1900 — when were the roof, HVAC, electrical panel, plumbing, and water heater last replaced?
- Why hasn't it sold? Are there any deal-killer items the seller is aware of (foundation, flood, title, zoning, code violations)?
- Is there a deadline driving the sale (1031 exchange, divorce, estate, relocation)? That informs how much negotiation room exists.
- Schools are F-rated, which usually means shorter tenancies and higher turnover. Who's the typical renter profile here, and what's been the actual vacancy rate?
- What's the average days-on-market for RENTAL listings here right now (not sales)? A rising rental-DOM trend means longer vacancies and softer asking-rent achievability than the comps imply.
- What's the recent tenant-quality profile in this submarket — average credit score on applications, eviction rate, late-payment / NSF rate, and stable-employment percentage? A property-management company in the area should have these aggregated.
- How much new apartment / multifamily construction is in the pipeline within 1–3 miles? Heavy new supply (>2% of stock underway) typically softens rents 12–24 months out; light construction supports rent growth.
Investment metrics
- 1% rule
- 1.45% ✓
- Cap rate
- 12.27%
- Cash-on-cash
- 21.35%
- DSCR
- 1.95
- GRM
- 5.7
CMA / ARV
- ARV (median comp)
- $627,782
- List price
- $599,000
- Delta
- -4.58%
- Verdict
- FAIR
- Comps
- 20 within 2.0 mi
Projected returns pro-forma
-3.0% appreciation · 8.0% rent growth · sell at horizon
- IRR
- 19.2%
- Equity multiple
- 1.83×
- Total profit
- $138,984
- Equity at exit
- $89,313
- IRR
- 30.7%
- Equity multiple
- 4.43×
- Total profit
- $575,044
- Equity at exit
- $51,791
Cash invested: $167,720 (down + closing). Projections, not guarantees.
Landlord ↔ Tenant lean methodology
- Overall (STATE)
- 31 Tenant-Leaning
- State Rhode Island
- 31 Tenant-Leaning · D+8
- County
- — inherits STATE
- City
- — inherits STATE
ZIP-level market 02907
- Home prices YoY
- -20.1%
- Rents YoY
- 15.3%
- Active inventory
- 61
- Price-to-rent
- 17.2×
Monthly cashflow live
- Estimated rent
- $8,704 medium interval (Pro) →
- Mortgage (P&I)
- −$3,141
- Tax from tax record
- −$501 /mo · $6,013/yr
- Insurance
- −$250
- HOA
- −$0
- Vacancy / Maint / Mgmt
- −$1,828
- Net cashflow
- $2,984
Break-even live
3-unit breakdown (identical units grouped — click to expand)
| Units | Beds | Baths | Est. rent |
|---|---|---|---|
| 3× units | 5 | 3 | $8,703 |
| #1 | 5 | 3 | $2,901 |
| #2 | 5 | 3 | $2,901 |
| #3 | 5 | 3 | $2,901 |
| Total (3 units) | $8,704 | ||
UW: 25.0% down · 7.5% · 30yr · 1.5% tax · 5.0% vac · 8.0% maint · 8.0% mgmt
Financing live
Cash to close
- Down payment
- $149,750
- Closing costs
- $17,970
- Reserves months
- —
- Total cash needed
- —
Loan-product check · same deal, 3 products live
Conventional
25% down · 7.5% · 30yr
- Down + closing
- —
- Monthly P&I
- —
- Monthly cashflow
- —
- DSCR
- —
- Eligible?
- —
Personal DTI + credit; lowest rate.
DSCR
20% down · 8.5% · 30yr
- Down + closing
- —
- Monthly P&I
- —
- Monthly cashflow
- —
- DSCR
- —
- Eligible?
- —
No personal income docs; deal must DSCR.
Hard money
10% down · 12.0% · 12mo
- Down + closing
- —
- Monthly P&I
- —
- Monthly cashflow
- —
- DSCR
- —
- Eligible?
- —
Short-term bridge; refi at stabilization.
Rent comps 1 comps
| Address | Beds | Baths | Sqft | Rent | $/sqft | DOM | Units | Dist |
|---|---|---|---|---|---|---|---|---|
| 14 Calef St Unit 16 Cranston, RI | 5.0 | 3.0 | 3000 | $3,500 | $1.17 | 16d | 1 | 1.18mi |
Listing history 40 events
-
2026-06-18days on market $599,000 Active 61 DOM
-
2026-06-17days on market $599,000 Active 60 DOM
-
2026-06-16days on market $599,000 Active 59 DOM
-
2026-06-15days on market $599,000 Active 58 DOM
-
2026-06-13days on market $599,000 Active 56 DOM
-
2026-06-09days on market $599,000 Active 52 DOM
-
2026-06-08days on market $599,000 Active 51 DOM
-
2026-06-07days on market $599,000 Active 50 DOM
-
2026-06-05days on market $599,000 Active 47 DOM
-
2026-06-03days on market $599,000 Active 46 DOM
-
2026-06-02days on market $599,000 Active 45 DOM
-
2026-06-01days on market $599,000 Active 44 DOM
-
2026-05-31days on market $599,000 Active 43 DOM
-
2026-04-18$650,000 Active 379-char remark
Show marketing remark (379 chars)
Great Owner Occupied or Investment 3 Unit Property. The 1st and 3rd Fl units are ready to be rented or lived in. Laminate Floors throughout, Newer Kitchens with Granite Counters and Newer Cabinets. 2nd Floor needs a little updatig to make a profitable investment. Ceramic Tiled Bathrooms. Parking for 4-5 Cars. Near All Amenities. .. Shopping, Schools, Highways, Restaurants Etc.
-
2024-07-28historical $1,200
-
2024-07-19$1,200
-
2013-12-19price $89,900
-
2013-12-19price $110,000
-
2013-12-19price $29,900
-
2011-08-19historical
-
2011-02-19$110,000
-
2010-12-31historical
-
2010-07-26$129,900
-
2009-12-30soldstatus $58,000
-
2009-11-12soldstatus $30,000
-
2009-06-15historical
-
2008-08-15soldstatus $209,901
-
2007-04-16$161,500
-
2005-08-10historical
-
2005-07-26soldstatus $242,000
-
2005-07-26soldstatus $242,000
-
2005-07-08$249,000
-
2005-07-06historical
-
2005-06-02$249,000
-
2002-04-25soldstatus $125,000
-
2001-04-27soldstatus $58,000
-
2001-03-29soldstatus $25,000
-
1999-07-19historical
-
1999-05-01$34,900
-
1989-02-22soldstatus $91,000
ⓘ Source: listings_history table (triggers on properties + properties_extension) + one-shot
backfill from property_details.listing_events for pre-trigger history.
Tax reassessment forecast RI · Partial reset (capped growth)
- Current annual tax
- $6,013 · $501/mo
- Projected year-2 tax
- $7,888 · $657/mo
- Expected delta
- +$1,875/yr (+$156/mo · 31.2%)
ⓘ Screening estimate from a state-policy table — verify with the county assessor before closing.
Climate risk First Street
- Flood 1/10 Low FEMA zone X (unshaded) · 0% chance over 30 yrs
- Wildfire 1/10 Low
- Heat 6/10 Major 7 d/yr ≥97°F today · 15 d/yr by 30 yrs out
- Wind 6/10 Major 75% chance of damaging wind over 30 yrs
- Air quality 2/10 Low 1 unhealthy d/yr today · 2 by 30 yrs out
Nearby sold comps map
Loading sold comps map…
Walkable amenities ~0.75 mi
Loading nearby amenities…
Taxation est. · year 1
- Rental income
- $104,448
- − Mortgage interest
- −$33,553
- − Property taxes
- −$6,013
- − Insurance
- −$2,995
- − Repairs & maintenance
- −$8,356
- − Management
- −$8,356
- − Depreciation
- −$17,425
- Taxable income
- $27,750
- Est. tax owed @ 24.0%
- −$6,660
- After-tax cash flow
- $29,151/yr
For passive investors: Depreciation is non-cash, so a rental often shows a tax loss while cash-flowing — sheltering income. Rental losses are passive: they offset passive income freely, and up to $25,000/yr can offset ordinary (W-2) income if you actively participate and your MAGI is under $100k (phasing out to $0 by $150k); unused losses carry forward. On sale, claimed depreciation is recaptured at up to 25%, and gains may owe capital-gains tax (a 1031 exchange can defer both). Figures are a year-1 estimate at your 24.0% rate — not tax advice; consult a CPA.
Schools (NCES district)
- District
- Providence
- NCES district ID
- 4400900
- Math proficiency
- 8% ▼ -4.00%
- Reading proficiency
- 16% ▼ -2.00%
- Median HH income
- $38,197
- Composite
- 10.12/100
- National rank
- #9803
- State rank
- #34 of 39 in RI
Livability — Providence
- Score
- 84/100
- State rank
- #2
- US rank
- #794
Category grades
Schools grade is shown separately in the Schools card above.
Census & demographics
- Census place
- Providence, RI
- County
- Providence County · 548,917 people
- City population
- 212,734
- Metro
- Providence-Warwick, RI-MA
- Population (ZIP)
- 31,461
- Household income
- $52,485
- Rent vs Own
- Severe rent burden
- 2189.0
Population outlook (Providence County) Hauer SSP2
- Today (2025)
- 653,469 people
- By 2030
- 660,819 · +1.1%
- By 2040
- 672,747 · +3.0%
- By 2050
- 683,741 · +4.6%
- By 2075
- 720,435 · +10.2%
- By 2100
- 741,582 · +13.5%
Race, ethnicity, and origin ACS 2023
- Neighborhood character
- Predominantly Hispanic (70%)
- Race & ethnicity
- Hispanic / Latino 70% Two or more races 26% Black 10% White 10% Asian 5% Native American 2%
- Hispanic origin (detail)
- Puerto Rican 7% Dominican 50%
- Common ancestry
- Swiss 1% Lithuanian 1% Hispanic 1%
- Foreign-born
- 55% · Canada, Jamaica, Philippines
- Languages at home
- 25% English-only · Spanish 67% Other Asian/Pacific 3% French/Haitian/Cajun 1%
Political lean MEDSL · Providence
- 2024 margin
- D (+14.4) · D 56.1% · R 41.7% · Other 2.2%
- 2008→2024 swing
- -20.0pp toward R · 2008: 34.4pp · 2024: 14.4pp
- All cycles
- 2024: D+14.4 2020: D+22.9 2016: D+21.2 2012: D+34.9 2008: D+34.4
Not yet ingested
- Civics
- —
Market trends
- HPI YoY
- ▼ -125.19%
- Current HPI
- 498.142
- Rent YoY
- ▲ 15.32%
- Metro
- Providence-Warwick, RI-MA
- State GDP YoY
- ▲ 2.25%
- F500 in state
- 10
Industry mix (Fortune 500 HQ in RI)
| Industry | F500 HQs | Revenue |
|---|---|---|
| Healthcare | 1 | $373B |
|
||
| Food Distribution | 1 | $31B |
|
||
| Aerospace / Defense | 1 | $14B |
|
||
| Financial Services | 1 | $8B |
|
||
| Consumer Goods | 1 | $4B |
|
||
Price history
+614.3% since first listed27 events — show timeline
- 2026-04-18 Listed $650,000 RIS
- 2024-07-28 Rental Removed $1,200 APPFOLIO
- 2024-07-19 Listed for Rent $1,200 APPFOLIO
- 2013-12-19 Price Changed $89,900 RIS
- 2013-12-19 Price Changed $110,000 RIS
- 2013-12-19 Price Changed $29,900 RIS
- 2011-08-19 Listing Removed — RIS
- 2011-02-19 Listed $110,000 RIS
- 2010-12-31 Listing Removed — RIS
- 2010-07-26 Listed $129,900 RIS
- 2009-12-30 Sold (Public Records) $58,000 Public Records
- 2009-11-12 Sold (Public Records) $30,000 Public Records
- 2009-06-15 Listing Removed — RIS
- 2008-08-15 Sold (Public Records) $209,901 Public Records
- 2007-04-16 Listed $161,500 RIS
- 2005-08-10 Listing Removed — RIS
- 2005-07-26 Sold (Public Records) $242,000 Public Records
- 2005-07-26 Sold (Public Records) $242,000 Public Records
- 2005-07-08 Listed $249,000 RIS
- 2005-07-06 Listing Removed — RIS
- 2005-06-02 Listed $249,000 RIS
- 2002-04-25 Sold (Public Records) $125,000 Public Records
- 2001-04-27 Sold (Public Records) $58,000 Public Records
- 2001-03-29 Sold (Public Records) $25,000 Public Records
- 1999-07-19 Listing Removed — RIS
- 1999-05-01 Listed $34,900 RIS
- 1989-02-22 Sold (Public Records) $91,000 Public Records
Property tax history
+4.5%/yrLatest (2025): $6,013 · +13.2% YoY. Source: county tax records.
Cash-flow waterfall
monthlySold comps — $/sqft
last 12 mo · ≤1 miLoading sold comps…