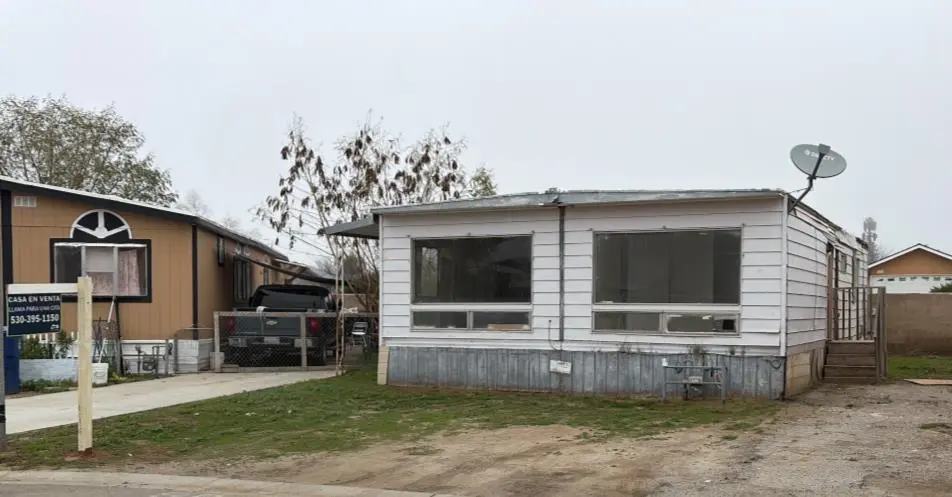
801 Schipper St #86 · Arvin, CA
Flood risk 1/10 · Minimal
- FEMA flood zone
- AO
- Chance of flooding over 30 yrs
- 0.0%
- Est. flood insurance / yr
- $848 – $2,087
Fire risk 5/10 · Moderate
- Est. fire insurance / yr
- $659 – $1,223
Heat risk 8/10 · Major
- Hot days now (above 104°F)
- 7 days/yr
- Hot days in 30 yrs
- 19 days/yr
Wind risk 1/10 · Minimal
- Chance of severe wind over 30 yrs
- —
Air-quality risk 9/10 · Severe
- Unhealthy air days now
- 19 days/yr
- Unhealthy air days in 30 yrs
- 25 days/yr
Risk factors via First Street. Map © Google.
Why this score? — see what drove the D+ grade
The composite is a weighted blend of 9 inputs, each scored 0–100. Each bar is that input's sub-score; the figure is the points it added to the 100-point composite (weight × sub-score).
- Cash flow +15.0/30.0
- ARV discount +11.0/15.0
- 1% rule +5.0/10.0
- DSCR +5.0/10.0
- Schools +3.4/10.0
- Rent growth +2.5/5.0
- Condition / age +2.5/5.0
- Livability +2.1/5.0
- Appreciation +0.0/10.0
$16,500
🖨 Deal sheet 📄 Offer letter ✓ Due diligence
Listing remarks
Welcome home to Casa Estate Arvin - the best up and coming community in Arvin!! This 2 bedroom, 1.5 bath home with a LARGE footprint is available for sale! Home does need A LOT of work - so bring your handyman and your imagination and get started on your dream home! All offers must be non-financed
Key facts
- 2 parking spots
- Built 1968
- Listed 119 days
Neighborhood map
What this means for you Summary
Snapshot
- This is a 2-bed/1.5-bath manufactured listed at $16k.
Deal economics
- At list price, monthly cash flow is $1k ($13k/yr) — positive.
- The deal already cash-flows at list — no discount required.
- Meets the 1% rule at list price ($2k rent vs $16k).
- Recommended offer: $15k (9.0% below list) — sets the bar for market timing.
Location & tenants
- Location reads 42/100 on livability (#1,368 in CA) — a working-class tenant base; expect higher turnover. Strengths: housing A+; Watch: cost of living D+, health & safety D+, schools F.
- Kern High (urban): math 21% / reading 51% proficiency, ranked #860 of 1,400 in CA (top 61%) — families likely to look elsewhere, expect single-tenant / working-renter base with shorter leases.
- Market conditions: 27 active listings in the ZIP; 5 comparable units currently listed for rent nearby; rentals leasing fast (median 3d on market — plan ~1-2 weeks tenant-placement turnaround); 3,244 units permitted in Kern County in 2024 (73 in 5+ unit buildings).
Forward outlook
- Local home prices are declining (-3.0%/yr); year-one equity from $114 of loan paydown is wiped out by about $495 of value loss. Plan a longer hold.
- Kern County population projected at +17% by 2050 — long-run rental-demand tailwind backs the buy-and-hold thesis.
- At projected returns (-3.0% appreciation + 3.0% rent growth), your $5k cash investment doubles in ~1 year — after that, you're playing with house money.
Negotiation context
- It's been on market 119 days — a 9% lower offer ($15k) is reasonable based on typical stale-listing flexibility.
Risks & watch-outs
- Watch-outs: flood insurance adds $122/mo.
- Climate carrying-cost: in FEMA flood zone AO (mandatory federal flood insurance); moderate wildfire risk; extreme-heat days projected 7→19/yr by 2055 (HVAC capex compounding) — expect insurance premiums to compound above CPI over the hold.
Questions for the listing agent
- It's been on market 119 days. Have you received any prior offers? Is the seller open to a 9% concession, seller financing, or rate buy-down credit?
- Built in 1968 — when were the roof, HVAC, electrical panel, plumbing, and water heater last replaced?
- What's the actual annual flood-insurance premium (NFIP or private), and is the property in a SFHA with mandatory coverage?
- Why hasn't it sold? Are there any deal-killer items the seller is aware of (foundation, flood, title, zoning, code violations)?
- Is there a deadline driving the sale (1031 exchange, divorce, estate, relocation)? That informs how much negotiation room exists.
- Schools are F-rated, which usually means shorter tenancies and higher turnover. Who's the typical renter profile here, and what's been the actual vacancy rate?
- Crime grade is F in this area — have there been break-ins, vandalism, or insurance claims at this property in the last 3 years? What carrier currently insures it and at what premium?
- The area grade is low — what's the realistic commute time and amenity access for the typical tenant pool here? Any planned neighborhood developments (good or bad) we should know about?
- What's the average days-on-market for RENTAL listings here right now (not sales)? A rising rental-DOM trend means longer vacancies and softer asking-rent achievability than the comps imply.
- What's the recent tenant-quality profile in this submarket — average credit score on applications, eviction rate, late-payment / NSF rate, and stable-employment percentage? A property-management company in the area should have these aggregated.
- How much new for-sale + rental construction is in the pipeline within 1–3 miles? Heavy new supply typically softens prices + rents 12–24 months out; constrained supply supports both.
Investment metrics
- 1% rule
- 10.03% ✓
- Cap rate
- 93.05%
- Cash-on-cash
- 309.83%
- DSCR
- 14.79
- GRM
- 0.8
CMA / ARV
- ARV (median comp)
- $17,874
- List price
- $16,500
- Delta
- -7.69%
- Verdict
- FAIR
- Comps
- 10 within 1.0 mi
Show comp detail 11 sales within ~0.75 mi
| Address | Dist | Beds/Ba | Sqft | Sold | Price | $/sf | Match |
|---|---|---|---|---|---|---|---|
| 801 Schipper St #86 | 0.00mi | 2/1.5 | 1,040 (0%) | 1mo | $10,000 | $10 | 99 |
| 801 Schipper St #46 | 0.07mi | 2/2.0 | 1,040 (0%) | 3mo | $9,500 | $9 | 93 |
| 801 Schipper St #48 | 0.07mi | 3/2.0 (+1) | 1,040 (0%) | 2mo | $77,500 | $75 | 88 |
| 801 Schipper St #23 | 0.07mi | 2/2.0 | 1,040 (0%) | 9mo | $7,500 | $7 | 87 |
| 801 Schipper St #66 | 0.07mi | 2/2.0 | 1,040 (0%) | 9mo | $79,990 | $77 | 87 |
| 801 Schipper St #41 | 0.07mi | 2/2.0 | 1,040 (0%) | 14mo | $75,000 | $72 | 83 |
| 801 Schipper St #30 | 0.07mi | 3/2.0 (+1) | 1,120 (+8%) | 5mo | $19,000 | $17 | 73 |
| 801 Schipper St #63 | 0.00mi | 3/2.0 (+1) | 960 (-8%) | 9mo | $75,000 | $78 | 73 |
| 801 Schipper St #89 | 0.00mi | 2/1.0 | 940 (-10%) | 15mo | $15,000 | $16 | 70 |
| 801 Schipper St #36 | 0.07mi | 2/2.0 | 920 (-12%) | 12mo | $26,000 | $28 | 66 |
| 801 Schipper St #47 | 0.07mi | 3/2.0 (+1) | 1,100 (+6%) | 18mo | $85,000 | $77 | 65 |
Match score weights: distance 35% · size 25% · config 20% · recency 20%. Top-matched comps best support the ARV.
Projected returns pro-forma
-3.0% appreciation · 3.0% rent growth · sell at horizon
- IRR
- —
- Equity multiple
- 15.20×
- Total profit
- $65,611
- Equity at exit
- $2,460
- IRR
- —
- Equity multiple
- 32.46×
- Total profit
- $145,338
- Equity at exit
- $1,427
Cash invested: $4,620 (down + closing). Projections, not guarantees.
Landlord ↔ Tenant lean methodology
- Overall (STATE)
- 18 Strongly Tenant-Friendly
- State California
- 18 Strongly Tenant-Friendly · D+13
- County
- — inherits STATE
- City
- — inherits STATE
ZIP-level market 93203
- Home prices YoY
- -5.4%
- Active inventory
- 27
- Price-to-rent
- 0.8×
Monthly cashflow live
- Estimated rent
- $1,654 high interval (Pro) →
- Mortgage (P&I)
- −$87
- Tax est. 1.5%
- −$21 /mo · $248/yr
- Insurance
- −$7
- Flood insurance flood zone
- −$122 /mo · $1,468/yr
- HOA
- −$0
- Vacancy / Maint / Mgmt
- −$347
- Net cashflow
- $1,071
Break-even live
UW: 25.0% down · 7.5% · 30yr · 1.5% tax · 5.0% vac · 8.0% maint · 8.0% mgmt
Financing live
Cash to close
- Down payment
- $4,125
- Closing costs
- $495
- Reserves months
- —
- Total cash needed
- —
Loan-product check · same deal, 3 products live
Conventional
25% down · 7.5% · 30yr
- Down + closing
- —
- Monthly P&I
- —
- Monthly cashflow
- —
- DSCR
- —
- Eligible?
- —
Personal DTI + credit; lowest rate.
DSCR
20% down · 8.5% · 30yr
- Down + closing
- —
- Monthly P&I
- —
- Monthly cashflow
- —
- DSCR
- —
- Eligible?
- —
No personal income docs; deal must DSCR.
Hard money
10% down · 12.0% · 12mo
- Down + closing
- —
- Monthly P&I
- —
- Monthly cashflow
- —
- DSCR
- —
- Eligible?
- —
Short-term bridge; refi at stabilization.
Rent comps 5 comps
| Address | Beds | Baths | Sqft | Rent | $/sqft | DOM | Units | Dist |
|---|---|---|---|---|---|---|---|---|
| 1315 Verde Ct Arvin, CA | 3.0 | 2.0 | 1428 | $1,800 | $1.26 | 18d | 1 | 0.30mi |
| 2304 Hacienda Pl Arvin, CA | 3.0 | 2.0 | 1220 | $2,475 | $2.03 | 43d | 1 | 0.55mi |
| 668 Comanche Dr Arvin, CA | 3.0 | 2.0 | 1080 | $1,329 | $1.23 | 2d | 1 | 0.64mi |
| 225 Meyer St Arvin, CA | 2.0 | 1.0 | 788 | $1,036 | $1.31 | 2d | 1 | 0.87mi |
| 200 Haven Dr Apt B Arvin, CA | 2.0 | 1.0 | 850 | $995 | $1.17 | 2d | 1 | 0.88mi |
Climate risk First Street
- Flood 1/10 Low FEMA zone AO · 0% chance over 30 yrs
- Wildfire 5/10 Major
- Heat 8/10 Severe 7 d/yr ≥104°F today · 19 d/yr by 30 yrs out
- Wind 1/10 Low
- Air quality 9/10 Extreme 19 unhealthy d/yr today · 25 by 30 yrs out
Nearby sold comps map
Loading sold comps map…
Walkable amenities ~0.75 mi
Loading nearby amenities…
Taxation est. · year 1
- Rental income
- $19,851
- − Mortgage interest
- −$924
- − Property taxes
- −$248
- − Insurance
- −$1,550
- − Repairs & maintenance
- −$1,588
- − Management
- −$1,588
- − Depreciation
- −$480
- Taxable income
- $13,473
- Est. tax owed @ 24.0%
- −$3,234
- After-tax cash flow
- $9,613/yr
For passive investors: Depreciation is non-cash, so a rental often shows a tax loss while cash-flowing — sheltering income. Rental losses are passive: they offset passive income freely, and up to $25,000/yr can offset ordinary (W-2) income if you actively participate and your MAGI is under $100k (phasing out to $0 by $150k); unused losses carry forward. On sale, claimed depreciation is recaptured at up to 25%, and gains may owe capital-gains tax (a 1031 exchange can defer both). Figures are a year-1 estimate at your 24.0% rate — not tax advice; consult a CPA.
Schools (NCES district)
- District
- Kern High
- NCES district ID
- 0619540
- Math proficiency
- 21% ▬ 0.00%
- Reading proficiency
- 51% ▲ 2.00%
- Median HH income
- $49,686
- Composite
- 33.68/100
- National rank
- #10443
- State rank
- #860 of 1400 in CA
Livability — Arvin
- Score
- 42/100
- State rank
- #1368
- US rank
- #27087
Category grades
Schools grade is shown separately in the Schools card above.
Census & demographics
- Census place
- Arvin, CA
- Population (ZIP)
- 20,571
Population outlook (Kern County) Hauer SSP2
- Today (2025)
- 947,286 people
- By 2030
- 978,984 · +3.3%
- By 2040
- 1,045,018 · +10.3%
- By 2050
- 1,105,232 · +16.7%
- By 2075
- 1,229,538 · +29.8%
- By 2100
- 1,238,059 · +30.7%
Race, ethnicity, and origin ACS 2023
- Neighborhood character
- Predominantly Hispanic (94%)
- Race & ethnicity
- Hispanic / Latino 94% Two or more races 29% White 4%
- Hispanic origin (detail)
- Mexican 91%
- Foreign-born
- 31% · Canada
- Languages at home
- 17% English-only · Spanish 83%
Political lean MEDSL · Kern
- 2024 margin
- Strong R (+21.1) · D 38.2% · R 59.3% · Other 2.5%
- 2008→2024 swing
- -3.3pp toward R · 2008: -17.8pp · 2024: -21.1pp
- All cycles
- 2024: R+21.1 2020: R+10.2 2016: R+15.0 2012: R+20.9 2008: R+17.8
Not yet ingested
- Civics
- —
Market trends
- HPI YoY
- ▼ -19.57%
- Current HPI
- 342.8562
- Rent YoY
- —
- Metro
- —
- State GDP YoY
- ▲ 3.21%
- F500 in state
- 116
Industry mix (Fortune 500 HQ in CA)
| Industry | F500 HQs | Revenue |
|---|---|---|
| Technology | 27 | $1,492B |
|
||
| Financial Services | 3 | $174B |
|
||
| Retail | 3 | $44B |
|
||
| Insurance | 3 | $26B |
|
||
| Media / Entertainment | 2 | $115B |
|
||
| Pharmaceuticals / Biotech | 2 | $62B |
|
||
Cash-flow waterfall
monthlySold comps — $/sqft
last 12 mo · ≤1 miLoading sold comps…