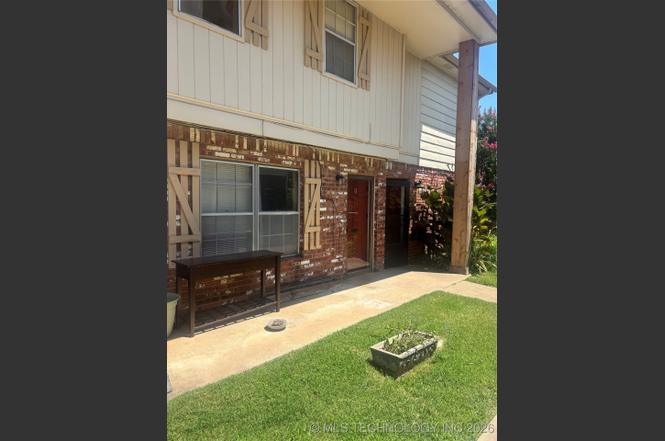
6156 S Madison Pl Unit B · Tulsa, OK
Flood risk 1/10 · Minimal
- FEMA flood zone
- X (shaded)
- Chance of flooding over 30 yrs
- 0.0%
- Est. flood insurance / yr
- $473 – $860
Fire risk 3/10 · Minor
- Est. fire insurance / yr
- $2,463 – $4,575
Heat risk 7/10 · Major
- Hot days now (above 111°F)
- 7 days/yr
- Hot days in 30 yrs
- 18 days/yr
Wind risk 3/10 · Minor
- Chance of severe wind over 30 yrs
- 4.0%
Air-quality risk 3/10 · Minor
- Unhealthy air days now
- 2 days/yr
- Unhealthy air days in 30 yrs
- 3 days/yr
Risk factors via First Street. Map © Google.
Why this score? — see what drove the C grade
The composite is a weighted blend of 9 inputs, each scored 0–100. Each bar is that input's sub-score; the figure is the points it added to the 100-point composite (weight × sub-score).
- Cash flow +22.3/30.0
- 1% rule +10.0/10.0
- ARV discount +7.5/15.0
- DSCR +7.1/10.0
- Livability +3.8/5.0
- Rent growth +2.7/5.0
- Condition / age +2.5/5.0
- Schools +0.8/10.0
- Appreciation +0.0/10.0
$64,999
🖨 Deal sheet 📄 Offer letter ✓ Due diligence
Listing remarks
Can be sold separately or in a Bundle for $799,000 (15) sold withMLS #'s 2531350, 2531364, 2531903, 2531374, 2531370, 2531378, 2531916, 2531749, 2531752, 2531759, 2531770, 2531774, 2531907, 2531912 New carpet being added
Key facts
- $250 HOA
- Community pool
- Built 1968
Property features AI
Finance
- Financial info: Pets allowed
- HOA & community: Homeowners association with a $250 monthly fee; HOA covers structure maintenance, sewer, trash and water; Community pool
Exterior
- Parking: No parking information provided
- Security: No safety shelter
- Utilities: Electricity available; Natural gas available; Public water; Public sewer
- Home design: Two-story property; Entry level: first floor
- Construction: Brick, HardiPlank, and wood frame construction; Asphalt/fiberglass roof; Slab foundation; Year built per public records
- Exterior features: No exterior features listed; Faces north
Interior
- Kitchen: Eat-in kitchen
- Bedrooms: Master bedroom with private bath (first floor); Additional bedroom with no bath (first floor)
- Flooring: Carpet; Tile
- Bathrooms: One full bathroom; One half bathroom; Master bath (full) on first floor; Hall half bath on first floor
- Heating & cooling: Central air conditioning; Gas heating with floor furnace
- Interior features: Aluminum window frames; Laminate countertops; No additional interior features listed
- Laundry & utility: Inside utility room; Washer and dryer included
Neighborhood map
What this means for you Summary
Snapshot
- This is a 2-bed/1.5-bath condo listed at $65k.
Deal economics
- At list price, monthly cash flow is $107 ($1k/yr) — positive.
- The deal already cash-flows at list — no discount required.
- Meets the 1% rule at list price ($1k rent vs $65k).
- Recommended offer: $57k (12.0% below list) — sets the bar for market timing.
- Cap rate 8.3% vs local median 3.9% in Tulsa — top-decile yield for the area; either an underpriced asset or a hidden risk that comps aren't pricing in. Stress-test before assuming the spread holds.
Location & tenants
- Location reads 75/100 on livability (#13 in OK, #4,058 nationally) — a middle-class / working-renter tenant base. Strengths: amenities A+, commute A+, cost of living A+; Watch: schools F, crime F, employment D-.
- Tulsa (urban): math 7% / reading 12% proficiency, ranked #250 of 270 in OK (top 93%) — low school quality limits family demand, transient renter base, plan for 1-2y turnover; 76% free/reduced lunch — lower-income household profile, screen leases tightly.
- Market conditions: Rents flat; 172 active listings in the ZIP; 38 comparable units currently listed for rent nearby; rentals leasing fast (median 3d on market — plan ~1-2 weeks tenant-placement turnaround); 2,818 units permitted in Tulsa County in 2024 (518 in 5+ unit buildings).
Forward outlook
- Local home prices are declining (-3.0%/yr); year-one equity from $449 of loan paydown is wiped out by about $2k of value loss. Plan a longer hold.
- Tulsa County population projected at +30% by 2050 — long-run rental-demand tailwind backs the buy-and-hold thesis.
Negotiation context
- It's been on market 325 days — a 12% lower offer ($57k) is reasonable based on typical stale-listing flexibility.
- 2 sale attempts since 34y ago; this cycle's ask has dropped $835k (93%) from the opening price — seller is motivated, your offer sets the floor, not the list.
Risks & watch-outs
- Watch-outs: HOA is 24% of rent.
- Climate carrying-cost: extreme-heat days projected 7→18/yr by 2055 (HVAC capex compounding) — expect insurance premiums to compound above CPI over the hold.
Questions for the listing agent
- It's been on market 325 days. Have you received any prior offers? Is the seller open to a 12% concession, seller financing, or rate buy-down credit?
- Built in 1968 — when were the roof, HVAC, electrical panel, plumbing, and water heater last replaced?
- What does the HOA fee cover, when was the last increase, and are there any pending special assessments or reserve-fund shortfalls?
- Any open or pending special assessments — roof, HVAC, plumbing, elevator, façade? What's the per-unit balance and payoff schedule, and is the seller paying it off at close or rolling it to the buyer?
- Why hasn't it sold? Are there any deal-killer items the seller is aware of (foundation, flood, title, zoning, code violations)?
- Is there a deadline driving the sale (1031 exchange, divorce, estate, relocation)? That informs how much negotiation room exists.
- Schools are F-rated, which usually means shorter tenancies and higher turnover. Who's the typical renter profile here, and what's been the actual vacancy rate?
- Crime grade is F in this area — have there been break-ins, vandalism, or insurance claims at this property in the last 3 years? What carrier currently insures it and at what premium?
- What's the average days-on-market for RENTAL listings here right now (not sales)? A rising rental-DOM trend means longer vacancies and softer asking-rent achievability than the comps imply.
- What's the recent tenant-quality profile in this submarket — average credit score on applications, eviction rate, late-payment / NSF rate, and stable-employment percentage? A property-management company in the area should have these aggregated.
- How much new apartment / multifamily construction is in the pipeline within 1–3 miles? Heavy new supply (>2% of stock underway) typically softens rents 12–24 months out; light construction supports rent growth.
Investment metrics
- 1% rule
- 1.57% ✓
- Cap rate
- 8.27%
- Cash-on-cash
- 7.06%
- DSCR
- 1.31
- GRM
- 5.3
CMA / ARV
No comps found within radius.
Projected returns pro-forma
-3.0% appreciation · 0.74% rent growth · sell at horizon
- IRR
- -9.0%
- Equity multiple
- 0.68×
- Total profit
- $-5,818
- Equity at exit
- $9,692
- IRR
- -4.4%
- Equity multiple
- 0.75×
- Total profit
- $-4,504
- Equity at exit
- $5,620
Cash invested: $18,200 (down + closing). Projections, not guarantees.
Landlord ↔ Tenant lean methodology
- Overall (STATE)
- 83 Strongly Landlord-Friendly
- State Oklahoma
- 83 Strongly Landlord-Friendly · R+20
- County
- — inherits STATE
- City
- — inherits STATE
ZIP-level market 74136
- Home prices YoY
- -31.4%
- Rents YoY
- 0.7%
- Active inventory
- 172
- Price-to-rent
- 5.3×
Monthly cashflow live
- Estimated rent
- $1,020 high interval (Pro) →
- Mortgage (P&I)
- −$341
- Tax est. 1.5%
- −$81 /mo · $975/yr
- Insurance
- −$27
- HOA
- −$250
- Vacancy / Maint / Mgmt
- −$214
- Net cashflow
- $107
Break-even live
UW: 25.0% down · 7.5% · 30yr · 1.5% tax · 5.0% vac · 8.0% maint · 8.0% mgmt
Financing live
Cash to close
- Down payment
- $16,250
- Closing costs
- $1,950
- Reserves months
- —
- Total cash needed
- —
Loan-product check · same deal, 3 products live
Conventional
25% down · 7.5% · 30yr
- Down + closing
- —
- Monthly P&I
- —
- Monthly cashflow
- —
- DSCR
- —
- Eligible?
- —
Personal DTI + credit; lowest rate.
DSCR
20% down · 8.5% · 30yr
- Down + closing
- —
- Monthly P&I
- —
- Monthly cashflow
- —
- DSCR
- —
- Eligible?
- —
No personal income docs; deal must DSCR.
Hard money
10% down · 12.0% · 12mo
- Down + closing
- —
- Monthly P&I
- —
- Monthly cashflow
- —
- DSCR
- —
- Eligible?
- —
Short-term bridge; refi at stabilization.
Rent comps 38 comps
| Address | Beds | Baths | Sqft | Rent | $/sqft | DOM | Units | Dist |
|---|---|---|---|---|---|---|---|---|
| 910 E 61st St Tulsa, OK | 1.0 | 1.0 | 700 | $926 | $1.32 | 3d | 1 | 0.07mi |
| 6345 S Madison Pl Unit 1 Tulsa, OK | 3.0 | 2.0 | 1080 | $1,100 | $1.02 | 3d | 1 | 0.16mi |
| 1110 E 60th St Tulsa, OK | 1.0–2.0 | 1.0–2.0 | 794 | $1,069 | $1.35 | 3d | 4 | 0.29mi |
| 1329 E 64th St Tulsa, OK | 1.0–2.0 | 1.0 | 624 | $1,149 | $1.84 | 1d | 2 | 0.40mi |
| 1337 E 61st St Tulsa, OK | 1.0–2.0 | 1.0 | 700 | $1,051 | $1.50 | 3d | 14 | 0.43mi |
| 6642 S Peoria Ave Tulsa, OK | 1.0–2.0 | 1.0 | 712 | $1,100 | $1.54 | 11d | 2 | 0.48mi |
| 1320 E 58th St Tulsa, OK | 1.0 | 1.0 | 980 | $1,200 | $1.22 | 21d | 1 | 0.48mi |
| 1037 E 57th Pl #5 Tulsa, OK | 1.0 | 1.5 | 1088 | $1,100 | $1.01 | 23d | 1 | 0.49mi |
| 5630 S Peoria Ave Unit 5630B-P Tulsa, OK | 1.0 | 1.0 | 650 | $925 | $1.42 | 3d | 1 | 0.54mi |
| 6732 S Peoria Ave Tulsa, OK | 1.0–2.0 | 1.0–2.0 | 810 | $926 | $1.14 | 2d | 4 | 0.55mi |
| 5628 S Peoria Ave Unit 5628A-P Tulsa, OK | 2.0 | 2.0 | 950 | $1,100 | $1.16 | 3d | 1 | 0.55mi |
| 5624 S Peoria Ave Unit 5624C-P Tulsa, OK | 2.0 | 1.0 | 850 | $1,000 | $1.18 | 3d | 1 | 0.57mi |
| 7901 Riverside Pkwy Tulsa, OK | 2.0 | 2.0 | 950 | $884 | $0.93 | 3d | 16 | 0.59mi |
| 5620 S Quaker Ave Unit 5620D-Q Tulsa, OK | 1.0 | 1.0 | 650 | $999 | $1.54 | 23d | 1 | 0.63mi |
| 5607 S Quaker Ave Unit 5607D-Q Tulsa, OK | 2.0 | 2.0 | 950 | $1,100 | $1.16 | 3d | 1 | 0.70mi |
| 6105 S Troost Ave Tulsa, OK | 2.0 | 2.0 | 1124 | $1,300 | $1.16 | 23d | 1 | 0.74mi |
| 6639 S Victor Ave Unit G203 Tulsa, OK | 1.0 | 1.0 | 800 | $850 | $1.06 | 23d | 1 | 0.93mi |
| 6639 S Victor Ave Unit G208 Tulsa, OK | 1.0 | 1.0 | 800 | $850 | $1.06 | 16d | 1 | 0.94mi |
| 1802 E 66th Pl Tulsa, OK | 1.0–2.0 | 1.0–2.0 | 695 | $1,100 | $1.58 | 21d | 3 | 0.98mi |
| 1802 E 66th Pl Tulsa, OK | 1.0–2.0 | 1.0–2.0 | 562 | $995 | $1.77 | 3d | 1 | 0.98mi |
| 1804 E 66th Pl Unit E108 Tulsa, OK | 1.0 | 1.0 | 562 | $850 | $1.51 | 23d | 1 | 0.99mi |
| 6760 S Trenton Pl Tulsa, OK | 1.0 | 1.0 | 700 | $745 | $1.06 | 23d | 1 | 1.03mi |
| 6760 S Trenton Pl Tulsa, OK | 2.0 | 2.0 | 900 | $900 | $1.00 | 10d | 1 | 1.03mi |
| 5101 S Madison Ave Tulsa, OK | 1.0–2.0 | 1.0 | 780 | $1,150 | $1.47 | 1d | 2 | 1.07mi |
| 5121 S Madison Ave Tulsa, OK | 3.0 | 1.5 | 1048 | $1,550 | $1.48 | 11d | 1 | 1.09mi |
| 6630 S Zunis Ave Tulsa, OK | 1.0–3.0 | 1.0–2.0 | 1000 | $1,044 | $1.04 | 1d | 12 | 1.12mi |
| 2218 E 59th St Tulsa, OK | 1.0–2.0 | 1.0 | 787 | $1,199 | $1.52 | 3d | 4 | 1.20mi |
| 1818 E 71st St Tulsa, OK | 2.0 | 1.0–2.0 | 700 | $1,062 | $1.52 | 1d | 37 | 1.24mi |
| 5151 S Utica Ave Tulsa, OK | 1.0–2.0 | 1.0 | 799 | $838 | $1.05 | 1d | 1 | 1.30mi |
| 2409 E 59th Ct Unit 2433-4 Tulsa, OK | 1.0 | 1.0 | 565 | $675 | $1.19 | 19d | 1 | 1.31mi |
| 6609 S Lewis Ave Tulsa, OK | 1.0 | 1.0 | 600 | $816 | $1.36 | 2d | 5 | 1.32mi |
| 7224 S Elwood Ave Tulsa, OK | 1.0–2.0 | 1.0–2.0 | 948 | $1,790 | $1.89 | 1d | 6 | 1.35mi |
| 737 W 71st St S Tulsa, OK | 1.0–2.0 | 1.0 | 920 | $1,000 | $1.09 | 14d | 12 | 1.41mi |
| 737 W 71st St S Unit 102 Tulsa, OK | 2.0 | 1.0 | 869 | $900 | $1.04 | 23d | 1 | 1.41mi |
| 737 W 71st St S Unit 108 Tulsa, OK | 2.0 | 1.0 | 869 | $1,000 | $1.15 | 23d | 1 | 1.41mi |
| 5009 S Troost Ave Tulsa, OK | 2.0 | 1.0 | 886 | $1,400 | $1.58 | 23d | 1 | 1.43mi |
| 1514 E 49th St Tulsa, OK | 3.0 | 1.0 | 980 | $1,295 | $1.32 | 16d | 1 | 1.47mi |
| 4740 S Boston Ave Tulsa, OK | 2.0 | 1.0 | 839 | $1,475 | $1.76 | 3d | 1 | 1.48mi |
HOA detail condo
- Monthly dues
- $250 · $3,000/yr
- Assessments
- None detected in remarks — confirm with the listing agent.
Listing history 21 events
-
2026-06-18days on market $64,999 Active 325 DOM
-
2026-06-17days on market $64,999 Active 324 DOM
-
2026-06-16days on market $64,999 Active 323 DOM
-
2026-06-15days on market $64,999 Active 322 DOM
-
2026-06-13days on market $64,999 Active 320 DOM
-
2026-06-10days on market $64,999 Active 317 DOM
-
2026-06-09days on market $64,999 Active 316 DOM
-
2026-06-08days on market $64,999 Active 315 DOM
-
2026-06-07days on market $64,999 Active 314 DOM
-
2026-06-05days on market $64,999 Active 311 DOM
-
2026-06-03days on market $64,999 Active 310 DOM
-
2026-06-02days on market $64,999 Active 309 DOM
-
2026-06-01days on market $64,999 Active 308 DOM
-
2026-05-31days on market $64,999 Active 307 DOM
-
2026-03-23price $64,999
-
2026-03-11price $51,999
-
2025-11-07price $74,999
-
2025-10-15price $799,000
-
2025-07-28$899,999 Active
-
1993-03-16historical
-
1992-09-16$17,995
ⓘ Source: listings_history table (triggers on properties + properties_extension) + one-shot
backfill from property_details.listing_events for pre-trigger history.
Climate risk First Street
- Flood 1/10 Low FEMA zone X (shaded) · 0% chance over 30 yrs
- Wildfire 3/10 Moderate
- Heat 7/10 Severe 7 d/yr ≥111°F today · 18 d/yr by 30 yrs out
- Wind 3/10 Moderate 4% chance of damaging wind over 30 yrs
- Air quality 3/10 Moderate 2 unhealthy d/yr today · 3 by 30 yrs out
Nearby sold comps map
Loading sold comps map…
Walkable amenities ~0.75 mi
Loading nearby amenities…
Taxation est. · year 1
- Rental income
- $12,246
- − Mortgage interest
- −$3,641
- − Property taxes
- −$975
- − Insurance
- −$325
- − Repairs & maintenance
- −$980
- − Management
- −$980
- − HOA
- −$3,000
- − Depreciation
- −$1,891
- Taxable income
- $455
- Est. tax owed @ 24.0%
- −$109
- After-tax cash flow
- $1,175/yr
For passive investors: Depreciation is non-cash, so a rental often shows a tax loss while cash-flowing — sheltering income. Rental losses are passive: they offset passive income freely, and up to $25,000/yr can offset ordinary (W-2) income if you actively participate and your MAGI is under $100k (phasing out to $0 by $150k); unused losses carry forward. On sale, claimed depreciation is recaptured at up to 25%, and gains may owe capital-gains tax (a 1031 exchange can defer both). Figures are a year-1 estimate at your 24.0% rate — not tax advice; consult a CPA.
Schools (NCES district)
- District
- Tulsa
- NCES district ID
- 4030240
- Math proficiency
- 7% ▼ -9.00%
- Reading proficiency
- 12% ▼ -7.00%
- Median HH income
- $37,895
- Composite
- 8.04/100
- National rank
- #9919
- State rank
- #250 of 270 in OK
Livability — Tulsa
- Score
- 75/100
- State rank
- #13
- US rank
- #4058
Category grades
Schools grade is shown separately in the Schools card above.
Census & demographics
- Census place
- Tulsa, OK
- County
- Tulsa County · 640,811 people
- City population
- 389,418
- Metro
- Tulsa, OK
- Population (ZIP)
- 31,416
- Household income
- $51,820
- Rent vs Own
- Severe rent burden
- 2579.0
Population outlook (Tulsa County) Hauer SSP2
- Today (2025)
- 723,846 people
- By 2030
- 766,033 · +5.8%
- By 2040
- 851,386 · +17.6%
- By 2050
- 938,389 · +29.6%
- By 2075
- 1,166,011 · +61.1%
- By 2100
- 1,350,277 · +86.5%
Race, ethnicity, and origin ACS 2023
- Neighborhood character
- Diverse neighborhood (Simpson 0.66)
- Race & ethnicity
- White 55% Black 16% Two or more races 13% Hispanic / Latino 10% Asian 7% Native American 2%
- Hispanic origin (detail)
- Mexican 6%
- Common ancestry
- Slovak 2% Lithuanian 2% Italian 1%
- Foreign-born
- 14% · Canada, Philippines
- Languages at home
- 83% English-only · Spanish 8% Other Asian/Pacific 5% Other Indo-European 1%
Political lean MEDSL · Tulsa
- 2024 margin
- R (+15.2) · D 41.3% · R 56.5% · Other 2.2%
- 2008→2024 swing
- +9.2pp toward D · 2008: -24.5pp · 2024: -15.2pp
- All cycles
- 2024: R+15.2 2020: R+15.6 2016: R+22.9 2012: R+27.4 2008: R+24.5
Not yet ingested
- Civics
- —
Market trends
- HPI YoY
- ▼ -98.51%
- Current HPI
- 215.3642
- Rent YoY
- ▲ 0.74%
- Metro
- Tulsa, OK
- State GDP YoY
- ▲ 1.55%
- F500 in state
- 6
Industry mix (Fortune 500 HQ in OK)
| Industry | F500 HQs | Revenue |
|---|---|---|
| Energy | 3 | $48B |
|
||
Price history
+261.2% since first listed7 events — show timeline
- 2026-03-23 Price Changed $64,999 MLS Technology, Inc.
- 2026-03-11 Price Changed $51,999 MLS Technology, Inc.
- 2025-11-07 Price Changed $74,999 MLS Technology, Inc.
- 2025-10-15 Price Changed $799,000 MLS Technology, Inc.
- 2025-07-28 Listed $899,999 MLS Technology, Inc.
- 1993-03-16 Listing Removed — MLS Technology, Inc.
- 1992-09-16 Listed $17,995 MLS Technology, Inc.
Cash-flow waterfall
monthlySold comps — $/sqft
last 12 mo · ≤1 miLoading sold comps…