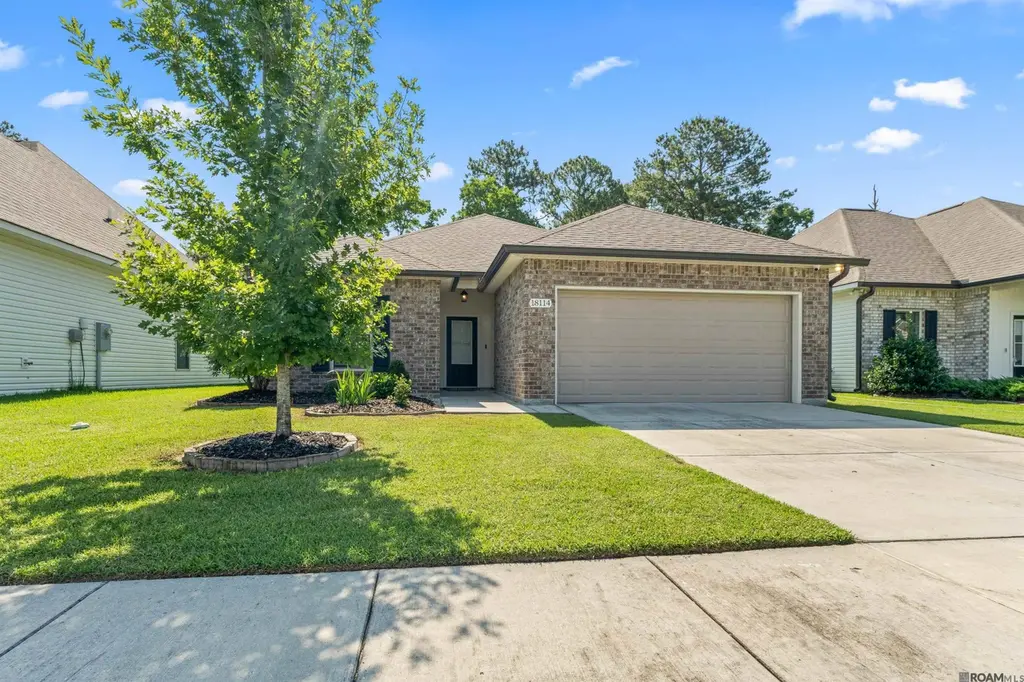
18114 Terraceside Dr · Prairieville, LA
Flood risk No data
- FEMA flood zone
- —
- Chance of flooding over 30 yrs
- —
- Est. flood insurance / yr
- —
Fire risk No data
- Est. fire insurance / yr
- —
Heat risk No data
- Hot days now (above threshold)
- —
- Hot days in 30 yrs
- —
Wind risk No data
- Chance of severe wind over 30 yrs
- —
Air-quality risk No data
- Unhealthy air days now
- —
- Unhealthy air days in 30 yrs
- —
Risk factors via First Street. Map © Google.
Why this score? — see what drove the D- grade
The composite is a weighted blend of 9 inputs, each scored 0–100. Each bar is that input's sub-score; the figure is the points it added to the 100-point composite (weight × sub-score).
- Cash flow +10.9/30.0
- ARV discount +5.2/15.0
- Schools +4.7/10.0
- Livability +3.5/5.0
- Rent growth +3.4/5.0
- DSCR +3.1/10.0
- 1% rule +2.6/10.0
- Condition / age +2.5/5.0
- Appreciation +0.0/10.0
$259,000
🖨 Deal sheet 📄 Offer letter ✓ Due diligence
Listing remarks MLS
The PROSPECT IV G in Lakeside Terrace community offers a 3 bedroom, 2 full bathroom, open design. Upgrades include luxury vinyl plank flooring in the bedrooms, LED lighting packages, and more! Special Features: soaking tub, separate shower, and walk-in closet in the master suite, covered rear patio, recessed can lighting, granite counters, undermount sinks, birch cabinets throughout, luxury vinyl plank flooring in the living room, halls, and all wet areas, ceiling fans in the living room and master bedroom, Tuscan bronze plumbing fixtures, smoke and carbon monoxide detectors, automatic garage door with 2 remotes, seasonal landscaping package, architectural 30-year shingles, and more! Energy Efficient Features: Frigidaire stainless appliances, low E tilt-in windows, radiant barrier roof decking, and more! Virtual tour for this listing if of a similar floor plan.
Key facts
- Soaking tub
- Undermount sinks
- Granite countertops
Tags
Property features AI
Finance
- Other: Subdivision: Lakeside Terrace
- HOA & community: Homeowners association with annual fee of $560 (about $46.67/month)
Exterior
- Parking: Attached garage with garage door opener; Driveway; Total 2 parking spaces
- Security: Security system; Smoke detectors
- Utilities: Public water; Public sewer; Cable connected
- Home design: Single-family detached home; Residential property
- Construction: Built by Dsld, LLC; Vinyl siding, frame, and brick exterior; Shingle roof; Slab foundation; Model: Prospect Iv G
- Exterior features: Rain gutters; Covered patio; Partial fencing; Level lot
Interior
- Kitchen: Electric cooktop; Dishwasher; Garbage disposal; Microwave; Refrigerator; Stainless steel appliances
- Flooring: Tile; Vinyl; Other
- Bathrooms: 2 full bathrooms
- Heating & cooling: Central heating; Central air; Ceiling fans
- Interior features: Walk-in closets; Breakfast bar; Eat-in kitchen; High ceilings; Window treatments
- Laundry & utility: Laundry room with inside washer and electric dryer hookups; Electric water heater
Neighborhood map
What this means for you Summary
Snapshot
- This is a 3-bed/2.0-bath single-family listed at $259k.
Deal economics
- At list price, monthly cash flow is $-116 ($-1k/yr) — negative.
- To cash-flow at today's rent, offer at most $239k (7.9% below list).
- To meet the 1% rule (rent ≥ 1% of price), the offer needs to be $196k (24.4% below list).
- Recommended offer: $196k (24.4% below list) — sets the bar for 1% rule.
- Cap rate 5.8% vs local median 4.3% in Prairieville — top-decile yield for the area; either an underpriced asset or a hidden risk that comps aren't pricing in. Stress-test before assuming the spread holds.
Location & tenants
- Location reads 69/100 on livability (#70 in LA) — a middle-class / working-renter tenant base. Strengths: schools A+, employment A+, housing A+; Watch: amenities F, commute F, health & safety F.
- Ascension Parish (suburban): math 48% / reading 58% proficiency, ranked #7 of 98 in LA (top 7%) — acceptable for families but not a draw, mixed tenant base, ~2y average lease.
- Market conditions: Rents rising (+3.5%/yr); 492 active listings in the ZIP; solid renter incomes; 579 units permitted in Ascension Parish in 2024 (0 in 5+ unit buildings).
Forward outlook
- Local home prices are declining (-3.0%/yr); year-one equity from $2k of loan paydown is wiped out by about $8k of value loss. Plan a longer hold.
- Ascension County population projected at +43% by 2050 — long-run rental-demand tailwind backs the buy-and-hold thesis.
Negotiation context
- It's been on market 18 days — a 2% lower offer ($255k) is reasonable based on typical stale-listing flexibility.
- 3 sale attempts since 5y ago with the ask held roughly flat each time — persistent listings suggest the price (not the market) is what's stuck; bring a comps-based counter.
Questions for the listing agent
- What do current leases actually rent for vs. the listed asking? Can we see a recent rent roll and the last 12 months of T-12 income?
- What does the HOA fee cover, when was the last increase, and are there any pending special assessments or reserve-fund shortfalls?
- Is there a deadline driving the sale (1031 exchange, divorce, estate, relocation)? That informs how much negotiation room exists.
- Schools are A-rated — typically a magnet for longer-tenancy family renters. What's the average tenant stay here, and is there a school-zone premium baked into asking?
- The area grade is low — what's the realistic commute time and amenity access for the typical tenant pool here? Any planned neighborhood developments (good or bad) we should know about?
- What's the average days-on-market for RENTAL listings here right now (not sales)? A rising rental-DOM trend means longer vacancies and softer asking-rent achievability than the comps imply.
- What's the recent tenant-quality profile in this submarket — average credit score on applications, eviction rate, late-payment / NSF rate, and stable-employment percentage? A property-management company in the area should have these aggregated.
- How much new for-sale + rental construction is in the pipeline within 1–3 miles? Heavy new supply typically softens prices + rents 12–24 months out; constrained supply supports both.
Investment metrics
- 1% rule
- 0.76% ✗
- Cap rate
- 5.76%
- Cash-on-cash
- -1.92%
- DSCR
- 0.91
- GRM
- 11.0
CMA / ARV
- ARV (on-the-fly)
- $246,352
- Comps found
- 12
Show comp detail 12 sales within ~0.75 mi
| Address | Dist | Beds/Ba | Sqft | Sold | Price | $/sf | Match |
|---|---|---|---|---|---|---|---|
| 18064 Terraceside Dr | 0.10mi | 3/2.0 | 1,422 (-0%) | 2mo | $245,000 | $172 | 94 |
| 43104 Pineside Ave | 0.20mi | 3/2.0 | 1,456 (+2%) | 2mo | $246,900 | $170 | 85 |
| 18219 Terraceside Dr | 0.20mi | 3/2.0 | 1,498 (+5%) | 1mo | $250,000 | $167 | 81 |
| 18275 Terraceside Dr | 0.30mi | 3/2.0 | 1,461 (+3%) | 2mo | $290,000 | $198 | 80 |
| 43125 Viewside Ave | 0.27mi | 3/2.0 | 1,498 (+5%) | 6mo | $255,000 | $170 | 74 |
| 18081 Terraceside Dr | 0.07mi | 3/2.0 | 1,498 (+5%) | 17mo | $265,000 | $177 | 74 |
| 43105 Viewside Ave | 0.27mi | 3/2.0 | 1,321 (-7%) | 3mo | $245,900 | $186 | 73 |
| 43119 Pointside Ave | 0.21mi | 3/2.0 | 1,593 (+12%) | 1mo | $264,000 | $166 | 69 |
| 43136 Pointside Ave | 0.24mi | 3/2.0 | 1,357 (-5%) | 15mo | $240,000 | $177 | 69 |
| 18154 River Landing Dr | 0.19mi | 3/2.0 | 1,547 (+9%) | 10mo | $255,500 | $165 | 68 |
| 18127 Terraceside Dr | 0.04mi | 3/2.0 | 1,593 (+12%) | 14mo | $274,900 | $173 | 67 |
| 18040 Terraceside Dr | 0.14mi | 3/2.0 | 1,321 (-7%) | 20mo | $249,900 | $189 | 65 |
Match score weights: distance 35% · size 25% · config 20% · recency 20%. Top-matched comps best support the ARV.
Projected returns pro-forma
-3.0% appreciation · 3.47% rent growth · sell at horizon
- IRR
- -19.0%
- Equity multiple
- 0.33×
- Total profit
- $-48,464
- Equity at exit
- $38,618
- IRR
- -10.8%
- Equity multiple
- 0.34×
- Total profit
- $-48,042
- Equity at exit
- $22,394
Cash invested: $72,520 (down + closing). Projections, not guarantees.
Landlord ↔ Tenant lean methodology
- Overall (STATE)
- 90 Strongly Landlord-Friendly
- State Louisiana
- 90 Strongly Landlord-Friendly · R+12
- County
- — inherits STATE
- City
- — inherits STATE
ZIP-level market 70769
- Rents YoY
- 3.5%
- Active inventory
- 492
- Price-to-rent
- 11.0×
Monthly cashflow live
- Estimated rent
- $1,959 medium interval (Pro) →
- Mortgage (P&I)
- −$1,358
- Tax from tax record
- −$150 /mo · $1,802/yr
- Insurance
- −$108
- HOA
- −$47
- Vacancy / Maint / Mgmt
- −$411
- Net cashflow
- $-116
Break-even live
UW: 25.0% down · 7.5% · 30yr · 1.5% tax · 5.0% vac · 8.0% maint · 8.0% mgmt
Financing live
Cash to close
- Down payment
- $64,750
- Closing costs
- $7,770
- Reserves months
- —
- Total cash needed
- —
Loan-product check · same deal, 3 products live
Conventional
25% down · 7.5% · 30yr
- Down + closing
- —
- Monthly P&I
- —
- Monthly cashflow
- —
- DSCR
- —
- Eligible?
- —
Personal DTI + credit; lowest rate.
DSCR
20% down · 8.5% · 30yr
- Down + closing
- —
- Monthly P&I
- —
- Monthly cashflow
- —
- DSCR
- —
- Eligible?
- —
No personal income docs; deal must DSCR.
Hard money
10% down · 12.0% · 12mo
- Down + closing
- —
- Monthly P&I
- —
- Monthly cashflow
- —
- DSCR
- —
- Eligible?
- —
Short-term bridge; refi at stabilization.
HOA detail
- Monthly dues
- $47 · $564/yr
- Likely covers
- landscaping
Listing history 14 events
-
2026-06-18days on market $259,000 Active 18 DOM
-
2026-06-17days on market $259,000 Active 17 DOM
-
2026-06-16days on market $259,000 Active 16 DOM
-
2026-06-15days on market $259,000 Active 15 DOM
-
2026-06-14days on market $259,000 Active 13 DOM
-
2026-06-10days on market $259,000 Active 10 DOM
-
2026-06-09days on market $259,000 Active 9 DOM
-
2026-06-08days on market $259,000 Active 8 DOM
-
2026-06-07days on market $259,000 Active 7 DOM
-
2026-06-05days on market $259,000 Active 4 DOM
-
2026-06-03days on market $259,000 Active 3 DOM
-
2026-06-02days on market $259,000 Active 2 DOM
-
2026-05-31remarks 699-char remark
-
2026-05-31$259,000 Active 1 DOM
ⓘ Source: listings_history table (triggers on properties + properties_extension) + one-shot
backfill from property_details.listing_events for pre-trigger history.
Tax reassessment forecast LA · Resets to sale price
- Current annual tax
- $1,802 · $150/mo
- Projected year-2 tax
- $1,802 · $150/mo
- Expected delta
- $0/yr ($0/mo · 0.0%)
ⓘ Screening estimate from a state-policy table — verify with the county assessor before closing.
Nearby sold comps map
Loading sold comps map…
Walkable amenities ~0.75 mi
Loading nearby amenities…
Taxation est. · year 1
- Rental income
- $23,505
- − Mortgage interest
- −$14,508
- − Property taxes
- −$1,802
- − Insurance
- −$1,295
- − Repairs & maintenance
- −$1,880
- − Management
- −$1,880
- − HOA
- −$564
- − Depreciation
- −$7,535
- Taxable loss
- −$5,959
- Est. tax savings @ 24.0%
- +$1,430
- After-tax cash flow
- $40/yr
For passive investors: Depreciation is non-cash, so a rental often shows a tax loss while cash-flowing — sheltering income. Rental losses are passive: they offset passive income freely, and up to $25,000/yr can offset ordinary (W-2) income if you actively participate and your MAGI is under $100k (phasing out to $0 by $150k); unused losses carry forward. On sale, claimed depreciation is recaptured at up to 25%, and gains may owe capital-gains tax (a 1031 exchange can defer both). Figures are a year-1 estimate at your 24.0% rate — not tax advice; consult a CPA.
Schools (NCES district)
- District
- Ascension Parish
- NCES district ID
- 2200090
- Math proficiency
- 48% ▼ -31.00%
- Reading proficiency
- 58% ▼ -25.00%
- Median HH income
- $68,423
- Composite
- 47.0/100
- National rank
- #2347
- State rank
- #7 of 98 in LA
Livability — Prairieville
- Score
- 69/100
- State rank
- #70
- US rank
- #8507
Category grades
Schools grade is shown separately in the Schools card above.
Census & demographics
- County
- Ascension Parish · 98,362 people
- City population
- 49,278
- Metro
- Baton Rouge, LA
- Population (ZIP)
- 49,278
- Household income
- $109,404
- Rent vs Own
- Severe rent burden
- 91.0
Population outlook (Ascension County) Hauer SSP2
- Today (2025)
- 145,480 people
- By 2030
- 158,329 · +8.8%
- By 2040
- 183,741 · +26.3%
- By 2050
- 207,615 · +42.7%
- By 2075
- 260,244 · +78.9%
- By 2100
- 289,576 · +99.0%
Race, ethnicity, and origin ACS 2023
- Neighborhood character
- Predominantly White (73%)
- Race & ethnicity
- White 73% Black 15% Two or more races 6% Hispanic / Latino 6% Asian 1%
- Hispanic origin (detail)
- Mexican 2%
- Common ancestry
- Lithuanian 16% Italian 1% Slovak 1%
- Foreign-born
- 4% · Canada
- Languages at home
- 93% English-only · Spanish 4% Other Indo-European 1%
Political lean MEDSL · Ascension
- 2024 margin
- Solid R (+34.0) · D 32.2% · R 66.1% · Other 1.7%
- 2008→2024 swing
- +1.7pp toward D · 2008: -35.7pp · 2024: -34.0pp
- All cycles
- 2024: R+34.0 2020: R+32.5 2016: R+36.0 2012: R+34.3 2008: R+35.7
Not yet ingested
- Civics
- —
Market trends
- HPI YoY
- ▼ -111.56%
- Current HPI
- 144.2267
- Rent YoY
- ▲ 3.47%
- Metro
- Baton Rouge, LA
- State GDP YoY
- ▲ 3.29%
- F500 in state
- 10
Industry mix (Fortune 500 HQ in LA)
| Industry | F500 HQs | Revenue |
|---|---|---|
| Telecommunications | 2 | $23B |
|
||
| Utilities | 1 | $12B |
|
||
| Wholesale / Distribution | 1 | $5B |
|
||
| Advertising | 1 | $2B |
|
||
Price history
+29.3% since first listed4 events — show timeline
- 2026-05-31 Listed $259,000 GBRMLS
- 2021-02-03 Sold (MLS) — GBRMLS
- 2021-01-08 Listed $200,245 AcadianaMLS
- 2021-01-08 Listed $200,245 GBRMLS
Property tax history
+24.0%/yrLatest (2025): $1,802 · -1.8% YoY. Source: county tax records.
Cash-flow waterfall
monthlySold comps — $/sqft
last 12 mo · ≤1 miLoading sold comps…