1753 Beverly Dr · Winding Cypress, FL
Flood risk 9/10 · Severe
- FEMA flood zone
- AE
- Chance of flooding over 30 yrs
- 0.99%
- Est. flood insurance / yr
- $1,737 – $8,500
Fire risk 5/10 · Moderate
- Est. fire insurance / yr
- $947 – $1,759
Heat risk 10/10 · Severe
- Hot days now (above 108°F)
- 5 days/yr
- Hot days in 30 yrs
- 20 days/yr
Wind risk 10/10 · Severe
- Chance of severe wind over 30 yrs
- 99.0%
Air-quality risk 3/10 · Minor
- Unhealthy air days now
- 3 days/yr
- Unhealthy air days in 30 yrs
- 3 days/yr
Risk factors via First Street. Map © Google.
Why this score? — see what drove the B grade
The composite is a weighted blend of 9 inputs, each scored 0–100. Each bar is that input's sub-score; the figure is the points it added to the 100-point composite (weight × sub-score).
- Cash flow +28.3/30.0
- DSCR +10.0/10.0
- ARV discount +7.5/15.0
- 1% rule +6.8/10.0
- Schools +5.0/10.0
- Appreciation +4.3/10.0
- Rent growth +3.3/5.0
- Livability +2.5/5.0
- Condition / age +2.5/5.0
$229,000
🖨 Deal sheet 📄 Offer letter ✓ Due diligence
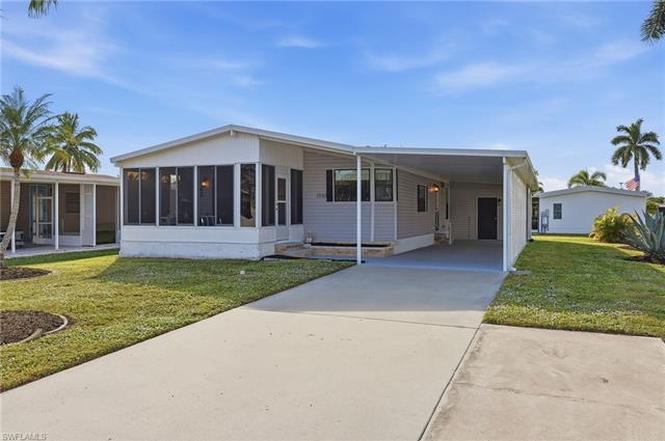
Listing remarks
Own your land in Naples with this bright 2-bedroom, 2-bath home in the Riverwood 55+ community. With extremely low HOA fees of just $225 per year and a deeded lot, this property offers affordable Florida living just minutes from Marco Island. Natural light fills the home, creating a warm and welcoming atmosphere from the moment you step inside. The layout feels open and comfortable, with spaces that flow easily for both quiet mornings and casual gatherings. The enclosed Florida room (2022) with sliding windows and screens is a standout feature — an ideal spot to enjoy morning coffee, unwind with a book, or open up the windows and let in the Florida breeze. An attached storage unit add
Key facts
- Community boat ramp
- Deeded lot
- Gulf access
Tags
Neighborhood map
What this means for you Summary
Snapshot
- This is a 2-bed/2.0-bath manufactured listed at $229k.
Deal economics
- At list price, monthly cash flow is $304 ($4k/yr) — positive.
- The deal already cash-flows at list — no discount required.
- Meets the 1% rule at list price ($3k rent vs $229k).
- Recommended offer: $215k (6.0% below list) — sets the bar for market timing.
Location & tenants
- Location reads: area grade B — affects rentability + tenant quality, not the cash-flow math above.
- Collier (suburban): math 60% / reading 56% proficiency, ranked #16 of 73 in FL (top 22%) — acceptable for families but not a draw, mixed tenant base, ~2y average lease.
- Market conditions: Rents rising (+3.2%/yr); 900 active listings in the ZIP; 22 comparable units currently listed for rent nearby; rentals at typical pace (median 23d on market — plan ~3-4 weeks tenant-placement turnaround); solid renter incomes; 3,520 units permitted in Collier County in 2024 (959 in 5+ unit buildings).
- This rent runs 36% of the median local income ($89k/yr) — at the standard rent-burdened threshold; future hikes will face affordability resistance.
Forward outlook
- Local home prices are declining (-1.5%/yr); year-one equity from $2k of loan paydown is wiped out by about $3k of value loss. Plan a longer hold.
- Collier County population projected at +30% by 2050 — long-run rental-demand tailwind backs the buy-and-hold thesis.
Negotiation context
- It's been on market 90 days — a 6% lower offer ($215k) is reasonable based on typical stale-listing flexibility.
- 5 sale attempts since 3y ago with the ask held roughly flat each time — persistent listings suggest the price (not the market) is what's stuck; bring a comps-based counter.
- Current owner paid $130k; list at $229k implies a 76% gain — meaningful room to come down on a strong offer.
Risks & watch-outs
- Watch-outs: flood insurance adds $427/mo.
- Climate carrying-cost: in FEMA flood zone AE (mandatory federal flood insurance); severe wind risk, 99% chance of damaging wind over 30y; moderate wildfire risk; extreme-heat days projected 5→20/yr by 2055 (HVAC capex compounding) — expect insurance premiums to compound above CPI over the hold.
Questions for the listing agent
- It's been on market 90 days. Have you received any prior offers? Is the seller open to a 6% concession, seller financing, or rate buy-down credit?
- What's the actual annual flood-insurance premium (NFIP or private), and is the property in a SFHA with mandatory coverage?
- What does the HOA fee cover, when was the last increase, and are there any pending special assessments or reserve-fund shortfalls?
- Why hasn't it sold? Are there any deal-killer items the seller is aware of (foundation, flood, title, zoning, code violations)?
- Is there a deadline driving the sale (1031 exchange, divorce, estate, relocation)? That informs how much negotiation room exists.
- What's the average days-on-market for RENTAL listings here right now (not sales)? A rising rental-DOM trend means longer vacancies and softer asking-rent achievability than the comps imply.
- What's the recent tenant-quality profile in this submarket — average credit score on applications, eviction rate, late-payment / NSF rate, and stable-employment percentage? A property-management company in the area should have these aggregated.
- How much new for-sale + rental construction is in the pipeline within 1–3 miles? Heavy new supply typically softens prices + rents 12–24 months out; constrained supply supports both.
Investment metrics
- 1% rule
- 1.18% ✓
- Cap rate
- 10.12%
- Cash-on-cash
- 13.68%
- DSCR
- 1.61
- GRM
- 7.1
CMA / ARV
No comps found within radius.
Projected returns pro-forma
-1.48% appreciation · 3.21% rent growth · sell at horizon
- IRR
- -0.7%
- Equity multiple
- 0.97×
- Total profit
- $-2,035
- Equity at exit
- $50,040
- IRR
- 6.8%
- Equity multiple
- 1.62×
- Total profit
- $39,976
- Equity at exit
- $48,202
Cash invested: $64,120 (down + closing). Projections, not guarantees.
Landlord ↔ Tenant lean methodology
- Overall (STATE)
- 87 Strongly Landlord-Friendly
- State Florida
- 87 Strongly Landlord-Friendly · R+3
- County
- — inherits STATE
- City
- — inherits STATE
ZIP-level market 34114
- Home prices YoY
- -0.6%
- Rents YoY
- 3.2%
- Active inventory
- 900
- Price-to-rent
- 7.1×
Monthly cashflow live
- Estimated rent
- $2,693 high interval (Pro) →
- Mortgage (P&I)
- −$1,201
- Tax from tax record
- −$81 /mo · $976/yr
- Insurance
- −$95
- Flood insurance flood zone
- −$427 /mo · $5,118/yr
- HOA
- −$19
- Vacancy / Maint / Mgmt
- −$566
- Net cashflow
- $304
Break-even live
UW: 25.0% down · 7.5% · 30yr · 1.5% tax · 5.0% vac · 8.0% maint · 8.0% mgmt
Financing live
Cash to close
- Down payment
- $57,250
- Closing costs
- $6,870
- Reserves months
- —
- Total cash needed
- —
Loan-product check · same deal, 3 products live
Conventional
25% down · 7.5% · 30yr
- Down + closing
- —
- Monthly P&I
- —
- Monthly cashflow
- —
- DSCR
- —
- Eligible?
- —
Personal DTI + credit; lowest rate.
DSCR
20% down · 8.5% · 30yr
- Down + closing
- —
- Monthly P&I
- —
- Monthly cashflow
- —
- DSCR
- —
- Eligible?
- —
No personal income docs; deal must DSCR.
Hard money
10% down · 12.0% · 12mo
- Down + closing
- —
- Monthly P&I
- —
- Monthly cashflow
- —
- DSCR
- —
- Eligible?
- —
Short-term bridge; refi at stabilization.
Rent comps 22 comps
| Address | Beds | Baths | Sqft | Rent | $/sqft | DOM | Units | Dist |
|---|---|---|---|---|---|---|---|---|
| 1747 Beverly Dr Naples, FL | 2.0 | 2.0 | 1080 | $2,300 | $2.13 | 23d | 1 | 0.03mi |
| 274 Riverwood Rd Unit 1546056P Naples, FL | 2.0 | 2.0 | 1496 | $4,451 | $2.98 | 13d | 1 | 0.15mi |
| 158 Rookery Rd Naples, FL | 3.0 | 2.0 | 1456 | $2,450 | $1.68 | 23d | 1 | 0.21mi |
| 1022 Manatee Rd Unit D107 Naples, FL | 2.0 | 2.0 | 1000 | $2,000 | $2.00 | 23d | 1 | 0.23mi |
| 1252 Henderson Creek Dr Naples, FL | 2.0 | 1.5 | 820 | $1,895 | $2.31 | 23d | 1 | 0.23mi |
| 1010 Manatee Rd Unit B304 Naples, FL | 2.0 | 2.0 | 1000 | $1,800 | $1.80 | 23d | 1 | 0.23mi |
| 1000 Manatee Rd Unit A201 Naples, FL | 2.0 | 2.0 | 1000 | $1,695 | $1.70 | 23d | 1 | 0.27mi |
| 1014 Manatee Rd Unit F307 Naples, FL | 2.0 | 2.0 | 900 | $1,800 | $2.00 | 23d | 1 | 0.29mi |
| 2000 Rookery Bay Dr Naples, FL | 1.0–3.0 | 1.0–2.0 | 929 | $1,772 | $1.91 | 23d | 9 | 0.36mi |
| 1212 Enbrook Loop Naples, FL | 2.0 | 2.0 | 1496 | $2,850 | $1.91 | 23d | 1 | 0.36mi |
| 6750 Beach Resort Dr #7 Naples, FL | 2.0 | 2.0 | 1351 | $3,900 | $2.89 | 23d | 1 | 0.77mi |
| 6750 Beach Resort Dr Naples, FL | 2.0 | 2.0 | 1351 | $3,200 | $2.37 | 13d | 2 | 0.77mi |
| 6680 Beach Resort Dr Unit 1214 Naples, FL | 2.0 | 2.0 | 1351 | $4,500 | $3.33 | 13d | 1 | 0.81mi |
| 6650 Beach Resort Dr Unit 908 Naples, FL | 2.0 | 2.0 | 1351 | $4,600 | $3.40 | 13d | 1 | 0.88mi |
| 2235 Yellowfin Cir Naples, FL | 2.0 | 2.0 | 1500 | $2,795 | $1.86 | 23d | 1 | 0.99mi |
| 6590 Beach Resort Dr Unit 305 Naples, FL | 2.0 | 2.0 | 1351 | $4,500 | $3.33 | 13d | 1 | 1.00mi |
| 4685 Hawks Nest Way #103 Naples, FL | 2.0 | 2.0 | 1440 | $6,500 | $4.51 | 13d | 1 | 1.25mi |
| 4680 Hawks Nest Way Unit D-103 Naples, FL | 2.0 | 2.0 | 1414 | $3,000 | $2.12 | 13d | 1 | 1.29mi |
| 9175 Celeste Dr Unit 105 Naples, FL | 2.0 | 2.0 | 1000 | $2,000 | $2.00 | 23d | 1 | 1.34mi |
| 9187 Celeste Dr Unit 1073494P Naples, FL | 2.0 | 2.0 | 1399 | $2,979 | $2.13 | 13d | 1 | 1.34mi |
| 9165 Celeste Dr Unit 3-303 Naples, FL | 2.0 | 2.0 | 1000 | $6,500 | $6.50 | 23d | 1 | 1.39mi |
| 1435 Santiago Cir #2003 Naples, FL | 3.0 | 2.5 | 1315 | $2,600 | $1.98 | 23d | 1 | 1.45mi |
HOA detail
- Monthly dues
- $19 · $228/yr
Listing history 19 events
-
2026-04-27status Pending
-
2026-03-20price $229,000
-
2026-02-03status Active
-
2026-01-22historical
-
2026-01-15$230,000 Active
-
2025-07-31historical
-
2025-03-05price $279,000
-
2025-02-11price $280,000
-
2024-12-04$285,000 Active
-
2024-10-14status Pending With Contingencies
-
2024-06-28historical
-
2024-06-28historical
-
2024-03-15status Active
-
2024-03-10status Pending With Contingencies
-
2024-02-06price $292,000
-
2024-01-11price $299,999
-
2023-11-30$305,000 Active
-
2004-03-08soldstatus $130,000
-
1990-04-01soldstatus $31,500
ⓘ Source: listings_history table (triggers on properties + properties_extension) + one-shot
backfill from property_details.listing_events for pre-trigger history.
Tax reassessment forecast FL · Resets to sale price
- Current annual tax
- $976 · $81/mo
- Projected year-2 tax
- $1,901 · $158/mo
- Expected delta
- +$924/yr (+$77/mo · 94.7%)
ⓘ Screening estimate from a state-policy table — verify with the county assessor before closing.
Climate risk First Street
- Flood 9/10 Extreme FEMA zone AE · 99% chance over 30 yrs
- Wildfire 5/10 Major
- Heat 10/10 Extreme 5 d/yr ≥108°F today · 20 d/yr by 30 yrs out
- Wind 10/10 Extreme 99% chance of damaging wind over 30 yrs
- Air quality 3/10 Moderate 3 unhealthy d/yr today · 3 by 30 yrs out
Nearby sold comps map
Loading sold comps map…
Walkable amenities ~0.75 mi
Loading nearby amenities…
Taxation est. · year 1
- Rental income
- $32,315
- − Mortgage interest
- −$12,828
- − Property taxes
- −$976
- − Insurance
- −$6,264
- − Repairs & maintenance
- −$2,585
- − Management
- −$2,585
- − HOA
- −$228
- − Depreciation
- −$6,662
- Taxable income
- $187
- Est. tax owed @ 24.0%
- −$45
- After-tax cash flow
- $3,605/yr
For passive investors: Depreciation is non-cash, so a rental often shows a tax loss while cash-flowing — sheltering income. Rental losses are passive: they offset passive income freely, and up to $25,000/yr can offset ordinary (W-2) income if you actively participate and your MAGI is under $100k (phasing out to $0 by $150k); unused losses carry forward. On sale, claimed depreciation is recaptured at up to 25%, and gains may owe capital-gains tax (a 1031 exchange can defer both). Figures are a year-1 estimate at your 24.0% rate — not tax advice; consult a CPA.
Schools (NCES district)
- District
- Collier
- NCES district ID
- 1200330
- Math proficiency
- 60% ▼ -4.00%
- Reading proficiency
- 56% ▼ -2.00%
- Median HH income
- $58,275
- Composite
- 50.23/100
- National rank
- #1892
- State rank
- #16 of 73 in FL
Livability — Winding Cypress
No livability data for this city. (Only ~50 U.S. cities are tracked.)
Census & demographics
- County
- Collier County · 396,295 people
- Metro
- Naples-Marco Island, FL
- Population (ZIP)
- 23,559
- Household income
- $89,334
- Rent vs Own
- Severe rent burden
- 550.0
Population outlook (Collier County) Hauer SSP2
- Today (2025)
- 420,858 people
- By 2030
- 450,054 · +6.9%
- By 2040
- 502,232 · +19.3%
- By 2050
- 544,932 · +29.5%
- By 2075
- 627,203 · +49.0%
- By 2100
- 659,015 · +56.6%
Race, ethnicity, and origin ACS 2023
- Neighborhood character
- Predominantly White (72%)
- Race & ethnicity
- White 72% Hispanic / Latino 17% Two or more races 13% Black 7%
- Hispanic origin (detail)
- Mexican 7% Puerto Rican 1% Cuban 3%
- Common ancestry
- Hispanic 5% Romanian 4% Lithuanian 1%
- Foreign-born
- 21% · Canada, Jamaica
- Languages at home
- 75% English-only · Spanish 15% French/Haitian/Cajun 5% Other Indo-European 4%
Political lean MEDSL · Collier
- 2024 margin
- Solid R (+33.1) · D 33.1% · R 66.2%
- 2008→2024 swing
- -10.6pp toward R · 2008: -22.5pp · 2024: -33.1pp
- All cycles
- 2024: R+33.1 2020: R+24.7 2016: R+26.0 2012: R+30.1 2008: R+22.5
Not yet ingested
- Civics
- —
Market trends
- HPI YoY
- ▼ -1.48%
- Current HPI
- 266.5545
- Rent YoY
- ▲ 3.21%
- Metro
- Naples-Marco Island, FL
- State GDP YoY
- ▲ 3.28%
- F500 in state
- 36
Industry mix (Fortune 500 HQ in FL)
| Industry | F500 HQs | Revenue |
|---|---|---|
| Industrial Technology | 2 | $29B |
|
||
| Insurance | 2 | $17B |
|
||
| Retail | 1 | $60B |
|
||
| Technology Distribution | 1 | $58B |
|
||
| Homebuilding | 1 | $35B |
|
||
| Technology Manufacturing | 1 | $35B |
|
||
Price history
+627.0% since first listed19 events — show timeline
- 2026-04-27 Pending — NAPLESMLS
- 2026-03-20 Price Changed $229,000 NAPLESMLS
- 2026-02-03 Relisted — NAPLESMLS
- 2026-01-22 Listing Removed — NAPLESMLS
- 2026-01-15 Listed $230,000 NAPLESMLS
- 2025-07-31 Listing Removed — NAPLESMLS
- 2025-03-05 Price Changed $279,000 NAPLESMLS
- 2025-02-11 Price Changed $280,000 NAPLESMLS
- 2024-12-04 Listed $285,000 NAPLESMLS
- 2024-10-14 Pending — NAPLESMLS
- 2024-06-28 Listing Removed — NAPLESMLS
- 2024-06-28 Listing Removed — NAPLESMLS
- 2024-03-15 Relisted — NAPLESMLS
- 2024-03-10 Pending — NAPLESMLS
- 2024-02-06 Price Changed $292,000 NAPLESMLS
- 2024-01-11 Price Changed $299,999 NAPLESMLS
- 2023-11-30 Listed $305,000 NAPLESMLS
- 2004-03-08 Sold (Public Records) $130,000 Public Records
- 1990-04-01 Sold (Public Records) $31,500 Public Records
Property tax history
+1.6%/yrLatest (2025): $976 · +7.7% YoY. Source: county tax records.
Cash-flow waterfall
monthlySold comps — $/sqft
last 12 mo · ≤1 miLoading sold comps…