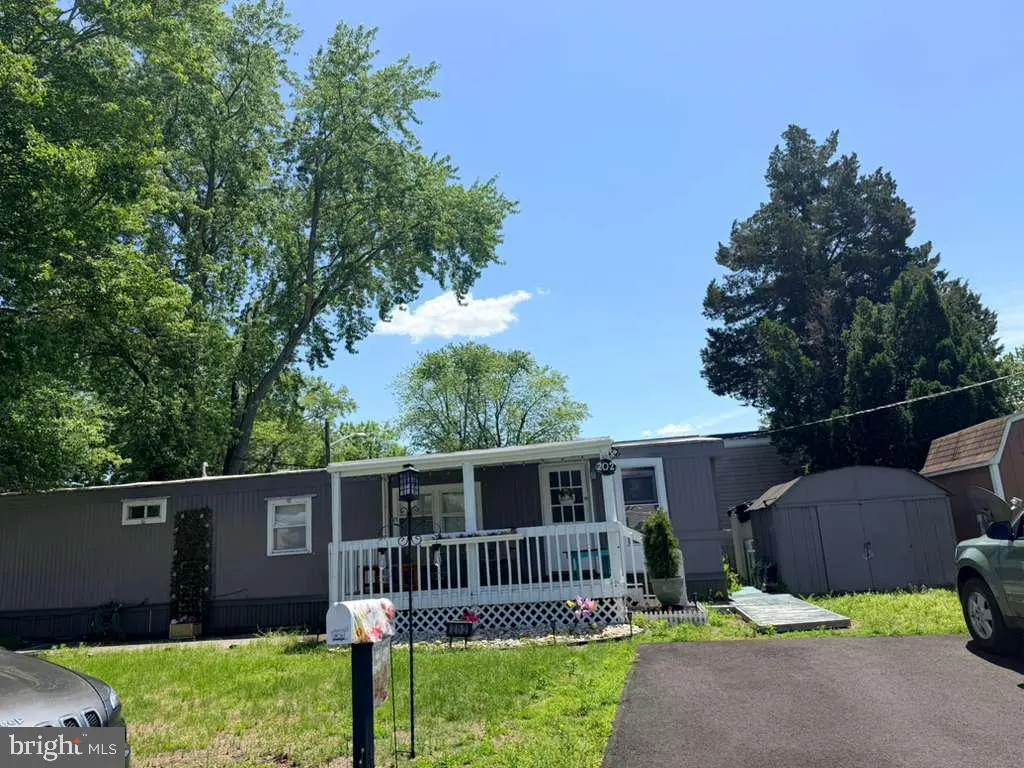
202 Florida Ave · Sicklerville, NJ
Flood risk No data
- FEMA flood zone
- —
- Chance of flooding over 30 yrs
- —
- Est. flood insurance / yr
- —
Fire risk No data
- Est. fire insurance / yr
- —
Heat risk No data
- Hot days now (above threshold)
- —
- Hot days in 30 yrs
- —
Wind risk No data
- Chance of severe wind over 30 yrs
- —
Air-quality risk No data
- Unhealthy air days now
- —
- Unhealthy air days in 30 yrs
- —
Risk factors via First Street. Map © Google.
Why this score? — see what drove the B- grade
The composite is a weighted blend of 9 inputs, each scored 0–100. Each bar is that input's sub-score; the figure is the points it added to the 100-point composite (weight × sub-score).
- Cash flow +30.0/30.0
- 1% rule +10.0/10.0
- DSCR +10.0/10.0
- ARV discount +8.9/15.0
- Schools +3.0/10.0
- Rent growth +2.5/5.0
- Livability +2.5/5.0
- Condition / age +2.2/5.0
- Appreciation +0.0/10.0
$63,500
🖨 Deal sheet 📄 Offer letter ✓ Due diligence
Listing remarks MLS
Please apply to the park as your first step for approval. Application fee is $45 per person (money order) and all occupants over 18 yr old must apply. A completed pet profile must be done prior to the application whether applicant has pets or not. Park requirements are FICO score min 600 and net income of $2,342/month.
Key facts
- Newer kitchen
- Storage shed
- Updated flooring
Tags
Property features AI
Finance
- HOA & community: Land lease of $880 monthly; Approximately 99 years of land lease remaining
Exterior
- Parking: Driveway
- Utilities: Public water; Public sewer; Electric hot water
- Home design: Manufactured home; Vinyl siding; Above-grade living space (estimated 840 finished)
- Construction: Vinyl siding construction; Above-grade structure
- Exterior features: 2+ access exits
Interior
- Bedrooms: 2 bedrooms on the main level
- Bathrooms: 1 full bathroom on the main level
- Heating & cooling: 90% forced air heating; Natural gas heating; Central air conditioning (electric)
- Interior features: Estimated living area; No basement
Neighborhood map
What this means for you Summary
Snapshot
- This is a 2-bed/1.0-bath single-family listed at $64k. Condition is rated fair.
Deal economics
- At list price, monthly cash flow is $1k ($16k/yr) — positive.
- The deal already cash-flows at list — no discount required.
- Meets the 1% rule at list price ($2k rent vs $64k).
- Recommended offer: $63k (1.5% below list) — sets the bar for market timing.
- Cap rate 31.2% vs local median 4.7% in Sicklerville — top-decile yield for the area; either an underpriced asset or a hidden risk that comps aren't pricing in. Stress-test before assuming the spread holds.
Location & tenants
- Location reads: area grade B — affects rentability + tenant quality, not the cash-flow math above.
- Monroe Township Public School District (suburban): math 20% / reading 45% proficiency, ranked #302 of 472 in NJ (top 64%) — families likely to look elsewhere, expect single-tenant / working-renter base with shorter leases.
- Market conditions: 268 active listings in the ZIP; 4 comparable units currently listed for rent nearby; rentals leasing fast (median 4d on market — plan ~1-2 weeks tenant-placement turnaround); solid renter incomes; 1,047 units permitted in Gloucester County in 2024 (183 in 5+ unit buildings).
Forward outlook
- Local home prices are declining (-3.0%/yr); year-one equity from $439 of loan paydown is wiped out by about $2k of value loss. Plan a longer hold.
- Gloucester County population projected to shrink 5% by 2050 — rents likely to lag national; underwrite the cash flow, not the appreciation.
- At projected returns (-3.0% appreciation + 3.0% rent growth), your $18k cash investment doubles in ~2 years — after that, you're playing with house money.
Negotiation context
- It's been on market 17 days — a 2% lower offer ($63k) is reasonable based on typical stale-listing flexibility.
- 2 sale attempts since 3y ago; this cycle's ask has dropped $5k (7%) from the opening price — seller is motivated, your offer sets the floor, not the list.
- Current owner paid $38k; list at $64k implies a 67% gain — meaningful room to come down on a strong offer.
Questions for the listing agent
- Have any recent inspections been done? Can we get a copy of the seller's disclosures and any deferred-maintenance estimates?
- Built in 1972 — when were the roof, HVAC, electrical panel, plumbing, and water heater last replaced?
- Is there a deadline driving the sale (1031 exchange, divorce, estate, relocation)? That informs how much negotiation room exists.
- What's the average days-on-market for RENTAL listings here right now (not sales)? A rising rental-DOM trend means longer vacancies and softer asking-rent achievability than the comps imply.
- What's the recent tenant-quality profile in this submarket — average credit score on applications, eviction rate, late-payment / NSF rate, and stable-employment percentage? A property-management company in the area should have these aggregated.
- How much new for-sale + rental construction is in the pipeline within 1–3 miles? Heavy new supply typically softens prices + rents 12–24 months out; constrained supply supports both.
Investment metrics
- 1% rule
- 3.50% ✓
- Cap rate
- 31.20%
- Cash-on-cash
- 88.95%
- DSCR
- 4.96
- GRM
- 2.4
CMA / ARV
- ARV (on-the-fly)
- $65,520
- Comps found
- 9
Show comp detail 9 sales within ~0.75 mi
| Address | Dist | Beds/Ba | Sqft | Sold | Price | $/sf | Match |
|---|---|---|---|---|---|---|---|
| 237 Harrison Ave | 0.04mi | 3/1.0 (+1) | 840 (0%) | 14mo | $25,000 | $30 | 82 |
| 211 Kennedy Ave | 0.04mi | 2/1.0 | 860 (+2%) | 19mo | $59,000 | $69 | 78 |
| 211 Ohio Ave | 0.11mi | 2/1.0 | 768 (-9%) | 5mo | $53,000 | $69 | 76 |
| 407 Kennedy Ave | 0.14mi | 2/1.5 | 840 (0%) | 24mo | $67,000 | $80 | 72 |
| 205 Michigan Ave | 0.14mi | 2/2.0 | 910 (+8%) | 7mo | $89,500 | $98 | 70 |
| 1540 N Tuckahoe Rd | 0.43mi | 3/1.5 (+1) | 804 (-4%) | 5mo | $45,000 | $56 | 61 |
| 318 Kentucky Ave | 0.14mi | 2/1.0 | 960 (+14%) | 11mo | $75,000 | $78 | 60 |
| 301 Arizona Ave | 0.33mi | 3/1.0 (+1) | 900 (+7%) | 12mo | $73,352 | $82 | 58 |
| 209 Hewitt Rd | 0.65mi | 2/1.0 | 768 (-9%) | 11mo | $305,000 | $397 | 46 |
Match score weights: distance 35% · size 25% · config 20% · recency 20%. Top-matched comps best support the ARV.
Projected returns pro-forma
-3.0% appreciation · 3.0% rent growth · sell at horizon
- IRR
- 89.6%
- Equity multiple
- 5.14×
- Total profit
- $73,683
- Equity at exit
- $9,468
- IRR
- 92.6%
- Equity multiple
- 10.70×
- Total profit
- $172,383
- Equity at exit
- $5,490
Cash invested: $17,780 (down + closing). Projections, not guarantees.
Landlord ↔ Tenant lean methodology
- Overall (STATE)
- 21 Tenant-Leaning
- State New Jersey
- 21 Tenant-Leaning · D+6
- County
- — inherits STATE
- City
- — inherits STATE
ZIP-level market 08094
- Active inventory
- 268
- Price-to-rent
- 2.4×
Monthly cashflow live
- Estimated rent
- $2,224 medium interval (Pro) →
- Mortgage (P&I)
- −$333
- Tax est. 1.5%
- −$79 /mo · $952/yr
- Insurance
- −$26
- HOA
- −$0
- Vacancy / Maint / Mgmt
- −$467
- Net cashflow
- $1,318
Break-even live
UW: 25.0% down · 7.5% · 30yr · 1.5% tax · 5.0% vac · 8.0% maint · 8.0% mgmt
Financing live
Cash to close
- Down payment
- $15,875
- Closing costs
- $1,905
- Reserves months
- —
- Total cash needed
- —
Loan-product check · same deal, 3 products live
Conventional
25% down · 7.5% · 30yr
- Down + closing
- —
- Monthly P&I
- —
- Monthly cashflow
- —
- DSCR
- —
- Eligible?
- —
Personal DTI + credit; lowest rate.
DSCR
20% down · 8.5% · 30yr
- Down + closing
- —
- Monthly P&I
- —
- Monthly cashflow
- —
- DSCR
- —
- Eligible?
- —
No personal income docs; deal must DSCR.
Hard money
10% down · 12.0% · 12mo
- Down + closing
- —
- Monthly P&I
- —
- Monthly cashflow
- —
- DSCR
- —
- Eligible?
- —
Short-term bridge; refi at stabilization.
Rent comps 4 comps
| Address | Beds | Baths | Sqft | Rent | $/sqft | DOM | Units | Dist |
|---|---|---|---|---|---|---|---|---|
| 1941 N Black Horse Pike Williamstown, NJ | 1.0–2.0 | 1.0 | 832 | $1,662 | $2.00 | 3d | 1 | 0.15mi |
| 1616 N Main St Williamstown, NJ | 2.0 | 2.0 | 1064 | $2,500 | $2.35 | 1d | 1 | 0.30mi |
| 1000 Fawn Dr Williamstown, NJ | 1.0–2.0 | 1.0–2.0 | 1209 | $5,983 | $4.95 | 1d | 1 | 0.76mi |
| 212 Woodlawn Ave Unit B Sewell, NJ | 2.0 | 1.0 | 1000 | $1,750 | $1.75 | 11d | 1 | 1.14mi |
Listing history 12 events
-
2026-06-18days on market $63,500 Active 17 DOM
-
2026-06-17days on market $63,500 Active 16 DOM
-
2026-06-16days on market $63,500 Active 15 DOM
-
2026-06-15days on market $63,500 Active 14 DOM
-
2026-06-13pricedays on market $63,500 Active 12 DOM
-
2026-06-09days on market $68,500 Active 8 DOM
-
2026-06-08days on market $68,500 Active 7 DOM
-
2026-06-07days on market $68,500 Active 6 DOM
-
2026-06-04days on market $68,500 Active 3 DOM
-
2026-06-03days on market $68,500 Active 2 DOM
-
2026-06-02remarks 666-char remark
-
2026-06-02$68,500 Active 1 DOM
ⓘ Source: listings_history table (triggers on properties + properties_extension) + one-shot
backfill from property_details.listing_events for pre-trigger history.
Nearby sold comps map
Loading sold comps map…
Walkable amenities ~0.75 mi
Loading nearby amenities…
Taxation est. · year 1
- Rental income
- $26,685
- − Mortgage interest
- −$3,557
- − Property taxes
- −$952
- − Insurance
- −$318
- − Repairs & maintenance
- −$2,135
- − Management
- −$2,135
- − Depreciation
- −$1,847
- Taxable income
- $15,741
- Est. tax owed @ 24.0%
- −$3,778
- After-tax cash flow
- $12,037/yr
For passive investors: Depreciation is non-cash, so a rental often shows a tax loss while cash-flowing — sheltering income. Rental losses are passive: they offset passive income freely, and up to $25,000/yr can offset ordinary (W-2) income if you actively participate and your MAGI is under $100k (phasing out to $0 by $150k); unused losses carry forward. On sale, claimed depreciation is recaptured at up to 25%, and gains may owe capital-gains tax (a 1031 exchange can defer both). Figures are a year-1 estimate at your 24.0% rate — not tax advice; consult a CPA.
Condition & rehab AI · 12 photos
This home is move-in ready with updated kitchen and flooring, but has moderate exterior wear and needs landscaping and siding repairs to increase its value.
Repairs flagged
- Moderate exterior siding — moderate wear
- Minor landscaping — overgrown lawn
Value-add opportunities
- Both landscaping and curb appeal — improves curb appeal and could attract more buyers
- Both exterior siding repair — improves home's appearance and could increase value
Renovation cost estimate screening
| Repair item | Severity | Est. cost |
|---|---|---|
| exterior siding · moderate wear | Moderate | $3,000–15,000 |
| landscaping · overgrown lawn | Minor | $500–3,000 |
| Total estimated repair cost · 2 items | $3,500–18,000 |
Value-add ROI direction
- Both landscaping and curb appeal — improves curb appeal and could attract more buyers ↑
- Both exterior siding repair — improves home's appearance and could increase value ↑
ⓘ Cost ranges are severity-bucket heuristics (US national rule-of-thumb). Get contractor quotes + a written scope before underwriting a rehab budget.
Schools (NCES district)
- District
- Monroe Township Public School District
- NCES district ID
- 3410470
- Math proficiency
- 20% ▼ -24.00%
- Reading proficiency
- 45% ▼ -9.00%
- Median HH income
- $71,557
- Composite
- 30.24/100
- National rank
- #6295
- State rank
- #302 of 472 in NJ
Livability — Sicklerville
No livability data for this city. (Only ~50 U.S. cities are tracked.)
Census & demographics
- County
- Gloucester County · 160,422 people
- City population
- 50,264
- Metro
- Philadelphia-Camden-Wilmington, PA-NJ-DE-MD
- Population (ZIP)
- 41,595
- Household income
- $96,699
- Rent vs Own
- Severe rent burden
- 721.0
Population outlook (Gloucester County) Hauer SSP2
- Today (2025)
- 298,895 people
- By 2030
- 299,031 · +0.0%
- By 2040
- 294,020 · -1.6%
- By 2050
- 284,188 · -4.9%
- By 2075
- 260,720 · -12.8%
- By 2100
- 229,565 · -23.2%
Race, ethnicity, and origin ACS 2023
- Neighborhood character
- Predominantly White (73%)
- Race & ethnicity
- White 73% Hispanic / Latino 11% Black 10% Two or more races 8% Asian 1%
- Hispanic origin (detail)
- Puerto Rican 6% Dominican 1%
- Common ancestry
- Romanian 6% Slovak 2% Lithuanian 1%
- Foreign-born
- 4% · Canada
- Languages at home
- 92% English-only · Spanish 5% Russian/Polish/Slavic 1%
Political lean MEDSL · Gloucester
- 2024 margin
- Toss-up / Even · D 47.8% · R 50.6% · Other 1.6%
- 2008→2024 swing
- -15.0pp toward R · 2008: 12.2pp · 2024: -2.8pp
- All cycles
- 2024: R+2.8 2020: D+1.9 2016: R+0.4 2012: D+10.5 2008: D+12.2
Not yet ingested
- Civics
- —
Market trends
- HPI YoY
- ▼ -213.12%
- Current HPI
- 278.3849
- Rent YoY
- —
- Metro
- Philadelphia-Camden-Wilmington, PA-NJ-DE-MD
- State GDP YoY
- ▲ 2.05%
- F500 in state
- 34
Industry mix (Fortune 500 HQ in NJ)
| Industry | F500 HQs | Revenue |
|---|---|---|
| Consumer Goods | 3 | $31B |
|
||
| Pharmaceuticals | 2 | $153B |
|
||
| Technology | 2 | $21B |
|
||
| Insurance | 2 | $20B |
|
||
| Healthcare | 2 | $19B |
|
||
| Financial Services | 1 | $70B |
|
||
Price history
+37.0% since first listed5 events — show timeline
- 2026-06-01 Listed $68,500 BRIGHT MLS
- 2023-07-10 Sold (MLS) $38,000 BRIGHT MLS
- 2023-06-28 Pending — BRIGHT MLS
- 2023-03-20 Price Changed $42,500 BRIGHT MLS
- 2023-02-14 Listed $50,000 BRIGHT MLS
Cash-flow waterfall
monthlySold comps — $/sqft
last 12 mo · ≤1 miLoading sold comps…