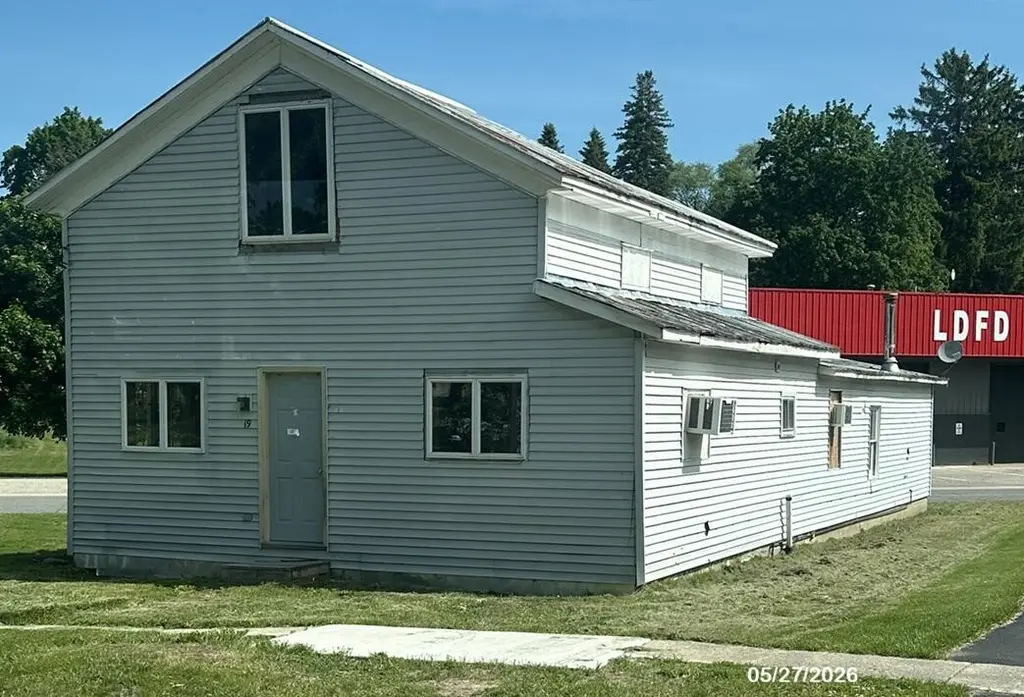
119 Washington Ave · Cato, MI
Flood risk 7/10 · Major
- FEMA flood zone
- —
- Chance of flooding over 30 yrs
- 0.96%
- Est. flood insurance / yr
- —
Fire risk 1/10 · Minimal
- Est. fire insurance / yr
- $784 – $1,456
Heat risk 2/10 · Minimal
- Hot days now (above 96°F)
- 7 days/yr
- Hot days in 30 yrs
- 15 days/yr
Wind risk 1/10 · Minimal
- Chance of severe wind over 30 yrs
- —
Air-quality risk 1/10 · Minimal
- Unhealthy air days now
- 0 days/yr
- Unhealthy air days in 30 yrs
- 0 days/yr
Risk factors via First Street. Map © Google.
Why this score? — see what drove the C grade
The composite is a weighted blend of 9 inputs, each scored 0–100. Each bar is that input's sub-score; the figure is the points it added to the 100-point composite (weight × sub-score).
- Cash flow +24.9/30.0
- DSCR +8.1/10.0
- ARV discount +7.5/15.0
- 1% rule +6.5/10.0
- Schools +3.0/10.0
- Rent growth +2.5/5.0
- Livability +2.5/5.0
- Condition / age +2.5/5.0
- Appreciation +0.0/10.0
$105,000
🖨 Deal sheet 📄 Offer letter ✓ Due diligence
Listing remarks MLS
2 Story home with 3 bedrooms, 1 bath located in the Village of Lakeview. 2 car attached garage and shed. Corner lot location. Cash Sale only. Sold as-is and seller will not complete any repairs.
Key facts
- Corner lot location
- 3,049 sq ft lot
- 2 garage spots
Tags
Property features AI
Exterior
- Parking: Attached 2-car garage
- Utilities: Natural gas connected
- Home design: Traditional single-family home; Built in 1920
- Construction: Vinyl siding
- Exterior features: Corner lot; Paved road frontage; Public water
Interior
- Kitchen: Microwave; Range
- Bathrooms: One full bathroom
- Heating & cooling: Forced air heating
- Interior features: Eight total rooms; Michigan-style basement
Neighborhood map
What this means for you Summary
Snapshot
- This is a 3-bed/1.0-bath single-family listed at $105k.
Deal economics
- At list price, monthly cash flow is $227 ($3k/yr) — positive.
- The deal already cash-flows at list — no discount required.
- Meets the 1% rule at list price ($1k rent vs $105k).
Location & tenants
- Location reads: area grade C — affects rentability + tenant quality, not the cash-flow math above.
- Lakeview Community Schools (Montcalm) (rural): math 28% / reading 44% proficiency, ranked #281 of 540 in MI (top 52%) — families likely to look elsewhere, expect single-tenant / working-renter base with shorter leases.
- Market conditions: 38 active listings in the ZIP; 273 units permitted in Montcalm County in 2024 (5 in 5+ unit buildings).
Forward outlook
- Local home prices are declining (-3.0%/yr); year-one equity from $726 of loan paydown is wiped out by about $3k of value loss. Plan a longer hold.
- Montcalm County population projected at -17% by 2050 — secular population decline; favor cash flow + early exit over multi-decade hold.
Negotiation context
- Only 6 days on market — expect competitive offers; lowballing is unlikely to land.
- 8 sale attempts since 7y ago with the ask held roughly flat each time — persistent listings suggest the price (not the market) is what's stuck; bring a comps-based counter.
Risks & watch-outs
- Watch-outs: built in 1920 — expect roof / HVAC / electrical / plumbing capex.
- Climate carrying-cost: major flood risk — expect insurance premiums to compound above CPI over the hold.
Questions for the listing agent
- Built in 1920 — when were the roof, HVAC, electrical panel, plumbing, and water heater last replaced?
- Is there a deadline driving the sale (1031 exchange, divorce, estate, relocation)? That informs how much negotiation room exists.
- What's the average days-on-market for RENTAL listings here right now (not sales)? A rising rental-DOM trend means longer vacancies and softer asking-rent achievability than the comps imply.
- What's the recent tenant-quality profile in this submarket — average credit score on applications, eviction rate, late-payment / NSF rate, and stable-employment percentage? A property-management company in the area should have these aggregated.
- How much new for-sale + rental construction is in the pipeline within 1–3 miles? Heavy new supply typically softens prices + rents 12–24 months out; constrained supply supports both.
Investment metrics
- 1% rule
- 1.15% ✓
- Cap rate
- 8.89%
- Cash-on-cash
- 9.26%
- DSCR
- 1.41
- GRM
- 7.3
CMA / ARV
- ARV (on-the-fly)
- $242,624
- Comps found
- 8
Show comp detail 8 sales within ~0.75 mi
| Address | Dist | Beds/Ba | Sqft | Sold | Price | $/sf | Match |
|---|---|---|---|---|---|---|---|
| 205 Mill St | 0.16mi | 4/2.0 (+1) | 1,840 (+3%) | 14mo | $250,000 | $136 | 67 |
| 105 2nd St | 0.15mi | 4/2.0 (+1) | 1,778 (-0%) | 24mo | $185,000 | $104 | 64 |
| 120 Mill St | 0.07mi | 3/2.0 | 1,615 (-10%) | 23mo | $176,000 | $109 | 58 |
| 306 Sherman St | 0.20mi | 3/2.0 | 1,520 (-15%) | 8mo | $175,000 | $115 | 56 |
| 92 N Lincoln Ave | 0.10mi | 2/2.0 (-1) | 2,042 (+14%) | 20mo | $353,000 | $173 | 45 |
| 92 N Lincoln Ave | 0.13mi | 2/2.0 (-1) | 2,042 (+14%) | 20mo | $353,000 | $173 | 44 |
| 804 S Lincoln Ave | 0.55mi | 4/2.0 (+1) | 2,030 (+14%) | 13mo | $188,000 | $93 | 32 |
| 9725 Paden Rd | 0.68mi | 4/2.0 (+1) | 1,568 (-12%) | 12mo | $220,000 | $140 | 29 |
Match score weights: distance 35% · size 25% · config 20% · recency 20%. Top-matched comps best support the ARV.
Projected returns pro-forma
-3.0% appreciation · 3.0% rent growth · sell at horizon
- IRR
- -2.3%
- Equity multiple
- 0.91×
- Total profit
- $-2,549
- Equity at exit
- $15,656
- IRR
- 7.4%
- Equity multiple
- 1.56×
- Total profit
- $16,458
- Equity at exit
- $9,078
Cash invested: $29,400 (down + closing). Projections, not guarantees.
Landlord ↔ Tenant lean methodology
- Overall (STATE)
- 62 Landlord-Friendly
- State Michigan
- 62 Landlord-Friendly · EVEN
- County
- — inherits STATE
- City
- — inherits STATE
ZIP-level market 48850
- Home prices YoY
- -22.6%
- Active inventory
- 38
- Price-to-rent
- 7.3×
Monthly cashflow live
- Estimated rent
- $1,206 medium interval (Pro) →
- Mortgage (P&I)
- −$551
- Tax est. 1.5%
- −$131 /mo · $1,575/yr
- Insurance
- −$44
- HOA
- −$0
- Vacancy / Maint / Mgmt
- −$253
- Net cashflow
- $227
Break-even live
UW: 25.0% down · 7.5% · 30yr · 1.5% tax · 5.0% vac · 8.0% maint · 8.0% mgmt
Financing live
Cash to close
- Down payment
- $26,250
- Closing costs
- $3,150
- Reserves months
- —
- Total cash needed
- —
Loan-product check · same deal, 3 products live
Conventional
25% down · 7.5% · 30yr
- Down + closing
- —
- Monthly P&I
- —
- Monthly cashflow
- —
- DSCR
- —
- Eligible?
- —
Personal DTI + credit; lowest rate.
DSCR
20% down · 8.5% · 30yr
- Down + closing
- —
- Monthly P&I
- —
- Monthly cashflow
- —
- DSCR
- —
- Eligible?
- —
No personal income docs; deal must DSCR.
Hard money
10% down · 12.0% · 12mo
- Down + closing
- —
- Monthly P&I
- —
- Monthly cashflow
- —
- DSCR
- —
- Eligible?
- —
Short-term bridge; refi at stabilization.
Listing history 6 events
-
2026-06-18days on market $105,000 Active 6 DOM
-
2026-06-17days on market $105,000 Active 5 DOM
-
2026-06-16days on market $105,000 Active 4 DOM
-
2026-06-15days on market $105,000 Active 3 DOM
-
2026-06-14remarks 194-char remark
-
2026-06-14$105,000 Active 1 DOM
ⓘ Source: listings_history table (triggers on properties + properties_extension) + one-shot
backfill from property_details.listing_events for pre-trigger history.
Climate risk First Street
- Flood 7/10 Severe 96% chance over 30 yrs
- Wildfire 1/10 Low
- Heat 2/10 Low 7 d/yr ≥96°F today · 15 d/yr by 30 yrs out
- Wind 1/10 Low
- Air quality 1/10 Low 0 unhealthy d/yr today · 0 by 30 yrs out
Nearby sold comps map
Loading sold comps map…
Walkable amenities ~0.75 mi
Loading nearby amenities…
Taxation est. · year 1
- Rental income
- $14,468
- − Mortgage interest
- −$5,882
- − Property taxes
- −$1,575
- − Insurance
- −$525
- − Repairs & maintenance
- −$1,157
- − Management
- −$1,157
- − Depreciation
- −$3,055
- Taxable income
- $1,117
- Est. tax owed @ 24.0%
- −$268
- After-tax cash flow
- $2,454/yr
For passive investors: Depreciation is non-cash, so a rental often shows a tax loss while cash-flowing — sheltering income. Rental losses are passive: they offset passive income freely, and up to $25,000/yr can offset ordinary (W-2) income if you actively participate and your MAGI is under $100k (phasing out to $0 by $150k); unused losses carry forward. On sale, claimed depreciation is recaptured at up to 25%, and gains may owe capital-gains tax (a 1031 exchange can defer both). Figures are a year-1 estimate at your 24.0% rate — not tax advice; consult a CPA.
Schools (NCES district)
- District
- Lakeview Community Schools (Montcalm)
- NCES district ID
- 2620910
- Math proficiency
- 28% ▼ -8.00%
- Reading proficiency
- 44% ▼ -5.00%
- Median HH income
- $40,513
- Composite
- 30.21/100
- National rank
- #6303
- State rank
- #281 of 540 in MI
Livability — Cato
No livability data for this city. (Only ~50 U.S. cities are tracked.)
Census & demographics
- Census place
- Lakeview, MI
- Population (ZIP)
- 4,526
Population outlook (Montcalm County) Hauer SSP2
- Today (2025)
- 61,011 people
- By 2030
- 59,467 · -2.5%
- By 2040
- 55,427 · -9.2%
- By 2050
- 50,517 · -17.2%
- By 2075
- 38,731 · -36.5%
- By 2100
- 26,770 · -56.1%
Race, ethnicity, and origin ACS 2023
- Neighborhood character
- Predominantly White (86%)
- Race & ethnicity
- White 86% Black 7% Two or more races 4% Hispanic / Latino 4%
- Common ancestry
- Polish 4% Iranian 3% Lithuanian 2%
- Foreign-born
- 1% · Canada
- Languages at home
- 95% English-only · German/W. Germanic 4% Spanish 1%
Political lean MEDSL · Montcalm
- 2024 margin
- Solid R (+39.0) · D 29.8% · R 68.7% · Other 1.5%
- 2008→2024 swing
- -38.7pp toward R · 2008: -0.3pp · 2024: -39.0pp
- All cycles
- 2024: R+39.0 2020: R+37.7 2016: R+34.0 2012: R+8.6 2008: R+0.3
Not yet ingested
- Civics
- —
Market trends
- HPI YoY
- ▼ -80.28%
- Current HPI
- 275.5563
- Rent YoY
- —
- Metro
- —
- State GDP YoY
- ▲ 1.37%
- F500 in state
- 28
Industry mix (Fortune 500 HQ in MI)
| Industry | F500 HQs | Revenue |
|---|---|---|
| Automotive Parts | 3 | $48B |
|
||
| Automotive | 2 | $372B |
|
||
| Chemicals | 1 | $45B |
|
||
| Automotive Retail | 1 | $29B |
|
||
| Healthcare / Medical Devices | 1 | $23B |
|
||
| Automotive Technology | 1 | $20B |
|
||
Price history
+184.6% since first listed25 events — show timeline
- 2026-06-11 Listed $105,000 MiRealSource-MiMLS
- 2026-06-11 Listed $105,000 SW Michigan MLS
- 2021-01-15 Sold (Public Records) $95,000 Public Records
- 2021-01-13 Sold (MLS) $95,000 MiRealSource-MiMLS
- 2021-01-13 Sold (MLS) $95,000 SW Michigan MLS
- 2021-01-13 Sold (MLS) $95,000 REALCOMP
- 2020-11-20 Pending — REALCOMP
- 2020-11-20 Pending — MiRealSource-MiMLS
- 2020-11-20 Pending — SW Michigan MLS
- 2020-11-12 Price Changed $89,900 MiRealSource-MiMLS
- 2020-11-11 Price Changed $89,900 REALCOMP
- 2020-11-11 Price Changed $89,900 SW Michigan MLS
- 2020-10-23 Listed $95,000 MiRealSource-MiMLS
- 2020-10-23 Listed $95,000 SW Michigan MLS
- 2020-10-23 Listed $95,000 REALCOMP
- 2019-09-17 Sold (Public Records) $36,900 Public Records
- 2019-09-12 Sold (MLS) $36,900 SW Michigan MLS
- 2019-09-12 Sold (MLS) $36,900 REALCOMP
- 2019-08-28 Pending — SW Michigan MLS
- 2019-08-21 Price Changed $36,900 SW Michigan MLS
- 2019-08-02 Price Changed $47,500 SW Michigan MLS
- 2019-07-05 Price Changed $64,900 SW Michigan MLS
- 2019-06-23 Listed $36,900 MiRealSource-MiMLS
- 2019-06-23 Listed $69,500 SW Michigan MLS
- 2019-06-23 Listed $36,900 REALCOMP
Cash-flow waterfall
monthlySold comps — $/sqft
last 12 mo · ≤1 miLoading sold comps…