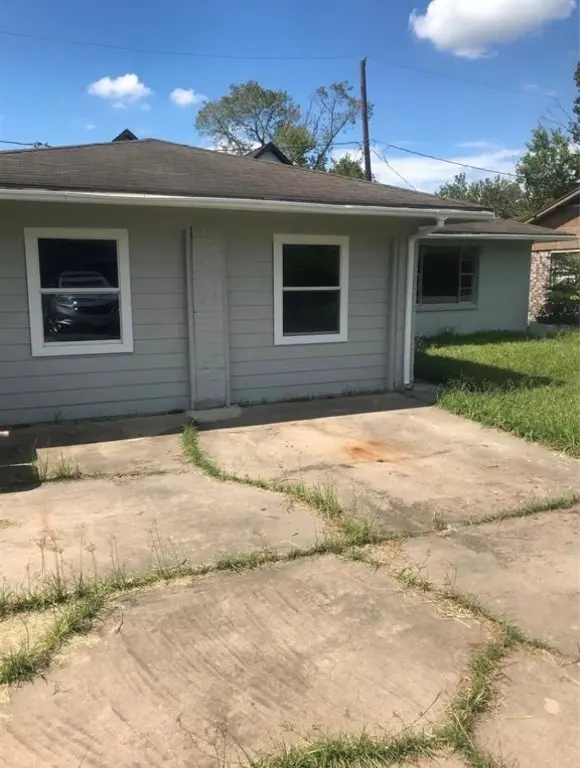
7230 England St · Houston, TX
Flood risk 4/10 · Minor
- FEMA flood zone
- X (unshaded)
- Chance of flooding over 30 yrs
- 0.21%
- Est. flood insurance / yr
- $507 – $1,088
Fire risk 1/10 · Minimal
- Est. fire insurance / yr
- $1,222 – $2,270
Heat risk 9/10 · Severe
- Hot days now (above 109°F)
- 7 days/yr
- Hot days in 30 yrs
- 24 days/yr
Wind risk 9/10 · Severe
- Chance of severe wind over 30 yrs
- 99.0%
Air-quality risk 2/10 · Minimal
- Unhealthy air days now
- 2 days/yr
- Unhealthy air days in 30 yrs
- 2 days/yr
Risk factors via First Street. Map © Google.
Why this score? — see what drove the D+ grade
The composite is a weighted blend of 9 inputs, each scored 0–100. Each bar is that input's sub-score; the figure is the points it added to the 100-point composite (weight × sub-score).
- ARV discount +15.0/15.0
- Cash flow +13.5/30.0
- 1% rule +4.5/10.0
- DSCR +4.1/10.0
- Livability +3.7/5.0
- Rent growth +3.0/5.0
- Schools +2.7/10.0
- Condition / age +2.5/5.0
- Appreciation +0.0/10.0
$245,000
🖨 Deal sheet 📄 Offer letter ✓ Due diligence
Listing remarks MLS
Spacious 4-bedroom, 2-bath home ideally located just minutes from the Houston Medical Center, offering the perfect blend of convenience and investment potential. This well-maintained property features a functional layout with generously sized bedrooms, comfortable living areas, and plenty of natural light ideal. Currently resident occupied and generating $2,400 per month in rental income, this home presents an excellent opportunity for investors seeking immediate cash flow. Its prime location near the Medical Center, major freeways, dining, and shopping helps ensure strong rental demand and long-term value. Whether you're looking to expand your investment portfolio or secure a future primary residence in a highly desirable area, this property checks all the boxes. Please do not disturb tenants. Showings by appointment only.
Key facts
- Strong rental demand
- Long term value
- Prime location
Tags
Neighborhood map
What this means for you Summary
Snapshot
- This is a 3-bed/1.5-bath single-family listed at $245k.
Deal economics
- At list price, monthly cash flow is $8 ($97/yr) — positive.
- The deal already cash-flows at list — no discount required.
- To meet the 1% rule (rent ≥ 1% of price), the offer needs to be $234k (4.5% below list).
- Recommended offer: $223k (9.0% below list) — sets the bar for market timing.
- Cap rate 6.3% vs local median 3.2% in Houston — top-decile yield for the area; either an underpriced asset or a hidden risk that comps aren't pricing in. Stress-test before assuming the spread holds.
Location & tenants
- Location reads 74/100 on livability (#184 in TX, #4,771 nationally) — a middle-class / working-renter tenant base. Strengths: amenities A+, cost of living A+, housing A+; Watch: schools D, crime F.
- Houston ISD (urban): math 27% / reading 35% proficiency, ranked #593 of 826 in TX (top 72%) — families likely to look elsewhere, expect single-tenant / working-renter base with shorter leases; 71% free/reduced lunch — lower-income household profile, screen leases tightly.
- Market conditions: Rents rising (+2.2%/yr); 467 active listings in the ZIP; 40 comparable units currently listed for rent nearby; rentals at typical pace (median 24d on market — plan ~3-4 weeks tenant-placement turnaround); 45% of comp listings sitting > 30 days — soft ceiling on asking rent; 29,883 units permitted in Harris County in 2024 (8,621 in 5+ unit buildings).
- At $2,339/mo this rent would consume 62% of the median local household income ($46k/yr) (locally 2532% of renters already pay >50% of income on rent) — very limited rent-growth headroom before tenants either downsize or default.
Forward outlook
- Local home prices are declining (-3.0%/yr); year-one equity from $2k of loan paydown is wiped out by about $7k of value loss. Plan a longer hold.
- Harris County population projected at +47% by 2050 — long-run rental-demand tailwind backs the buy-and-hold thesis.
Negotiation context
- It's been on market 118 days — a 9% lower offer ($223k) is reasonable based on typical stale-listing flexibility.
- 4 sale attempts since 16y ago; this cycle's ask has dropped $105k (30%) from the opening price — seller is motivated, your offer sets the floor, not the list.
Risks & watch-outs
- Climate carrying-cost: severe wind risk, 99% chance of damaging wind over 30y; extreme-heat days projected 7→24/yr by 2055 (HVAC capex compounding) — expect insurance premiums to compound above CPI over the hold.
Questions for the listing agent
- It's been on market 118 days. Have you received any prior offers? Is the seller open to a 9% concession, seller financing, or rate buy-down credit?
- Built in 1969 — when were the roof, HVAC, electrical panel, plumbing, and water heater last replaced?
- Why hasn't it sold? Are there any deal-killer items the seller is aware of (foundation, flood, title, zoning, code violations)?
- Is there a deadline driving the sale (1031 exchange, divorce, estate, relocation)? That informs how much negotiation room exists.
- Schools are D-rated, which usually means shorter tenancies and higher turnover. Who's the typical renter profile here, and what's been the actual vacancy rate?
- Crime grade is F in this area — have there been break-ins, vandalism, or insurance claims at this property in the last 3 years? What carrier currently insures it and at what premium?
- The area grade is low — what's the realistic commute time and amenity access for the typical tenant pool here? Any planned neighborhood developments (good or bad) we should know about?
- What's the average days-on-market for RENTAL listings here right now (not sales)? A rising rental-DOM trend means longer vacancies and softer asking-rent achievability than the comps imply.
- What's the recent tenant-quality profile in this submarket — average credit score on applications, eviction rate, late-payment / NSF rate, and stable-employment percentage? A property-management company in the area should have these aggregated.
- How much new for-sale + rental construction is in the pipeline within 1–3 miles? Heavy new supply typically softens prices + rents 12–24 months out; constrained supply supports both.
Investment metrics
- 1% rule
- 0.95% ✗
- Cap rate
- 6.33%
- Cash-on-cash
- 0.14%
- DSCR
- 1.01
- GRM
- 8.7
CMA / ARV
- ARV (median comp)
- $295,352
- List price
- $245,000
- Delta
- -17.05%
- Verdict
- UNDERPRICED
- Comps
- 20 within 1.0 mi
Show comp detail 12 sales within ~0.75 mi
| Address | Dist | Beds/Ba | Sqft | Sold | Price | $/sf | Match |
|---|---|---|---|---|---|---|---|
| 7117 England St Unit C | 0.18mi | 3/2.5 | 1,700 (-8%) | 1mo | $340,000 | $200 | 74 |
| 4107 Dreyfus St | 0.12mi | 3/3.5 | 1,984 (+8%) | 2mo | $200,000 | $101 | 72 |
| 4211 Faulkner St | 0.25mi | 3/2.5 | 1,610 (-13%) | 3mo | $274,900 | $171 | 61 |
| 3605 Mt Pleasant St | 0.63mi | 3/3.5 | 1,868 (+1%) | 1mo | $349,900 | $187 | 59 |
| 6906 England St | 0.38mi | 3/2.5 | 1,600 (-13%) | 4mo | $309,900 | $194 | 53 |
| 3733 Lydia St | 0.50mi | 3/3.5 | 2,018 (+10%) | 2mo | $359,900 | $178 | 51 |
| 6725 Saint Augustine St | 0.52mi | 3/3.5 | 2,050 (+11%) | 1mo | $299,900 | $146 | 48 |
| 4819 Lingonberry St | 0.74mi | 3/2.0 | 2,019 (+10%) | 1mo | $155,000 | $77 | 46 |
| 3617A Mt Pleasant St | 0.63mi | 3/3.5 | 2,012 (+9%) | 2mo | $364,800 | $181 | 46 |
| 4019 Ward St | 0.52mi | 3/3.5 | 2,050 (+11%) | 4mo | $315,000 | $154 | 46 |
| 3615A Mt Pleasant St | 0.61mi | 3/3.5 | 2,012 (+9%) | 3mo | $364,900 | $181 | 45 |
| 4611 Idaho St | 0.58mi | 4/2.0 (+1) | 1,640 (-11%) | 4mo | $257,000 | $157 | 44 |
Match score weights: distance 35% · size 25% · config 20% · recency 20%. Top-matched comps best support the ARV.
Projected returns pro-forma
-3.0% appreciation · 2.17% rent growth · sell at horizon
- IRR
- -17.0%
- Equity multiple
- 0.40×
- Total profit
- $-40,996
- Equity at exit
- $36,530
- IRR
- -10.6%
- Equity multiple
- 0.38×
- Total profit
- $-42,343
- Equity at exit
- $21,183
Cash invested: $68,600 (down + closing). Projections, not guarantees.
Landlord ↔ Tenant lean methodology
- Overall (STATE)
- 87 Strongly Landlord-Friendly
- State Texas
- 87 Strongly Landlord-Friendly · R+5
- County
- — inherits STATE
- City
- — inherits STATE
ZIP-level market 77021
- Home prices YoY
- -23.6%
- Rents YoY
- 2.2%
- Active inventory
- 467
- Price-to-rent
- 8.7×
Monthly cashflow live
- Estimated rent
- $2,339 high interval (Pro) →
- Mortgage (P&I)
- −$1,285
- Tax from tax record
- −$453 /mo · $5,434/yr
- Insurance
- −$102
- HOA
- −$0
- Vacancy / Maint / Mgmt
- −$491
- Net cashflow
- $8
Break-even live
UW: 25.0% down · 7.5% · 30yr · 1.5% tax · 5.0% vac · 8.0% maint · 8.0% mgmt
Financing live
Cash to close
- Down payment
- $61,250
- Closing costs
- $7,350
- Reserves months
- —
- Total cash needed
- —
Loan-product check · same deal, 3 products live
Conventional
25% down · 7.5% · 30yr
- Down + closing
- —
- Monthly P&I
- —
- Monthly cashflow
- —
- DSCR
- —
- Eligible?
- —
Personal DTI + credit; lowest rate.
DSCR
20% down · 8.5% · 30yr
- Down + closing
- —
- Monthly P&I
- —
- Monthly cashflow
- —
- DSCR
- —
- Eligible?
- —
No personal income docs; deal must DSCR.
Hard money
10% down · 12.0% · 12mo
- Down + closing
- —
- Monthly P&I
- —
- Monthly cashflow
- —
- DSCR
- —
- Eligible?
- —
Short-term bridge; refi at stabilization.
Rent comps 40 comps
| Address | Beds | Baths | Sqft | Rent | $/sqft | DOM | Units | Dist |
|---|---|---|---|---|---|---|---|---|
| 7321 Conley St Unit A Houston, TX | 3.0 | 2.5 | 1869 | $2,025 | $1.08 | 20d | 1 | 0.07mi |
| 7321 Conley St Unit B Houston, TX | 3.0 | 2.0 | 1501 | $2,025 | $1.35 | 20d | 1 | 0.07mi |
| 3846 Seabrook St Houston, TX | 3.0 | 3.5 | 1833 | $2,300 | $1.25 | 43d | 1 | 0.30mi |
| 3732 Seabrook St Houston, TX | 3.0 | 2.5 | 1727 | $2,350 | $1.36 | 24d | 1 | 0.44mi |
| 6809 Conley St Houston, TX | 3.0 | 4.0 | 1921 | $2,600 | $1.35 | 43d | 1 | 0.46mi |
| 3655 Seabrook St Unit 6 Houston, TX | 2.0 | 1.0 | 1600 | $1,000 | $0.62 | 43d | 1 | 0.49mi |
| 4530 Mayflower St Houston, TX | 3.0 | 2.0 | 1302 | $1,800 | $1.38 | 43d | 1 | 0.56mi |
| 3615 Dreyfus St Houston, TX | 3.0 | 3.0 | 2011 | $2,800 | $1.39 | 43d | 1 | 0.59mi |
| 4705 Idaho St Houston, TX | 3.0 | 2.5 | 1664 | $2,500 | $1.50 | 16d | 1 | 0.66mi |
| 6731 New York St Houston, TX | 3.0 | 3.0 | 2211 | $2,100 | $0.95 | 43d | 1 | 0.68mi |
| 7806 Comal St Unit B Houston, TX | 3.0 | 2.5 | 1800 | $2,200 | $1.22 | 43d | 1 | 0.72mi |
| 4609 Bricker St Unit ABC Houston, TX | 3.0 | 2.5 | 1375 | $3,500 | $2.55 | 11d | 1 | 0.81mi |
| 4609 Bricker St Unit B Houston, TX | 3.0 | 2.5 | 1300 | $3,500 | $2.69 | 12d | 1 | 0.81mi |
| 7507 Springhill St Houston, TX | 3.0 | 3.5 | 2000 | $4,500 | $2.25 | 43d | 1 | 0.82mi |
| 4613 Bricker St Unit B Houston, TX | 3.0 | 2.5 | 1600 | $2,300 | $1.44 | 43d | 1 | 0.82mi |
| 4601 White Rock St Unit A Houston, TX | 3.0 | 2.5 | 1700 | $2,500 | $1.47 | 43d | 1 | 0.89mi |
| 7358 Guadalcanal Rd Houston, TX | 3.0 | 3.0 | 1768 | $2,195 | $1.24 | 43d | 1 | 0.89mi |
| 8010 Livingston St Houston, TX | 3.0 | 2.0 | 1400 | $1,800 | $1.29 | 43d | 1 | 0.91mi |
| 4942 Bataan Rd Unit 77033 Houston, TX | 4.0 | 2.0 | 1350 | $1,800 | $1.33 | 43d | 1 | 0.93mi |
| 8107 Calhoun Rd Houston, TX | 3.0 | 2.5 | 1304 | $2,250 | $1.73 | 24d | 1 | 0.93mi |
| 3402 Nathaniel Brown St Unit B Houston, TX | 3.0 | 2.5 | 1885 | $2,025 | $1.07 | 43d | 1 | 0.98mi |
| 4117 Shelby Cir Unit 1230900P Houston, TX | 4.0 | 2.0 | 1367 | $5,355 | $3.92 | 1d | 1 | 0.98mi |
| 3620 Du Bois St Unit 1302349P Houston, TX | 3.0 | 2.5 | 1797 | $2,945 | $1.64 | 2d | 1 | 0.99mi |
| 6532 Weston St Unit A Houston, TX | 3.0 | 3.0 | 1484 | $2,200 | $1.48 | 17d | 1 | 1.00mi |
| 6528 Weston St Unit A Houston, TX | 3.0 | 3.0 | 1484 | $2,200 | $1.48 | 43d | 1 | 1.02mi |
| 3731 Alsace St Unit 1560804P Houston, TX | 3.0 | 2.0 | 2002 | $3,387 | $1.69 | 2d | 1 | 1.04mi |
| 4835 Sunflower St Unit 1546466P Houston, TX | 3.0 | 2.0 | 1883 | $4,516 | $2.40 | 14d | 1 | 1.05mi |
| 7710 Darnay Dr Houston, TX | 3.0 | 3.0 | 1635 | $2,095 | $1.28 | 43d | 1 | 1.05mi |
| 4406 Sterling St Houston, TX | 3.0 | 2.5 | 1840 | $1,999 | $1.09 | 16d | 1 | 1.06mi |
| 8328 Corinth St Unit B Houston, TX | 3.0 | 2.5 | 1500 | $2,800 | $1.87 | 20d | 1 | 1.09mi |
| 7339 Krueger Rd Houston, TX | 3.0 | 2.0 | 2440 | $1,900 | $0.78 | 43d | 1 | 1.17mi |
| 3311 Daphne St Unit 1255369P Houston, TX | 3.0 | 3.5 | 1797 | $6,544 | $3.64 | 1d | 1 | 1.21mi |
| 3311 Daphne St Unit 3311 Houston, TX | 3.0 | 3.5 | 1800 | $7,500 | $4.17 | 43d | 1 | 1.22mi |
| 6737 Peerless St Unit A Houston, TX | 3.0 | 3.5 | 1732 | $2,649 | $1.53 | 16d | 1 | 1.22mi |
| 6735 Peerless St Unit CUNIT A Houston, TX | 3.0 | 3.5 | 1732 | $2,649 | $1.53 | 16d | 1 | 1.23mi |
| 7373 Ardmore St Houston, TX | 1.0–3.0 | 1.0–2.0 | 1095 | $1,887 | $1.72 | 4d | 24 | 1.24mi |
| 3088 Holly Hall St Unit 1 Houston, TX | 2.0 | 2.5 | 1600 | $1,750 | $1.09 | 14d | 1 | 1.26mi |
| 5201 Kenilwood Dr Unit B Houston, TX | 3.0 | 2.0 | 2442 | $1,725 | $0.71 | 13d | 1 | 1.26mi |
| 4514 Galesburg St Unit B Houston, TX | 3.0 | 2.5 | 1680 | $3,500 | $2.08 | 24d | 1 | 1.26mi |
| 7379 Ardmore St Unit 1303 Houston, TX | 3.0 | 2.0 | 1442 | $1,967 | $1.36 | 21d | 1 | 1.26mi |
Listing history 33 events
-
2026-06-18days on market $245,000 Active 118 DOM
-
2026-06-17days on market $245,000 Active 117 DOM
-
2026-06-16days on market $245,000 Active 116 DOM
-
2026-06-15days on market $245,000 Active 115 DOM
-
2026-06-13days on market $245,000 Active 113 DOM
-
2026-06-10days on market $245,000 Active 109 DOM
-
2026-06-08days on market $245,000 Active 108 DOM
-
2026-06-07days on market $245,000 Active 107 DOM
-
2026-06-04days on market $245,000 Active 104 DOM
-
2026-06-01days on market $245,000 Active 101 DOM
-
2026-05-31days on market $245,000 Active 100 DOM
-
2026-02-27price $245,000 841-char remark
Show marketing remark (841 chars)
Spacious 4-bedroom, 2-bath home ideally located just minutes from the Houston Medical Center, offering the perfect blend of convenience and investment potential. This well-maintained property features a functional layout with generously sized bedrooms, comfortable living areas, and plenty of natural light ideal. Currently resident occupied and generating $2,400 per month in rental income, this home presents an excellent opportunity for investors seeking immediate cash flow. Its prime location near the Medical Center, major freeways, dining, and shopping helps ensure strong rental demand and long-term value. Whether you're looking to expand your investment portfolio or secure a future primary residence in a highly desirable area, this property checks all the boxes. Please do not disturb tenants. Showings by appointment only.
-
2026-02-20price $250,000 841-char remark
Show marketing remark (841 chars)
Spacious 4-bedroom, 2-bath home ideally located just minutes from the Houston Medical Center, offering the perfect blend of convenience and investment potential. This well-maintained property features a functional layout with generously sized bedrooms, comfortable living areas, and plenty of natural light ideal. Currently resident occupied and generating $2,400 per month in rental income, this home presents an excellent opportunity for investors seeking immediate cash flow. Its prime location near the Medical Center, major freeways, dining, and shopping helps ensure strong rental demand and long-term value. Whether you're looking to expand your investment portfolio or secure a future primary residence in a highly desirable area, this property checks all the boxes. Please do not disturb tenants. Showings by appointment only.
-
2026-02-20$350,000 Active 841-char remark
Show marketing remark (841 chars)
Spacious 4-bedroom, 2-bath home ideally located just minutes from the Houston Medical Center, offering the perfect blend of convenience and investment potential. This well-maintained property features a functional layout with generously sized bedrooms, comfortable living areas, and plenty of natural light ideal. Currently resident occupied and generating $2,400 per month in rental income, this home presents an excellent opportunity for investors seeking immediate cash flow. Its prime location near the Medical Center, major freeways, dining, and shopping helps ensure strong rental demand and long-term value. Whether you're looking to expand your investment portfolio or secure a future primary residence in a highly desirable area, this property checks all the boxes. Please do not disturb tenants. Showings by appointment only.
-
2023-05-22soldstatus
-
2022-05-19historical
-
2022-03-24price $260,000
-
2022-02-17price $283,000
-
2022-02-13price $285,000
-
2022-02-02$290,000 Active
-
2020-09-16soldstatus
-
2020-03-05soldstatus
-
2015-11-16soldstatus
-
2010-06-17soldstatus
-
2010-05-29historical
-
2010-05-14$46,000
-
2010-05-14historical
-
2010-05-13$46,000
-
2009-03-05soldstatus
-
2009-02-25soldstatus
-
2008-08-14soldstatus
-
2007-11-09soldstatus
-
1993-10-28soldstatus
ⓘ Source: listings_history table (triggers on properties + properties_extension) + one-shot
backfill from property_details.listing_events for pre-trigger history.
Tax reassessment forecast TX · Resets to sale price
- Current annual tax
- $5,434 · $453/mo
- Projected year-2 tax
- $5,434 · $453/mo
- Expected delta
- $0/yr ($0/mo · 0.0%)
ⓘ Screening estimate from a state-policy table — verify with the county assessor before closing.
Climate risk First Street
- Flood 4/10 Moderate FEMA zone X (unshaded) · 21% chance over 30 yrs
- Wildfire 1/10 Low
- Heat 9/10 Extreme 7 d/yr ≥109°F today · 24 d/yr by 30 yrs out
- Wind 9/10 Extreme 99% chance of damaging wind over 30 yrs
- Air quality 2/10 Low 2 unhealthy d/yr today · 2 by 30 yrs out
Nearby sold comps map
Loading sold comps map…
Walkable amenities ~0.75 mi
Loading nearby amenities…
Taxation est. · year 1
- Rental income
- $28,068
- − Mortgage interest
- −$13,724
- − Property taxes
- −$5,434
- − Insurance
- −$1,225
- − Repairs & maintenance
- −$2,245
- − Management
- −$2,245
- − Depreciation
- −$7,127
- Taxable loss
- −$3,933
- Est. tax savings @ 24.0%
- +$944
- After-tax cash flow
- $1,041/yr
For passive investors: Depreciation is non-cash, so a rental often shows a tax loss while cash-flowing — sheltering income. Rental losses are passive: they offset passive income freely, and up to $25,000/yr can offset ordinary (W-2) income if you actively participate and your MAGI is under $100k (phasing out to $0 by $150k); unused losses carry forward. On sale, claimed depreciation is recaptured at up to 25%, and gains may owe capital-gains tax (a 1031 exchange can defer both). Figures are a year-1 estimate at your 24.0% rate — not tax advice; consult a CPA.
Schools (NCES district)
- District
- Houston ISD
- NCES district ID
- 4823640
- Math proficiency
- 27% ▼ -18.00%
- Reading proficiency
- 35% ▼ -6.00%
- Median HH income
- $46,054
- Composite
- 26.63/100
- National rank
- #7173
- State rank
- #593 of 826 in TX
Livability — Houston
- Score
- 74/100
- State rank
- #184
- US rank
- #4771
Category grades
Schools grade is shown separately in the Schools card above.
Census & demographics
- Census place
- Houston, TX
- County
- Harris County · 4,702,590 people
- City population
- 3,226,434
- Metro
- Houston-The Woodlands-Sugar Land, TX
- Population (ZIP)
- 26,153
- Household income
- $45,574
- Rent vs Own
- Severe rent burden
- 2532.0
Population outlook (Harris County) Hauer SSP2
- Today (2025)
- 5,571,493 people
- By 2030
- 6,089,821 · +9.3%
- By 2040
- 7,142,806 · +28.2%
- By 2050
- 8,185,864 · +46.9%
- By 2075
- 10,574,329 · +89.8%
- By 2100
- 12,109,958 · +117.4%
Race, ethnicity, and origin ACS 2023
- Neighborhood character
- Diverse neighborhood (Simpson 0.55)
- Race & ethnicity
- Black 62% Hispanic / Latino 22% Two or more races 12% White 10% Asian 2%
- Hispanic origin (detail)
- Mexican 15%
- Common ancestry
- Italian 1% Romanian 1% Lithuanian 1%
- Foreign-born
- 11% · Canada
- Languages at home
- 77% English-only · Spanish 19% French/Haitian/Cajun 1% Other Indo-European 1%
Political lean MEDSL · Harris
- 2024 margin
- Lean D (+5.5) · D 52.0% · R 46.4% · Other 1.6%
- 2008→2024 swing
- +3.9pp toward D · 2008: 1.6pp · 2024: 5.5pp
- All cycles
- 2024: D+5.5 2020: D+13.3 2016: D+12.4 2012: D+0.1 2008: D+1.6
Not yet ingested
- Civics
- —
Market trends
- HPI YoY
- ▼ -71.22%
- Current HPI
- 230.2869
- Rent YoY
- ▲ 2.17%
- Metro
- Houston-The Woodlands-Sugar Land, TX
- State GDP YoY
- ▲ 3.95%
- F500 in state
- 110
Industry mix (Fortune 500 HQ in TX)
| Industry | F500 HQs | Revenue |
|---|---|---|
| Energy | 16 | $1,198B |
|
||
| Technology | 5 | $198B |
|
||
| Engineering / Construction | 4 | $72B |
|
||
| Energy Services | 3 | $60B |
|
||
| Utilities | 3 | $41B |
|
||
| Healthcare | 2 | $330B |
|
||
Price history
+432.6% since first listed22 events — show timeline
- 2026-02-27 Price Changed $245,000 HARMLS
- 2026-02-20 Price Changed $250,000 HARMLS
- 2026-02-20 Listed $350,000 HARMLS
- 2023-05-22 Sold (Public Records) — Public Records
- 2022-05-19 Listing Removed — HARMLS
- 2022-03-24 Price Changed $260,000 HARMLS
- 2022-02-17 Price Changed $283,000 HARMLS
- 2022-02-13 Price Changed $285,000 HARMLS
- 2022-02-02 Listed $290,000 HARMLS
- 2020-09-16 Sold (Public Records) — Public Records
- 2020-03-05 Sold (Public Records) — Public Records
- 2015-11-16 Sold (Public Records) — Public Records
- 2010-06-17 Sold (MLS) — HARMLS
- 2010-05-29 Listing Removed — HARMLS
- 2010-05-14 Listing Removed — HARMLS
- 2010-05-14 Listed $46,000 HARMLS
- 2010-05-13 Listed $46,000 HARMLS
- 2009-03-05 Sold (Public Records) — Public Records
- 2009-02-25 Sold (Public Records) — Public Records
- 2008-08-14 Sold (Public Records) — Public Records
- 2007-11-09 Sold (Public Records) — Public Records
- 1993-10-28 Sold (Public Records) — Public Records
Property tax history
+9.5%/yrLatest (2025): $5,434 · -7.0% YoY. Source: county tax records.
Cash-flow waterfall
monthlySold comps — $/sqft
last 12 mo · ≤1 miLoading sold comps…