100 Semi Cir · Horseshoe Bay, TX
Flood risk 1/10 · Minimal
- FEMA flood zone
- X (unshaded)
- Chance of flooding over 30 yrs
- 0.0%
- Est. flood insurance / yr
- $507 – $1,088
Fire risk 5/10 · Moderate
- Est. fire insurance / yr
- $1,222 – $2,270
Heat risk 8/10 · Major
- Hot days now (above 106°F)
- 6 days/yr
- Hot days in 30 yrs
- 19 days/yr
Wind risk 6/10 · Moderate
- Chance of severe wind over 30 yrs
- 55.0%
Air-quality risk 1/10 · Minimal
- Unhealthy air days now
- 0 days/yr
- Unhealthy air days in 30 yrs
- 0 days/yr
Risk factors via First Street. Map © Google.
Why this score? — see what drove the D grade
The composite is a weighted blend of 9 inputs, each scored 0–100. Each bar is that input's sub-score; the figure is the points it added to the 100-point composite (weight × sub-score).
- ARV discount +15.0/15.0
- Cash flow +6.6/30.0
- Appreciation +5.5/10.0
- Schools +3.5/10.0
- Livability +3.3/5.0
- Rent growth +2.5/5.0
- Condition / age +2.5/5.0
- 1% rule +1.4/10.0
- DSCR +0.9/10.0
$595,000
🖨 Deal sheet 📄 Offer letter ✓ Due diligence
Listing remarks MLS
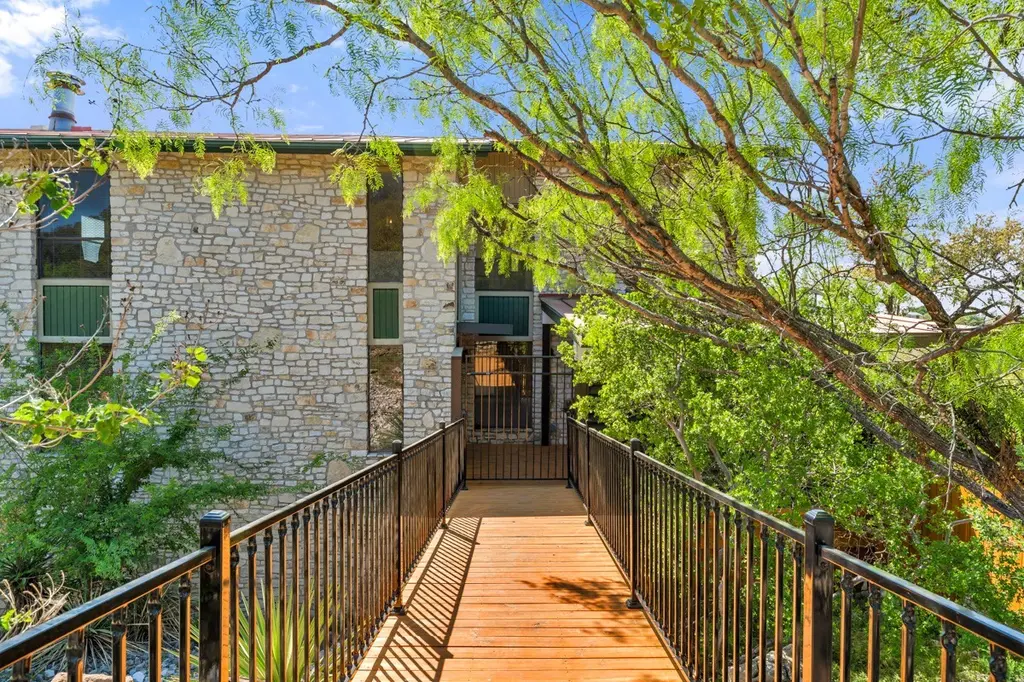
Tucked at the end of a private cul-de-sac in Horseshoe Bay, this 3,255 sq ft, 5-bedroom, 3.5-bath home offers a level of exclusivity that’s increasingly hard to find—being the only home on the street. Elevated positioning captures sweeping Hill Country views, adding a strong visual element that enhances guest appeal. The split-level layout creates natural separation across multiple living areas, allowing for a flexible, high-functioning setup. The real differentiator is the expansive deck, designed as the centerpiece of the property. An in-ground pool, outdoor kitchen, and generous entertaining space come together to deliver the kind of elevated experience today’s rental guests actively seek—without the maintenance of a traditional yard. Inside, ample storage and well-proportioned spaces support efficient operations and extended stays. With its privacy, views, and amenity-driven design, this property stands out as a compelling opportunity in the Horseshoe Bay market.
Key facts
- 0.28 acre lot
- 3 garage spots
- Pool
Neighborhood map
What this means for you Summary
Snapshot
- This is a 5-bed/4.0-bath single-family listed at $595k.
Deal economics
- At list price, monthly cash flow is $-980 ($-12k/yr) — negative.
- To cash-flow at today's rent, offer at most $422k (29.1% below list).
- To meet the 1% rule (rent ≥ 1% of price), the offer needs to be $378k (36.4% below list).
- Recommended offer: $378k (36.4% below list) — sets the bar for 1% rule.
- Cap rate 4.3% vs local median 1.0% in Horseshoe Bay — top-decile yield for the area; either an underpriced asset or a hidden risk that comps aren't pricing in. Stress-test before assuming the spread holds.
Location & tenants
- Location reads 66/100 on livability (#625 in TX) — a middle-class / working-renter tenant base. Strengths: crime A+, employment A-, housing A-; Watch: schools C-, amenities F, commute F.
- Llano ISD (town): math 40% / reading 43% proficiency, ranked #359 of 826 in TX (top 44%) — families likely to look elsewhere, expect single-tenant / working-renter base with shorter leases.
- Market conditions: 1223 active listings in the ZIP; 3 comparable units currently listed for rent nearby; rentals lingering (median 44d on market — plan ~5-8 weeks vacancy on turnover, expect pricing pressure); 100% of comp listings sitting > 30 days — soft ceiling on asking rent; solid renter incomes; 121 units permitted in Llano County in 2024 (0 in 5+ unit buildings).
- At $3,782/mo this rent would consume 50% of the median local household income ($91k/yr) (locally 45% of renters already pay >50% of income on rent) — very limited rent-growth headroom before tenants either downsize or default.
Forward outlook
- In year one you build about $10k of equity ($4k loan paydown + $6k appreciation (0.9% local appreciation)).
- Llano County population projected at +11% by 2050 — modest demand growth; plan on rents tracking national, not racing it.
- By year 4, paydown + projected appreciation supports a ~$36k cash-out refi (75% LTV) — recoverable capital for the next deal without selling this one.
Negotiation context
- It's been on market 84 days — a 6% lower offer ($559k) is reasonable based on typical stale-listing flexibility.
- 3 sale attempts since 11y ago with the ask held roughly flat each time — persistent listings suggest the price (not the market) is what's stuck; bring a comps-based counter.
Risks & watch-outs
- Climate carrying-cost: major wind risk, 55% chance of damaging wind over 30y; moderate wildfire risk; extreme-heat days projected 6→19/yr by 2055 (HVAC capex compounding) — expect insurance premiums to compound above CPI over the hold.
Questions for the listing agent
- What do current leases actually rent for vs. the listed asking? Can we see a recent rent roll and the last 12 months of T-12 income?
- It's been on market 84 days. Have you received any prior offers? Is the seller open to a 36% concession, seller financing, or rate buy-down credit?
- What does the HOA fee cover, when was the last increase, and are there any pending special assessments or reserve-fund shortfalls?
- Why hasn't it sold? Are there any deal-killer items the seller is aware of (foundation, flood, title, zoning, code violations)?
- Is there a deadline driving the sale (1031 exchange, divorce, estate, relocation)? That informs how much negotiation room exists.
- The area grade is low — what's the realistic commute time and amenity access for the typical tenant pool here? Any planned neighborhood developments (good or bad) we should know about?
- What's the average days-on-market for RENTAL listings here right now (not sales)? A rising rental-DOM trend means longer vacancies and softer asking-rent achievability than the comps imply.
- What's the recent tenant-quality profile in this submarket — average credit score on applications, eviction rate, late-payment / NSF rate, and stable-employment percentage? A property-management company in the area should have these aggregated.
- How much new for-sale + rental construction is in the pipeline within 1–3 miles? Heavy new supply typically softens prices + rents 12–24 months out; constrained supply supports both.
Investment metrics
- 1% rule
- 0.64% ✗
- Cap rate
- 4.32%
- Cash-on-cash
- -7.06%
- DSCR
- 0.69
- GRM
- 13.1
CMA / ARV
- ARV (median comp)
- $839,847
- List price
- $595,000
- Delta
- -29.15%
- Verdict
- UNDERPRICED
- Comps
- 18 within 1.0 mi
Show comp detail 4 sales within ~0.75 mi
| Address | Dist | Beds/Ba | Sqft | Sold | Price | $/sf | Match |
|---|---|---|---|---|---|---|---|
| 2820 Aurora | 0.50mi | 4/3.5 (-1) | 3,304 (+2%) | 8mo | $599,000 | $181 | 60 |
| 125 Cardinal | 0.65mi | 5/4.0 | 3,148 (-3%) | 11mo | $975,000 | $310 | 55 |
| 620 Hi Stirrup | 0.44mi | 4/3.5 (-1) | 3,008 (-8%) | 14mo | $895,000 | $298 | 48 |
| 2713 Aurora | 0.57mi | 4/5.0 (-1) | 3,124 (-4%) | 19mo | $950,000 | $304 | 42 |
Match score weights: distance 35% · size 25% · config 20% · recency 20%. Top-matched comps best support the ARV.
Projected returns pro-forma
0.95% appreciation · 3.0% rent growth · sell at horizon
- IRR
- -6.3%
- Equity multiple
- 0.68×
- Total profit
- $-52,931
- Equity at exit
- $201,432
- IRR
- -0.8%
- Equity multiple
- 0.90×
- Total profit
- $-16,835
- Equity at exit
- $266,383
Cash invested: $166,600 (down + closing). Projections, not guarantees.
Landlord ↔ Tenant lean methodology
- Overall (STATE)
- 87 Strongly Landlord-Friendly
- State Texas
- 87 Strongly Landlord-Friendly · R+5
- County
- — inherits STATE
- City
- — inherits STATE
ZIP-level market 78657
- Home prices YoY
- 0.4%
- Active inventory
- 1223
- Price-to-rent
- 13.1×
Monthly cashflow live
- Estimated rent
- $3,782 medium interval (Pro) →
- Mortgage (P&I)
- −$3,120
- Tax from tax record
- −$570 /mo · $6,843/yr
- Insurance
- −$248
- HOA
- −$30
- Vacancy / Maint / Mgmt
- −$794
- Net cashflow
- $-980
Break-even live
UW: 25.0% down · 7.5% · 30yr · 1.5% tax · 5.0% vac · 8.0% maint · 8.0% mgmt
Financing live
Cash to close
- Down payment
- $148,750
- Closing costs
- $17,850
- Reserves months
- —
- Total cash needed
- —
Loan-product check · same deal, 3 products live
Conventional
25% down · 7.5% · 30yr
- Down + closing
- —
- Monthly P&I
- —
- Monthly cashflow
- —
- DSCR
- —
- Eligible?
- —
Personal DTI + credit; lowest rate.
DSCR
20% down · 8.5% · 30yr
- Down + closing
- —
- Monthly P&I
- —
- Monthly cashflow
- —
- DSCR
- —
- Eligible?
- —
No personal income docs; deal must DSCR.
Hard money
10% down · 12.0% · 12mo
- Down + closing
- —
- Monthly P&I
- —
- Monthly cashflow
- —
- DSCR
- —
- Eligible?
- —
Short-term bridge; refi at stabilization.
Rent comps 3 comps
| Address | Beds | Baths | Sqft | Rent | $/sqft | DOM | Units | Dist |
|---|---|---|---|---|---|---|---|---|
| 305 Fire Dance Horseshoe Bay, TX | 4.0 | 3.0 | 2416 | $3,800 | $1.57 | 43d | 1 | 0.68mi |
| 820 Broken Arrow Horseshoe Bay, TX | 4.0 | 3.5 | 3328 | $4,590 | $1.38 | 43d | 1 | 1.12mi |
| 415 Horseshoe Bay North Blvd Unit 1 Horseshoe Bay, TX | 4.0 | 4.5 | 2375 | $3,500 | $1.47 | 43d | 1 | 1.18mi |
HOA detail
- Monthly dues
- $30 · $360/yr
- Likely covers
- pool
Listing history 25 events
-
2026-06-18days on market $595,000 Active 84 DOM
-
2026-06-17days on market $595,000 Active 83 DOM
-
2026-06-16days on market $595,000 Active 82 DOM
-
2026-06-15days on market $595,000 Active 81 DOM
-
2026-06-14days on market $595,000 Active 79 DOM
-
2026-06-13days on market $595,000 Active 78 DOM
-
2026-06-10days on market $595,000 Active 76 DOM
-
2026-06-09days on market $595,000 Active 75 DOM
-
2026-06-08days on market $595,000 Active 74 DOM
-
2026-06-07days on market $595,000 Active 73 DOM
-
2026-06-05days on market $595,000 Active 70 DOM
-
2026-06-03days on market $595,000 Active 69 DOM
-
2026-06-02days on market $595,000 Active 68 DOM
-
2026-06-01days on market $595,000 Active 67 DOM
-
2026-05-31days on market $595,000 Active 66 DOM
-
2026-05-31days on market $595,000 Active 65 DOM
-
2026-04-21price $595,000 1005-char remark
Show marketing remark (1005 chars)
Tucked at the end of a private cul-de-sac in Horseshoe Bay, this 3,255 sq ft, 5-bedroom, 3.5-bath home offers a level of exclusivity that’s increasingly hard to find—being the only home on the street. Elevated positioning captures sweeping Hill Country views, adding a strong visual element that enhances guest appeal. The split-level layout creates natural separation across multiple living areas, allowing for a flexible, high-functioning setup. The real differentiator is the expansive deck, designed as the centerpiece of the property. An in-ground pool, outdoor kitchen, and generous entertaining space come together to deliver the kind of elevated experience today’s rental guests actively seek—without the maintenance of a traditional yard. Inside, ample storage and well-proportioned spaces support efficient operations and extended stays. With its privacy, views, and amenity-driven design, this property stands out as a compelling opportunity in the Horseshoe Bay market.
-
2026-03-26$599,000 Active 1005-char remark
Show marketing remark (1005 chars)
Tucked at the end of a private cul-de-sac in Horseshoe Bay, this 3,255 sq ft, 5-bedroom, 3.5-bath home offers a level of exclusivity that’s increasingly hard to find—being the only home on the street. Elevated positioning captures sweeping Hill Country views, adding a strong visual element that enhances guest appeal. The split-level layout creates natural separation across multiple living areas, allowing for a flexible, high-functioning setup. The real differentiator is the expansive deck, designed as the centerpiece of the property. An in-ground pool, outdoor kitchen, and generous entertaining space come together to deliver the kind of elevated experience today’s rental guests actively seek—without the maintenance of a traditional yard. Inside, ample storage and well-proportioned spaces support efficient operations and extended stays. With its privacy, views, and amenity-driven design, this property stands out as a compelling opportunity in the Horseshoe Bay market.
-
2015-10-05soldstatus
-
2015-09-30soldstatus
-
2015-07-30$273,420
-
2009-06-01soldstatus
-
2000-05-24soldstatus
ⓘ Source: listings_history table (triggers on properties + properties_extension) + one-shot
backfill from property_details.listing_events for pre-trigger history.
Tax reassessment forecast TX · Resets to sale price
- Current annual tax
- $6,843 · $570/mo
- Projected year-2 tax
- $10,888 · $907/mo
- Expected delta
- +$4,046/yr (+$337/mo · 59.1%)
ⓘ Screening estimate from a state-policy table — verify with the county assessor before closing.
Climate risk First Street
- Flood 1/10 Low FEMA zone X (unshaded) · 0% chance over 30 yrs
- Wildfire 5/10 Major
- Heat 8/10 Severe 6 d/yr ≥106°F today · 19 d/yr by 30 yrs out
- Wind 6/10 Major 55% chance of damaging wind over 30 yrs
- Air quality 1/10 Low 0 unhealthy d/yr today · 0 by 30 yrs out
Nearby sold comps map
Loading sold comps map…
Walkable amenities ~0.75 mi
Loading nearby amenities…
Taxation est. · year 1
- Rental income
- $45,389
- − Mortgage interest
- −$33,329
- − Property taxes
- −$6,843
- − Insurance
- −$2,975
- − Repairs & maintenance
- −$3,631
- − Management
- −$3,631
- − HOA
- −$360
- − Depreciation
- −$17,309
- Taxable loss
- −$22,690
- Est. tax savings @ 24.0%
- +$5,446
- After-tax cash flow
- $-6,318/yr
For passive investors: Depreciation is non-cash, so a rental often shows a tax loss while cash-flowing — sheltering income. Rental losses are passive: they offset passive income freely, and up to $25,000/yr can offset ordinary (W-2) income if you actively participate and your MAGI is under $100k (phasing out to $0 by $150k); unused losses carry forward. On sale, claimed depreciation is recaptured at up to 25%, and gains may owe capital-gains tax (a 1031 exchange can defer both). Figures are a year-1 estimate at your 24.0% rate — not tax advice; consult a CPA.
Schools (NCES district)
- District
- Llano ISD
- NCES district ID
- 4827810
- Math proficiency
- 40% ▼ -5.00%
- Reading proficiency
- 43% ▼ -5.00%
- Median HH income
- $46,746
- Composite
- 35.42/100
- National rank
- #4940
- State rank
- #359 of 826 in TX
Livability — Horseshoe Bay
- Score
- 66/100
- State rank
- #625
- US rank
- #11913
Category grades
Schools grade is shown separately in the Schools card above.
Census & demographics
- Census place
- Horseshoe Bay, TX
- County
- Llano County · 16,310 people
- City population
- 7,591
- Metro
- nan
- Population (ZIP)
- 7,591
- Household income
- $91,452
- Rent vs Own
- Severe rent burden
- 45.0
Population outlook (Llano County) Hauer SSP2
- Today (2025)
- 20,847 people
- By 2030
- 21,350 · +2.4%
- By 2040
- 22,281 · +6.9%
- By 2050
- 23,173 · +11.2%
- By 2075
- 25,526 · +22.4%
- By 2100
- 25,866 · +24.1%
Race, ethnicity, and origin ACS 2023
- Neighborhood character
- Predominantly White (80%)
- Race & ethnicity
- White 80% Hispanic / Latino 16% Two or more races 8% Asian 1%
- Hispanic origin (detail)
- Mexican 14%
- Common ancestry
- Slovak 3% Portuguese 3% Italian 2%
- Foreign-born
- 8% · Canada
- Languages at home
- 87% English-only · Spanish 12% Other Indo-European 1%
Political lean MEDSL · Llano
- 2024 margin
- Solid R (+60.9) · D 19.2% · R 80.0%
- 2008→2024 swing
- -8.6pp toward R · 2008: -52.2pp · 2024: -60.9pp
- All cycles
- 2024: R+60.9 2020: R+60.1 2016: R+62.2 2012: R+60.4 2008: R+52.2
Not yet ingested
- Civics
- —
Market trends
- HPI YoY
- ▲ 0.95%
- Current HPI
- 229.9918
- Rent YoY
- —
- Metro
- nan
- State GDP YoY
- ▲ 3.95%
- F500 in state
- 110
Industry mix (Fortune 500 HQ in TX)
| Industry | F500 HQs | Revenue |
|---|---|---|
| Energy | 16 | $1,198B |
|
||
| Technology | 5 | $198B |
|
||
| Engineering / Construction | 4 | $72B |
|
||
| Energy Services | 3 | $60B |
|
||
| Utilities | 3 | $41B |
|
||
| Healthcare | 2 | $330B |
|
||
Price history
+117.6% since first listed9 events — show timeline
- 2026-04-21 Price Changed $595,000 HLMLS as distributed by MLS GRID
- 2026-04-21 Price Changed $595,000 Unlock MLS
- 2026-03-26 Listed $599,000 Unlock MLS
- 2026-03-26 Listed $599,000 HLMLS as distributed by MLS GRID
- 2015-10-05 Sold (Public Records) — Public Records
- 2015-09-30 Sold (MLS) — Unlock MLS
- 2015-07-30 Listed $273,420 Unlock MLS
- 2009-06-01 Sold (Public Records) — Public Records
- 2000-05-24 Sold (Public Records) — Public Records
Property tax history
+6.8%/yrLatest (2025): $6,843 · +1.5% YoY. Source: county tax records.
Cash-flow waterfall
monthlySold comps — $/sqft
last 12 mo · ≤1 miLoading sold comps…