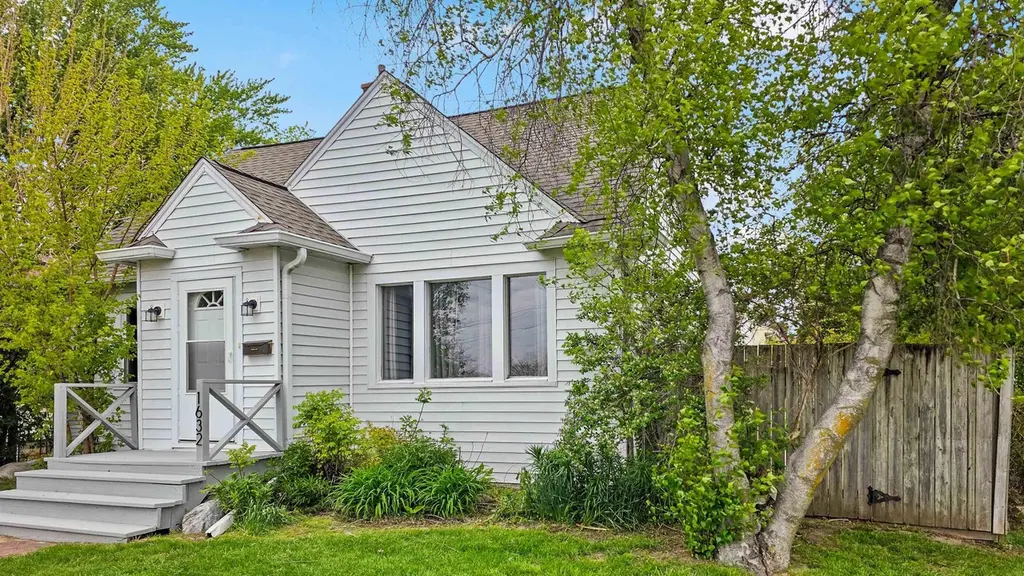
1632 East St · Cedar Falls, IA
Flood risk 1/10 · Minimal
- FEMA flood zone
- X (unshaded)
- Chance of flooding over 30 yrs
- 0.0%
- Est. flood insurance / yr
- $473 – $860
Fire risk 3/10 · Minor
- Est. fire insurance / yr
- $902 – $1,676
Heat risk 3/10 · Minor
- Hot days now (above 101°F)
- 7 days/yr
- Hot days in 30 yrs
- 15 days/yr
Wind risk 2/10 · Minimal
- Chance of severe wind over 30 yrs
- —
Air-quality risk 1/10 · Minimal
- Unhealthy air days now
- 0 days/yr
- Unhealthy air days in 30 yrs
- 0 days/yr
Risk factors via First Street. Map © Google.
Why this score? — see what drove the D- grade
The composite is a weighted blend of 9 inputs, each scored 0–100. Each bar is that input's sub-score; the figure is the points it added to the 100-point composite (weight × sub-score).
- ARV discount +11.1/15.0
- Cash flow +7.6/30.0
- Schools +6.6/10.0
- Livability +4.0/5.0
- Rent growth +3.0/5.0
- Condition / age +2.5/5.0
- 1% rule +2.0/10.0
- DSCR +1.7/10.0
- Appreciation +0.0/10.0
$208,900
🖨 Deal sheet (PDF) 📄 Offer letter ✓ Due diligence
Listing remarks MLS
Ready to move into hard to find Cedar Falls 4 bedroom 2 bath home with new carpet and fresh paint, 2 stall garage and more. Call for additional details or to schedule your showing. Brad Page 319-404-8899
Key facts
- Fenced back yard
- Formal dining area
- Attached 3/4 bath
Tags
Property features AI
Exterior
- Parking: Detached carport; Two carport spaces
- Security: Smoke detectors
- Utilities: Public water; Public sewer
- Home design: Single-family residence; Residential property; Corner lot
- Construction: Steel siding; Shingle/asphalt roof; Basement: partially finished block and concrete with interior entry and sump pump; Below-grade finished area included
- Exterior features: Patio; Privacy fencing (fenced yard)
Interior
- Kitchen: Dishwasher; Free-standing range; Refrigerator
- Bathrooms: Two full bathrooms; One three-quarter bathroom
- Heating & cooling: Central air conditioning; Ceiling fans; Forced air heating; Natural gas heating
- Interior features: Ceiling fans
- Laundry & utility: Laundry room with washer hookup; Gas dryer hookup; Washer hookup; Gas dryer hookup; Gas water heater
Neighborhood map
What this means for you Summary
Snapshot
- This is a 3-bed/2.5-bath single-family listed at $209k.
Deal economics
- At list price, monthly cash flow is $-250 ($-3k/yr) — negative.
- To cash-flow at today's rent, offer at most $165k (21.1% below list).
- To meet the 1% rule (rent ≥ 1% of price), the offer needs to be $147k (29.6% below list).
- Recommended offer: $147k (29.6% below list) — sets the bar for 1% rule.
- Cap rate 4.9% vs local median 3.1% in Cedar Falls — top-decile yield for the area; either an underpriced asset or a hidden risk that comps aren't pricing in. Stress-test before assuming the spread holds.
Location & tenants
- Location reads 81/100 on livability (#60 in IA, #1,357 nationally) — a professional / high-income tenant draw. Strengths: cost of living A+, housing A+, health & safety A+; Watch: amenities D, commute F.
- Cedar Falls Community School District (urban): math 76% / reading 79% proficiency, ranked #45 of 289 in IA (top 16%) — strong family-tenant draw, lease renewals of 3-5y typical; only 18% free/reduced lunch — higher-income household profile.
- Zoned schools: Cedar Heights Elementary School (math 70% / reading 74%, grade A-, #181 of 616 statewide, top 34%, 474 students, 40% FRL); Peet Junior High School (math 79% / reading 80%, grade A+, #35 of 246 statewide, top 16%, 670 students, 27% FRL); Cedar Falls High School (math 74% / reading 78%, grade A-, #75 of 336 statewide, top 23%, 1,302 students, 24% FRL).
- Market conditions: Rents rising (+2.0%/yr); 389 active listings in the ZIP; 11 comparable units currently listed for rent nearby; rentals at typical pace (median 23d on market — plan ~3-4 weeks tenant-placement turnaround); 45% of comp listings sitting > 30 days — soft ceiling on asking rent; solid renter incomes; 287 units permitted in Black Hawk County in 2024 (67 in 5+ unit buildings).
Forward outlook
- Local home prices are declining (-3.0%/yr); year-one equity from $1k of loan paydown is wiped out by about $6k of value loss. Plan a longer hold.
- Black Hawk County population projected at +10% by 2050 — modest demand growth; plan on rents tracking national, not racing it.
Negotiation context
- Only 1 days on market — expect competitive offers; lowballing is unlikely to land.
- 2 sale attempts since 6y ago with the ask held roughly flat each time — persistent listings suggest the price (not the market) is what's stuck; bring a comps-based counter.
Risks & watch-outs
- Watch-outs: built in 1935 — expect roof / HVAC / electrical / plumbing capex.
Questions for the listing agent
- What do current leases actually rent for vs. the listed asking? Can we see a recent rent roll and the last 12 months of T-12 income?
- Built in 1935 — when were the roof, HVAC, electrical panel, plumbing, and water heater last replaced?
- Is there a deadline driving the sale (1031 exchange, divorce, estate, relocation)? That informs how much negotiation room exists.
- Schools are A-rated — typically a magnet for longer-tenancy family renters. What's the average tenant stay here, and is there a school-zone premium baked into asking?
- The area grade is low — what's the realistic commute time and amenity access for the typical tenant pool here? Any planned neighborhood developments (good or bad) we should know about?
- What's the average days-on-market for RENTAL listings here right now (not sales)? A rising rental-DOM trend means longer vacancies and softer asking-rent achievability than the comps imply.
- What's the recent tenant-quality profile in this submarket — average credit score on applications, eviction rate, late-payment / NSF rate, and stable-employment percentage? A property-management company in the area should have these aggregated.
- How much new for-sale + rental construction is in the pipeline within 1–3 miles? Heavy new supply typically softens prices + rents 12–24 months out; constrained supply supports both.
Investment metrics
- 1% rule
- 0.70% ✗
- Cap rate
- 4.86%
- Cash-on-cash
- -5.13%
- DSCR
- 0.77
- GRM
- 11.8
CMA / ARV
- ARV (median comp)
- $226,997
- List price
- $208,900
- Delta
- -7.97%
- Verdict
- FAIR
- Comps
- 20 within 1.0 mi
Show comp detail 12 sales within ~0.75 mi
| Address | Dist | Beds/Ba | Sqft | Sold | Price | $/sf | Match |
|---|---|---|---|---|---|---|---|
| 1632 East St | 0.00mi | 4/3.0 (+1) | 1,712 (+6%) | 0mo | $220,000 | $129 | 82 |
| 1117 E Seerley Blvd | 0.60mi | 3/2.0 | 1,600 (-1%) | 1mo | $224,900 | $141 | 68 |
| 1917 Victory Dr | 0.58mi | 3/2.0 | 1,585 (-2%) | 3mo | $198,000 | $125 | 65 |
| 2015 Waterloo Rd | 0.32mi | 4/2.0 (+1) | 1,736 (+8%) | 2mo | $192,500 | $111 | 64 |
| 1204 Sunnyside Cir | 0.50mi | 4/1.5 (+1) | 1,577 (-2%) | 2mo | $230,000 | $146 | 63 |
| 1422 Main St | 0.39mi | 4/2.0 (+1) | 1,732 (+7%) | 1mo | $160,000 | $92 | 62 |
| 912 Melrose Drive Dr | 0.39mi | 4/2.0 (+1) | 1,722 (+7%) | 3mo | $250,500 | $145 | 61 |
| 909 Grove St | 0.52mi | 3/2.0 | 1,462 (-9%) | 1mo | $180,000 | $123 | 58 |
| 2519 Valley Park Dr | 0.62mi | 4/2.0 (+1) | 1,513 (-6%) | 2mo | $241,000 | $159 | 52 |
| 1139 Madison St | 0.44mi | 2/1.0 (-1) | 1,448 (-10%) | 1mo | $227,000 | $157 | 50 |
| 920 Royal Dr | 0.47mi | 3/1.5 | 1,388 (-14%) | 3mo | $219,900 | $158 | 49 |
| 1421 Rainbow Dr | 0.53mi | 2/1.0 (-1) | 1,430 (-11%) | 2mo | $189,900 | $133 | 43 |
Match score weights: distance 35% · size 25% · config 20% · recency 20%. Top-matched comps best support the ARV.
Projected returns pro-forma
-3.0% appreciation · 1.97% rent growth · sell at horizon
- IRR
- -26.2%
- Equity multiple
- 0.12×
- Total profit
- $-51,284
- Equity at exit
- $31,148
- IRR
- -26.6%
- Equity multiple
- -0.22×
- Total profit
- $-71,220
- Equity at exit
- $18,062
Cash invested: $58,492 (down + closing). Projections, not guarantees.
Landlord ↔ Tenant lean methodology
- Overall (STATE)
- 83 Strongly Landlord-Friendly
- State Iowa
- 83 Strongly Landlord-Friendly · R+6
- County
- — inherits STATE
- City
- — inherits STATE
ZIP-level market 50613
- Rents YoY
- 2.0%
- Active inventory
- 389
- Price-to-rent
- 11.8×
Monthly cashflow live
- Estimated rent
- $1,471 high interval (Pro) →
- Mortgage (P&I)
- −$1,095
- Tax from tax record
- −$230 /mo · $2,756/yr
- Insurance
- −$87
- HOA
- −$0
- Vacancy / Maint / Mgmt
- −$309
- Net cashflow
- $-250
Break-even live
Sensitivity live
| Price | -10% $-132 | -5% $-191 | +0% $-250 | +5% $-309 | +10% $-368 |
|---|---|---|---|---|---|
| Rent | -10% $-366 | -5% $-308 | +0% $-250 | +5% $-192 | +10% $-134 |
| Rate | -1.0pp $-145 | -0.5pp $-197 | base $-250 | +0.5pp $-304 | +1.0pp $-359 |
UW: 25.0% down · 7.5% · 30yr · 1.5% tax · 5.0% vac · 8.0% maint · 8.0% mgmt
Financing live
Cash to close
- Down payment
- $52,225
- Closing costs
- $6,267
- Reserves months
- —
- Total cash needed
- —
Loan-product check · same deal, 3 products live
Conventional
25% down · 7.5% · 30yr
- Down + closing
- —
- Monthly P&I
- —
- Monthly cashflow
- —
- DSCR
- —
- Eligible?
- —
Personal DTI + credit; lowest rate.
DSCR
20% down · 8.5% · 30yr
- Down + closing
- —
- Monthly P&I
- —
- Monthly cashflow
- —
- DSCR
- —
- Eligible?
- —
No personal income docs; deal must DSCR.
Hard money
10% down · 12.0% · 12mo
- Down + closing
- —
- Monthly P&I
- —
- Monthly cashflow
- —
- DSCR
- —
- Eligible?
- —
Short-term bridge; refi at stabilization.
Rent comps 11 comps
| Address | Beds | Baths | Sqft | Rent | $/sqft | DOM | Units | Dist |
|---|---|---|---|---|---|---|---|---|
| 2110 Melrose Ct Cedar Falls, IA | 4.0 | 2.0 | 1100 | $1,250 | $1.14 | 23d | 1 | 0.31mi |
| 1014 Main St Cedar Falls, IA | 2.0 | 1.0 | 1400 | $1,500 | $1.07 | 45d | 1 | 0.56mi |
| 1803 Franklin St Unit 1803 Cedar Falls, IA | 4.0 | 1.0 | 1200 | $1,400 | $1.17 | 45d | 1 | 0.61mi |
| 221 E 5th St #209 Cedar Falls, IA | 2.0 | 2.0 | 1200 | $2,000 | $1.67 | 45d | 1 | 0.80mi |
| 2208 Walnut St Cedar Falls, IA | 3.0 | 1.0 | 1380 | $1,400 | $1.01 | 45d | 1 | 0.86mi |
| 604 W Seerley Blvd Cedar Falls, IA | 4.0 | 1.5 | 1600 | $1,300 | $0.81 | 23d | 1 | 0.89mi |
| 2311 Olive St Cedar Falls, IA | 3.0–4.0 | 1.0 | 1050 | $995 | $0.95 | 23d | 2 | 0.97mi |
| 2515 Olive St Cedar Falls, IA | 3.0 | 1.0 | 1380 | $975 | $0.71 | 23d | 1 | 1.05mi |
| 2609 Olive St Cedar Falls, IA | 4.0 | 2.0–2.5 | 1568 | $1,750 | $1.12 | 23d | 6 | 1.09mi |
| 1902 Campus St Cedar Falls, IA | 3.0 | 2.0 | 1300 | $1,350 | $1.04 | 23d | 1 | 1.15mi |
| 1320-1322 Delta Dr Unit 1322 (South Side) Cedar Falls, IA | 3.0 | 2.0 | 1664 | $1,350 | $0.81 | 45d | 1 | 1.44mi |
Listing history 5 events
-
2026-05-09status Pending 490-char remark
-
2026-05-07$208,900 Active 490-char remark
-
2020-03-26soldstatus $147,500
-
2020-03-24soldstatus $147,500 203-char remark
Show marketing remark (203 chars)
Ready to move into hard to find Cedar Falls 4 bedroom 2 bath home with new carpet and fresh paint, 2 stall garage and more. Call for additional details or to schedule your showing. Brad Page 319-404-8899
-
2020-01-31$149,900 203-char remark
Show marketing remark (203 chars)
Ready to move into hard to find Cedar Falls 4 bedroom 2 bath home with new carpet and fresh paint, 2 stall garage and more. Call for additional details or to schedule your showing. Brad Page 319-404-8899
ⓘ Source: listings_history table (triggers on properties + properties_extension) + one-shot
backfill from property_details.listing_events for pre-trigger history.
Tax reassessment forecast IA · Partial reset (capped growth)
- Current annual tax
- $2,756 · $230/mo
- Projected year-2 tax
- $3,018 · $251/mo
- Expected delta
- +$262/yr (+$22/mo · 9.5%)
ⓘ Screening estimate from a state-policy table — verify with the county assessor before closing.
Climate risk First Street
- Flood 1/10 Low FEMA zone X (unshaded) · 0% chance over 30 yrs
- Wildfire 3/10 Moderate
- Heat 3/10 Moderate 7 d/yr ≥101°F today · 15 d/yr by 30 yrs out
- Wind 2/10 Low
- Air quality 1/10 Low 0 unhealthy d/yr today · 0 by 30 yrs out
Nearby sold comps map
Loading sold comps map…
Walkable amenities ~0.75 mi
Loading nearby amenities…
Taxation est. · year 1
- Rental income
- $17,653
- − Mortgage interest
- −$11,702
- − Property taxes
- −$2,756
- − Insurance
- −$1,044
- − Repairs & maintenance
- −$1,412
- − Management
- −$1,412
- − Depreciation
- −$6,077
- Taxable loss
- −$6,751
- Est. tax savings @ 24.0%
- +$1,620
- After-tax cash flow
- $-1,381/yr
For passive investors: Depreciation is non-cash, so a rental often shows a tax loss while cash-flowing — sheltering income. Rental losses are passive: they offset passive income freely, and up to $25,000/yr can offset ordinary (W-2) income if you actively participate and your MAGI is under $100k (phasing out to $0 by $150k); unused losses carry forward. On sale, claimed depreciation is recaptured at up to 25%, and gains may owe capital-gains tax (a 1031 exchange can defer both). Figures are a year-1 estimate at your 24.0% rate — not tax advice; consult a CPA.
Schools (NCES district)
- District
- Cedar Falls Community School District
- NCES district ID
- 1906510
- Math proficiency
- 76% ▼ -6.00%
- Reading proficiency
- 79% ▼ -2.00%
- Median HH income
- $53,634
- Composite
- 65.93/100
- National rank
- #443
- State rank
- #45 of 289 in IA
Livability — Cedar Falls
- Score
- 81/100
- State rank
- #60
- US rank
- #1357
Category grades
Schools grade is shown separately in the Schools card above.
Census & demographics
- Census place
- Cedar Falls, IA
- County
- Black Hawk County · 112,933 people
- City population
- 43,867
- Metro
- Waterloo-Cedar Falls, IA
- Population (ZIP)
- 43,867
- Household income
- $78,503
- Rent vs Own
- Severe rent burden
- 1514.0
Population outlook (Black Hawk County) Hauer SSP2
- Today (2025)
- 139,716 people
- By 2030
- 142,853 · +2.2%
- By 2040
- 147,843 · +5.8%
- By 2050
- 153,247 · +9.7%
- By 2075
- 167,977 · +20.2%
- By 2100
- 177,320 · +26.9%
Race, ethnicity, and origin ACS 2023
- Neighborhood character
- Predominantly White (90%)
- Race & ethnicity
- White 90% Asian 3% Two or more races 3% Hispanic / Latino 3% Black 1%
- Common ancestry
- Portuguese 6% Italian 3% Iranian 3%
- Foreign-born
- 4% · Canada, South Korea
- Languages at home
- 95% English-only · Spanish 2% Russian/Polish/Slavic 1% Other Indo-European 1%
Political lean MEDSL · Black Hawk
- 2024 margin
- Toss-up / Even · D 50.0% · R 48.8% · Other 1.2%
- 2008→2024 swing
- -21.3pp toward R · 2008: 22.4pp · 2024: 1.2pp
- All cycles
- 2024: D+1.2 2020: D+9.0 2016: D+7.3 2012: D+20.0 2008: D+22.4
Not yet ingested
- Civics
- —
Market trends
- HPI YoY
- ▼ -175.51%
- Current HPI
- 169.0591
- Rent YoY
- ▲ 1.97%
- Metro
- Waterloo-Cedar Falls, IA
- State GDP YoY
- ▲ 2.48%
- F500 in state
- 4
Industry mix (Fortune 500 HQ in IA)
| Industry | F500 HQs | Revenue |
|---|---|---|
| Financial Services | 1 | $16B |
|
||
| Retail / Convenience | 1 | $15B |
|
||
Price history
+46.8% since first listed6 events — show timeline
- 2026-06-12 Sold (MLS) $220,000 NEIRBR as distributed by MLS GRID
- 2026-05-09 Pending — NEIRBR as distributed by MLS GRID
- 2026-05-07 Listed $208,900 NEIRBR as distributed by MLS GRID
- 2020-03-26 Sold (Public Records) $147,500 Public Records
- 2020-03-24 Sold (MLS) $147,500 NEIRBR as distributed by MLS GRID
- 2020-01-31 Listed $149,900 NEIRBR as distributed by MLS GRID
Property tax history
+3.4%/yrLatest (2025): $2,756 · +2.9% YoY. Source: county tax records.
Cash-flow waterfall
monthlySold comps — $/sqft
last 12 mo · ≤1 miLoading sold comps…