 60-Plex
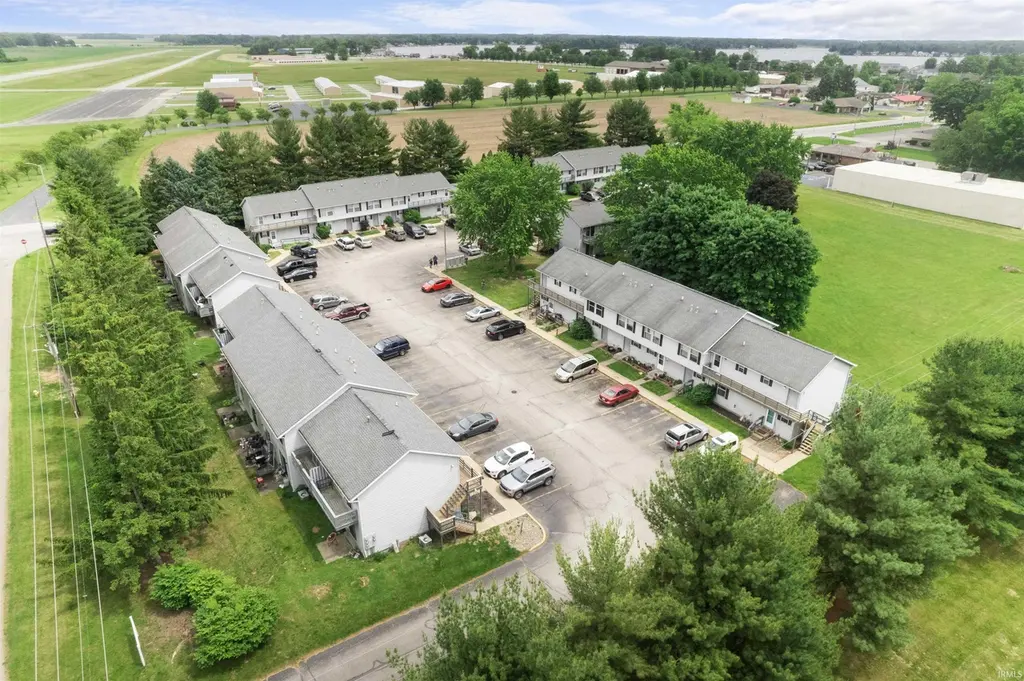
652 Northgate Cir · Rochester, IN
Flood risk 1/10 · Minimal
- FEMA flood zone
- X (unshaded)
- Chance of flooding over 30 yrs
- 0.0%
- Est. flood insurance / yr
- $507 – $1,088
Fire risk 1/10 · Minimal
- Est. fire insurance / yr
- $717 – $1,331
Heat risk 3/10 · Minor
- Hot days now (above 100°F)
- 7 days/yr
- Hot days in 30 yrs
- 16 days/yr
Wind risk 2/10 · Minimal
- Chance of severe wind over 30 yrs
- —
Air-quality risk 3/10 · Minor
- Unhealthy air days now
- 1 days/yr
- Unhealthy air days in 30 yrs
- 3 days/yr
Risk factors via First Street. Map © Google.
Why this score? — see what drove the C+ grade
The composite is a weighted blend of 9 inputs, each scored 0–100. Each bar is that input's sub-score; the figure is the points it added to the 100-point composite (weight × sub-score).
- Cash flow +25.7/30.0
- DSCR +8.6/10.0
- ARV discount +7.5/15.0
- 1% rule +6.8/10.0
- Condition / age +4.2/5.0
- Livability +3.5/5.0
- Schools +3.0/10.0
- Rent growth +2.5/5.0
- Appreciation +0.0/10.0
$5,395,000
🖨 Deal sheet 📄 Offer letter ✓ Due diligence
Multi-family units
County records classify this as Multi-Family (5+ Unit). Listing-text estimate: 60 units. confirmed
5+ unit building — per-unit beds/baths from public records are typically unavailable; the breakdown below (if shown) is an estimate from the listing text.
Listing remarks MLS
Northgate Apartments, located at 652 Northgate Cir in Rochester, Indiana, is a well-maintained 60-unit multifamily community offering a diverse unit mix and strong in-place performance. Built in 1986, the property features six, two-story buildings with an efficient layout. The property includes a balanced unit mix of 24 studio units, 26 two-bedroom townhomes, and 10 two-bedroom apartment units, catering to a wide range of tenant needs. Notably, the two-bedroom townhomes and two-bedroom apartment units are equipped with in-unit washer and dryer, enhancing tenant convenience and overall desirability.
Key facts
- 3.97 acre lot
- 120 parking spots
- Built 1986
Tags
Neighborhood map
What this means for you Summary
Snapshot
- This is a 24×1bd/1ba + 36×2bd/1ba units multifamily listed at $5.39M. Condition is rated good.
Deal economics
- At list price, monthly cash flow is $13k ($155k/yr) — positive. Per door: $216/mo.
- The deal already cash-flows at list — no discount required.
- Meets the 1% rule at list price ($64k rent vs $5.39M).
- Recommended offer: $5.23M (3.0% below list) — sets the bar for market timing.
- Cap rate 9.2% vs local median 2.4% in Rochester — top-decile yield for the area; either an underpriced asset or a hidden risk that comps aren't pricing in. Stress-test before assuming the spread holds.
Location & tenants
- Location reads 69/100 on livability (#206 in IN) — a middle-class / working-renter tenant base. Strengths: cost of living A+, housing A+, health & safety A; Watch: employment D, schools F, amenities F.
- Rochester Community School Corporation (town): math 31% / reading 41% proficiency, ranked #188 of 301 in IN (top 62%) — families likely to look elsewhere, expect single-tenant / working-renter base with shorter leases.
- Market conditions: 97 active listings in the ZIP; 23 units permitted in Fulton County in 2024 (0 in 5+ unit buildings).
- At $63,572/mo this rent would consume 1247% of the median local household income ($61k/yr) (locally 238% of renters already pay >50% of income on rent) — very limited rent-growth headroom before tenants either downsize or default.
Forward outlook
- Local home prices are declining (-3.0%/yr); year-one equity from $37k of loan paydown is wiped out by about $162k of value loss. Plan a longer hold.
- Fulton County population projected at -13% by 2050 — secular population decline; favor cash flow + early exit over multi-decade hold.
Negotiation context
- It's been on market 54 days — a 3% lower offer ($5.23M) is reasonable based on typical stale-listing flexibility.
Questions for the listing agent
- It's been on market 54 days. Have you received any prior offers? Is the seller open to a 3% concession, seller financing, or rate buy-down credit?
- Can we see the unit-by-unit rent roll, current vacancy, and any below-market leases? What's the average tenancy length?
- What capital expenditures (roof, boiler, parking lot, exteriors) have been made in the last 5 years, and what's planned in the next 2?
- Is there a deadline driving the sale (1031 exchange, divorce, estate, relocation)? That informs how much negotiation room exists.
- Schools are F-rated, which usually means shorter tenancies and higher turnover. Who's the typical renter profile here, and what's been the actual vacancy rate?
- What's the average days-on-market for RENTAL listings here right now (not sales)? A rising rental-DOM trend means longer vacancies and softer asking-rent achievability than the comps imply.
- What's the recent tenant-quality profile in this submarket — average credit score on applications, eviction rate, late-payment / NSF rate, and stable-employment percentage? A property-management company in the area should have these aggregated.
- How much new apartment / multifamily construction is in the pipeline within 1–3 miles? Heavy new supply (>2% of stock underway) typically softens rents 12–24 months out; light construction supports rent growth.
Investment metrics
- 1% rule
- 1.18% ✓
- Cap rate
- 9.17%
- Cash-on-cash
- 10.28%
- DSCR
- 1.46
- GRM
- 7.1
CMA / ARV
No comps found within radius.
Projected returns pro-forma
-3.0% appreciation · 3.0% rent growth · sell at horizon
- IRR
- -0.9%
- Equity multiple
- 0.97×
- Total profit
- $-49,219
- Equity at exit
- $804,412
- IRR
- 8.8%
- Equity multiple
- 1.68×
- Total profit
- $1,022,127
- Equity at exit
- $466,461
Cash invested: $1,510,600 (down + closing). Projections, not guarantees.
Landlord ↔ Tenant lean methodology
- Overall (STATE)
- 90 Strongly Landlord-Friendly
- State Indiana
- 90 Strongly Landlord-Friendly · R+11
- County
- — inherits STATE
- City
- — inherits STATE
ZIP-level market 46975
- Home prices YoY
- -28.7%
- Active inventory
- 97
- Price-to-rent
- 439.6×
Monthly cashflow live
- Estimated rent
- $63,572 medium interval (Pro) →
- Mortgage (P&I)
- −$28,292
- Tax est. 1.5%
- −$6,744 /mo · $80,925/yr
- Insurance
- −$2,248
- HOA
- −$0
- Vacancy / Maint / Mgmt
- −$13,350
- Net cashflow
- $12,938
Break-even live
60-unit breakdown (identical units grouped — click to expand)
| Units | Beds | Baths | Est. rent |
|---|---|---|---|
| 24× units | 1 | 1 | $24,552 |
| #1 | 1 | 1 | $1,023 |
| #2 | 1 | 1 | $1,023 |
| #3 | 1 | 1 | $1,023 |
| #4 | 1 | 1 | $1,023 |
| #5 | 1 | 1 | $1,023 |
| #6 | 1 | 1 | $1,023 |
| #7 | 1 | 1 | $1,023 |
| #8 | 1 | 1 | $1,023 |
| #9 | 1 | 1 | $1,023 |
| #10 | 1 | 1 | $1,023 |
| #11 | 1 | 1 | $1,023 |
| #12 | 1 | 1 | $1,023 |
| #13 | 1 | 1 | $1,023 |
| #14 | 1 | 1 | $1,023 |
| #15 | 1 | 1 | $1,023 |
| #16 | 1 | 1 | $1,023 |
| #17 | 1 | 1 | $1,023 |
| #18 | 1 | 1 | $1,023 |
| #19 | 1 | 1 | $1,023 |
| #20 | 1 | 1 | $1,023 |
| #21 | 1 | 1 | $1,023 |
| #22 | 1 | 1 | $1,023 |
| #23 | 1 | 1 | $1,023 |
| #24 | 1 | 1 | $1,023 |
| 36× units | 2 | 1 | $39,024 |
| #25 | 2 | 1 | $1,084 |
| #26 | 2 | 1 | $1,084 |
| #27 | 2 | 1 | $1,084 |
| #28 | 2 | 1 | $1,084 |
| #29 | 2 | 1 | $1,084 |
| #30 | 2 | 1 | $1,084 |
| #31 | 2 | 1 | $1,084 |
| #32 | 2 | 1 | $1,084 |
| #33 | 2 | 1 | $1,084 |
| #34 | 2 | 1 | $1,084 |
| #35 | 2 | 1 | $1,084 |
| #36 | 2 | 1 | $1,084 |
| #37 | 2 | 1 | $1,084 |
| #38 | 2 | 1 | $1,084 |
| #39 | 2 | 1 | $1,084 |
| #40 | 2 | 1 | $1,084 |
| #41 | 2 | 1 | $1,084 |
| #42 | 2 | 1 | $1,084 |
| #43 | 2 | 1 | $1,084 |
| #44 | 2 | 1 | $1,084 |
| #45 | 2 | 1 | $1,084 |
| #46 | 2 | 1 | $1,084 |
| #47 | 2 | 1 | $1,084 |
| #48 | 2 | 1 | $1,084 |
| #49 | 2 | 1 | $1,084 |
| #50 | 2 | 1 | $1,084 |
| #51 | 2 | 1 | $1,084 |
| #52 | 2 | 1 | $1,084 |
| #53 | 2 | 1 | $1,084 |
| #54 | 2 | 1 | $1,084 |
| #55 | 2 | 1 | $1,084 |
| #56 | 2 | 1 | $1,084 |
| #57 | 2 | 1 | $1,084 |
| #58 | 2 | 1 | $1,084 |
| #59 | 2 | 1 | $1,084 |
| #60 | 2 | 1 | $1,084 |
| Total (60 units) | $63,572 | ||
UW: 25.0% down · 7.5% · 30yr · 1.5% tax · 5.0% vac · 8.0% maint · 8.0% mgmt
Financing live
Cash to close
- Down payment
- $1,348,750
- Closing costs
- $161,850
- Reserves months
- —
- Total cash needed
- —
Loan-product check · same deal, 3 products live
Conventional
25% down · 7.5% · 30yr
- Down + closing
- —
- Monthly P&I
- —
- Monthly cashflow
- —
- DSCR
- —
- Eligible?
- —
Personal DTI + credit; lowest rate.
DSCR
20% down · 8.5% · 30yr
- Down + closing
- —
- Monthly P&I
- —
- Monthly cashflow
- —
- DSCR
- —
- Eligible?
- —
No personal income docs; deal must DSCR.
Hard money
10% down · 12.0% · 12mo
- Down + closing
- —
- Monthly P&I
- —
- Monthly cashflow
- —
- DSCR
- —
- Eligible?
- —
Short-term bridge; refi at stabilization.
Listing history 9 events
-
2026-06-09days on market $5,395,000 Active 54 DOM
-
2026-06-08days on market $5,395,000 Active 53 DOM
-
2026-06-07days on market $5,395,000 Active 52 DOM
-
2026-06-03days on market $5,395,000 Active 48 DOM
-
2026-06-02days on market $5,395,000 Active 47 DOM
-
2026-06-01days on market $5,395,000 Active 46 DOM
-
2026-05-31days on market $5,395,000 Active 45 DOM
-
2026-05-31days on market $5,395,000 Active 44 DOM
-
2026-04-16$5,395,000 Active 605-char remark
Show marketing remark (605 chars)
Northgate Apartments, located at 652 Northgate Cir in Rochester, Indiana, is a well-maintained 60-unit multifamily community offering a diverse unit mix and strong in-place performance. Built in 1986, the property features six, two-story buildings with an efficient layout. The property includes a balanced unit mix of 24 studio units, 26 two-bedroom townhomes, and 10 two-bedroom apartment units, catering to a wide range of tenant needs. Notably, the two-bedroom townhomes and two-bedroom apartment units are equipped with in-unit washer and dryer, enhancing tenant convenience and overall desirability.
ⓘ Source: listings_history table (triggers on properties + properties_extension) + one-shot
backfill from property_details.listing_events for pre-trigger history.
Climate risk First Street
- Flood 1/10 Low FEMA zone X (unshaded) · 0% chance over 30 yrs
- Wildfire 1/10 Low
- Heat 3/10 Moderate 7 d/yr ≥100°F today · 16 d/yr by 30 yrs out
- Wind 2/10 Low
- Air quality 3/10 Moderate 1 unhealthy d/yr today · 3 by 30 yrs out
Nearby sold comps map
Loading sold comps map…
Walkable amenities ~0.75 mi
Loading nearby amenities…
Taxation est. · year 1
- Rental income
- $762,864
- − Mortgage interest
- −$302,204
- − Property taxes
- −$80,925
- − Insurance
- −$26,975
- − Repairs & maintenance
- −$61,029
- − Management
- −$61,029
- − Depreciation
- −$156,945
- Taxable income
- $73,756
- Est. tax owed @ 24.0%
- −$17,702
- After-tax cash flow
- $137,557/yr
For passive investors: Depreciation is non-cash, so a rental often shows a tax loss while cash-flowing — sheltering income. Rental losses are passive: they offset passive income freely, and up to $25,000/yr can offset ordinary (W-2) income if you actively participate and your MAGI is under $100k (phasing out to $0 by $150k); unused losses carry forward. On sale, claimed depreciation is recaptured at up to 25%, and gains may owe capital-gains tax (a 1031 exchange can defer both). Figures are a year-1 estimate at your 24.0% rate — not tax advice; consult a CPA.
Condition & rehab AI · 13 photos
This well-maintained multi-family property offers a good investment opportunity with minimal repairs and updates needed. The exterior and interior are in good condition, and updates to the exterior and interior can significantly enhance its value.
Value-add opportunities
- Both Painting exterior and interior walls — Enhances curb appeal and interior aesthetics
- Both Re-carpeting or re-laying flooring — Improves comfort and appearance
- Both Upgrading kitchen appliances — Modernizes the space and attracts tenants
Renovation cost estimate screening
Value-add ROI direction
- Both Painting exterior and interior walls — Enhances curb appeal and interior aesthetics ↑
- Both Re-carpeting or re-laying flooring — Improves comfort and appearance ↑
- Both Upgrading kitchen appliances — Modernizes the space and attracts tenants ↑
ⓘ Cost ranges are severity-bucket heuristics (US national rule-of-thumb). Get contractor quotes + a written scope before underwriting a rehab budget.
Schools (NCES district)
- District
- Rochester Community School Corporation
- NCES district ID
- 1809630
- Math proficiency
- 31% ▼ -4.00%
- Reading proficiency
- 41% ▲ 2.00%
- Median HH income
- $42,645
- Composite
- 30.44/100
- National rank
- #6231
- State rank
- #188 of 301 in IN
Livability — Rochester
- Score
- 69/100
- State rank
- #206
- US rank
- #9060
Category grades
Schools grade is shown separately in the Schools card above.
Census & demographics
- Census place
- Rochester, IN
- County
- Fulton County · 13,824 people
- City population
- 13,824
- Metro
- nan
- Population (ZIP)
- 13,824
- Household income
- $61,185
- Rent vs Own
- Severe rent burden
- 238.0
Population outlook (Fulton County) Hauer SSP2
- Today (2025)
- 19,537 people
- By 2030
- 19,013 · -2.7%
- By 2040
- 17,959 · -8.1%
- By 2050
- 17,038 · -12.8%
- By 2075
- 15,117 · -22.6%
- By 2100
- 13,179 · -32.5%
Race, ethnicity, and origin ACS 2023
- Neighborhood character
- Predominantly White (91%)
- Race & ethnicity
- White 91% Hispanic / Latino 4% Two or more races 3%
- Common ancestry
- Iranian 2% Scottish 2% Lithuanian 2%
- Foreign-born
- 1% · Canada
- Languages at home
- 97% English-only · German/W. Germanic 2% Spanish 1%
Political lean MEDSL · Fulton
- 2024 margin
- Solid R (+51.2) · D 23.7% · R 74.9% · Other 1.4%
- 2008→2024 swing
- -35.2pp toward R · 2008: -16.0pp · 2024: -51.2pp
- All cycles
- 2024: R+51.2 2020: R+48.2 2016: R+48.4 2012: R+33.2 2008: R+16.0
Not yet ingested
- Civics
- —
Market trends
- HPI YoY
- ▼ -85.72%
- Current HPI
- 212.9033
- Rent YoY
- —
- Metro
- nan
- State GDP YoY
- ▲ 2.90%
- F500 in state
- 18
Industry mix (Fortune 500 HQ in IN)
| Industry | F500 HQs | Revenue |
|---|---|---|
| Industrial Machinery | 2 | $37B |
|
||
| Healthcare | 1 | $177B |
|
||
| Pharmaceuticals | 1 | $45B |
|
||
| Metals / Steel | 1 | $18B |
|
||
| Agriculture | 1 | $17B |
|
||
| Packaging | 1 | $12B |
|
||
Price history
1 event — show timeline
- 2026-04-16 Listed $5,395,000 IRMLS
Cash-flow waterfall
monthlySold comps — $/sqft
last 12 mo · ≤1 miLoading sold comps…