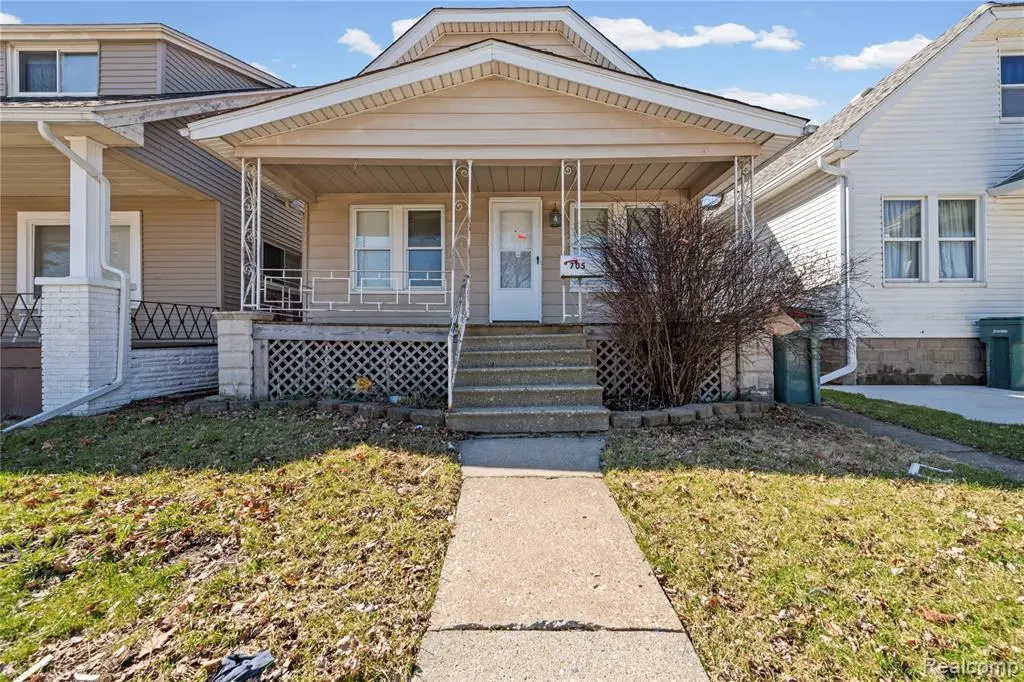
705 Cleophus Pkwy · Lincoln Park, MI
Flood risk 1/10 · Minimal
- FEMA flood zone
- X (unshaded)
- Chance of flooding over 30 yrs
- 0.0%
- Est. flood insurance / yr
- $507 – $1,088
Fire risk 1/10 · Minimal
- Est. fire insurance / yr
- $784 – $1,456
Heat risk 3/10 · Minor
- Hot days now (above 97°F)
- 7 days/yr
- Hot days in 30 yrs
- 15 days/yr
Wind risk 2/10 · Minimal
- Chance of severe wind over 30 yrs
- —
Air-quality risk 3/10 · Minor
- Unhealthy air days now
- 3 days/yr
- Unhealthy air days in 30 yrs
- 5 days/yr
Risk factors via First Street. Map © Google.
Why this score? — see what drove the D grade
The composite is a weighted blend of 9 inputs, each scored 0–100. Each bar is that input's sub-score; the figure is the points it added to the 100-point composite (weight × sub-score).
- Cash flow +20.1/30.0
- DSCR +6.4/10.0
- 1% rule +5.0/10.0
- Livability +4.0/5.0
- Rent growth +3.7/5.0
- Condition / age +2.5/5.0
- Schools +2.0/10.0
- ARV discount +0.0/15.0
- Appreciation +0.0/10.0
$155,000
🖨 Deal sheet 📄 Offer letter ✓ Due diligence
Listing remarks MLS
Welcome Home! This charming 4-bedroom, 2-bath Colonial offers a perfect blend of classic character and functional living space. Step inside to find a warm and inviting layout featuring spacious bedrooms and a versatile bonus room - ideal for a home office, playroom, or additional living area. The home also includes a full basement, providing ample storage or potential for finishing to suit your needs. Whether you're relaxing indoors or entertaining guests, this property offers comfort and flexibility throughout. Conveniently located near local amenities, schools, and parks, this home is a fantastic opportunity for buyers seeking both space and value. Schedule your showing today and see all that this property has to offer!
Key facts
- Full basement
- Local amenities
- Versatile bonus room
Tags
Property features AI
Finance
- Other: Lot approximately 30 x 108 (0.07 acres)
Exterior
- Parking: No garage
- Security: Smoke detector(s)
- Utilities: Public water; Sewer available
- Home design: Single family residence; Two levels; Ground-level entry with steps
- Construction: Vinyl siding; Block foundation; Built as residential single-family
- Exterior features: Deck; Porch; Shed(s); Paved road access
Interior
- Kitchen: Free-standing gas range; Range hood; Free-standing refrigerator; Stainless steel appliances
- Bathrooms: 2 full bathrooms
- Heating & cooling: Forced air heating (natural gas); No central cooling
- Interior features: Free-standing gas range; Free-standing refrigerator; Range hood; Stainless steel appliances; Unfinished basement; Smoke detector(s)
Neighborhood map
What this means for you Summary
Snapshot
- This is a 4-bed/2.0-bath single-family listed at $155k.
Deal economics
- At list price, monthly cash flow is $192 ($2k/yr) — positive.
- The deal already cash-flows at list — no discount required.
- To meet the 1% rule (rent ≥ 1% of price), the offer needs to be $155k (0.2% below list).
- Recommended offer: $150k (3.0% below list) — sets the bar for market timing.
- Cap rate 7.8% vs local median 6.4% in Lincoln Park — meaningfully above typical; check what's discounted (condition, days-on-market, listing class) to confirm the premium yield is real.
Location & tenants
- Location reads 80/100 on livability (#82 in MI, #1,720 nationally) — a professional / high-income tenant draw. Strengths: amenities A+, commute A+, cost of living A+; Watch: schools D-, crime F, employment D-.
- Lincoln Park School District (suburban): math 15% / reading 32% proficiency, ranked #440 of 540 in MI (top 82%) — low school quality limits family demand, transient renter base, plan for 1-2y turnover; 72% free/reduced lunch — lower-income household profile, screen leases tightly.
- Market conditions: Rents rising fast (+4.7%/yr); 151 active listings in the ZIP; 4 comparable units currently listed for rent nearby; rentals leasing fast (median 5d on market — plan ~1-2 weeks tenant-placement turnaround); 2,639 units permitted in Wayne County in 2024 (1,216 in 5+ unit buildings).
- This rent runs 32% of the median local income ($59k/yr) — at the standard rent-burdened threshold; future hikes will face affordability resistance.
Forward outlook
- Local home prices are declining (-3.0%/yr); year-one equity from $1k of loan paydown is wiped out by about $5k of value loss. Plan a longer hold.
- Wayne County population projected at -17% by 2050 — secular population decline; favor cash flow + early exit over multi-decade hold.
Negotiation context
- It's been on market 35 days — a 3% lower offer ($150k) is reasonable based on typical stale-listing flexibility.
- 9 sale attempts since 24y ago with the ask held roughly flat each time — persistent listings suggest the price (not the market) is what's stuck; bring a comps-based counter.
- Current owner paid $65k; list at $155k implies a 138% gain — meaningful room to come down on a strong offer.
Risks & watch-outs
- Watch-outs: built in 1927 — expect roof / HVAC / electrical / plumbing capex.
Questions for the listing agent
- It's been on market 35 days. Have you received any prior offers? Is the seller open to a 3% concession, seller financing, or rate buy-down credit?
- Built in 1927 — when were the roof, HVAC, electrical panel, plumbing, and water heater last replaced?
- Is there a deadline driving the sale (1031 exchange, divorce, estate, relocation)? That informs how much negotiation room exists.
- Schools are D-rated, which usually means shorter tenancies and higher turnover. Who's the typical renter profile here, and what's been the actual vacancy rate?
- Crime grade is F in this area — have there been break-ins, vandalism, or insurance claims at this property in the last 3 years? What carrier currently insures it and at what premium?
- The area grade is low — what's the realistic commute time and amenity access for the typical tenant pool here? Any planned neighborhood developments (good or bad) we should know about?
- What's the average days-on-market for RENTAL listings here right now (not sales)? A rising rental-DOM trend means longer vacancies and softer asking-rent achievability than the comps imply.
- What's the recent tenant-quality profile in this submarket — average credit score on applications, eviction rate, late-payment / NSF rate, and stable-employment percentage? A property-management company in the area should have these aggregated.
- How much new for-sale + rental construction is in the pipeline within 1–3 miles? Heavy new supply typically softens prices + rents 12–24 months out; constrained supply supports both.
Investment metrics
- 1% rule
- 1.00% ✗
- Cap rate
- 7.78%
- Cash-on-cash
- 5.31%
- DSCR
- 1.24
- GRM
- 8.3
CMA / ARV
- ARV (on-the-fly)
- $132,000
- Comps found
- 12
Show comp detail 12 sales within ~0.75 mi
| Address | Dist | Beds/Ba | Sqft | Sold | Price | $/sf | Match |
|---|---|---|---|---|---|---|---|
| 714 Park Ave | 0.03mi | 3/1.0 (-1) | 964 (+10%) | 8mo | $167,000 | $173 | 67 |
| 408 Garfield Ave | 0.39mi | 3/1.0 (-1) | 888 (+1%) | 6mo | $64,000 | $72 | 66 |
| 1260 Marion Ave | 0.60mi | 3/1.0 (-1) | 874 (-1%) | 1mo | $155,000 | $177 | 61 |
| 1473 Austin Ave | 0.50mi | 3/1.0 (-1) | 864 (-2%) | 6mo | $126,150 | $146 | 60 |
| 483 Park Ave | 0.26mi | 3/2.0 (-1) | 988 (+12%) | 3mo | $206,000 | $209 | 60 |
| 1368 Wilson Ave | 0.46mi | 3/1.0 (-1) | 912 (+4%) | 5mo | $165,000 | $181 | 59 |
| 1312 Ferris Ave | 0.59mi | 3/1.5 (-1) | 930 (+6%) | 4mo | $117,000 | $126 | 53 |
| 1120 Mayflower Ave | 0.75mi | 3/1.0 (-1) | 864 (-2%) | 2mo | $100,000 | $116 | 51 |
| 350 Labadie St | 0.48mi | 3/1.0 (-1) | 960 (+9%) | 3mo | $99,000 | $103 | 51 |
| 816 London Ave | 0.64mi | 3/1.0 (-1) | 944 (+7%) | 2mo | $187,000 | $198 | 47 |
| 4635 5th St | 0.71mi | 3/1.0 (-1) | 965 (+10%) | 1mo | $99,900 | $104 | 41 |
| 277 White St | 0.53mi | 3/1.0 (-1) | 1,007 (+14%) | 5mo | $151,000 | $150 | 38 |
Match score weights: distance 35% · size 25% · config 20% · recency 20%. Top-matched comps best support the ARV.
Projected returns pro-forma
-3.0% appreciation · 4.65% rent growth · sell at horizon
- IRR
- -6.3%
- Equity multiple
- 0.76×
- Total profit
- $-10,281
- Equity at exit
- $23,111
- IRR
- 5.2%
- Equity multiple
- 1.41×
- Total profit
- $17,863
- Equity at exit
- $13,402
Cash invested: $43,400 (down + closing). Projections, not guarantees.
Landlord ↔ Tenant lean methodology
- Overall (STATE)
- 62 Landlord-Friendly
- State Michigan
- 62 Landlord-Friendly · EVEN
- County
- — inherits STATE
- City
- — inherits STATE
ZIP-level market 48146
- Home prices YoY
- -32.7%
- Rents YoY
- 4.7%
- Active inventory
- 151
- Price-to-rent
- 8.3×
Monthly cashflow live
- Estimated rent
- $1,547 medium interval (Pro) →
- Mortgage (P&I)
- −$813
- Tax from tax record
- −$153 /mo · $1,834/yr
- Insurance
- −$65
- HOA
- −$0
- Vacancy / Maint / Mgmt
- −$325
- Net cashflow
- $192
Break-even live
UW: 25.0% down · 7.5% · 30yr · 1.5% tax · 5.0% vac · 8.0% maint · 8.0% mgmt
Financing live
Cash to close
- Down payment
- $38,750
- Closing costs
- $4,650
- Reserves months
- —
- Total cash needed
- —
Loan-product check · same deal, 3 products live
Conventional
25% down · 7.5% · 30yr
- Down + closing
- —
- Monthly P&I
- —
- Monthly cashflow
- —
- DSCR
- —
- Eligible?
- —
Personal DTI + credit; lowest rate.
DSCR
20% down · 8.5% · 30yr
- Down + closing
- —
- Monthly P&I
- —
- Monthly cashflow
- —
- DSCR
- —
- Eligible?
- —
No personal income docs; deal must DSCR.
Hard money
10% down · 12.0% · 12mo
- Down + closing
- —
- Monthly P&I
- —
- Monthly cashflow
- —
- DSCR
- —
- Eligible?
- —
Short-term bridge; refi at stabilization.
Rent comps 4 comps
| Address | Beds | Baths | Sqft | Rent | $/sqft | DOM | Units | Dist |
|---|---|---|---|---|---|---|---|---|
| 3575 S Ethel St Detroit, MI | 3.0 | 1.0 | 894 | $1,350 | $1.51 | 17d | 1 | 0.94mi |
| 168 Bondie St Wyandotte, MI | 3.0 | 1.0 | 1080 | $1,295 | $1.20 | 5d | 1 | 1.42mi |
| 170 Bondie St Wyandotte, MI | 3.0 | 1.0 | 1080 | $1,399 | $1.30 | 2d | 1 | 1.42mi |
| 1774 College Ave Lincoln Park, MI | 3.0 | 1.0 | 944 | $1,525 | $1.62 | 1d | 1 | 1.43mi |
Listing history 32 events
-
2026-06-18days on market $155,000 Active 35 DOM
-
2026-06-17days on market $155,000 Active 34 DOM
-
2026-06-16days on market $155,000 Active 33 DOM
-
2026-06-15days on market $155,000 Active 32 DOM
-
2026-06-13days on market $155,000 Active 30 DOM
-
2026-06-13days on market $155,000 Active 29 DOM
-
2026-06-09days on market $155,000 Active 26 DOM
-
2026-06-08days on market $155,000 Active 25 DOM
-
2026-06-07days on market $155,000 Active 24 DOM
-
2026-06-04days on market $155,000 Active 21 DOM
-
2026-06-03days on market $155,000 Active 20 DOM
-
2026-06-02days on market $155,000 Active 19 DOM
-
2026-06-01days on market $155,000 Active 18 DOM
-
2026-05-31days on market $155,000 Active 17 DOM
-
2026-05-14$155,000 Active 731-char remark
Show marketing remark (731 chars)
Welcome Home! This charming 4-bedroom, 2-bath Colonial offers a perfect blend of classic character and functional living space. Step inside to find a warm and inviting layout featuring spacious bedrooms and a versatile bonus room - ideal for a home office, playroom, or additional living area. The home also includes a full basement, providing ample storage or potential for finishing to suit your needs. Whether you're relaxing indoors or entertaining guests, this property offers comfort and flexibility throughout. Conveniently located near local amenities, schools, and parks, this home is a fantastic opportunity for buyers seeking both space and value. Schedule your showing today and see all that this property has to offer!
-
2026-05-14$155,000 Active
Show marketing remark (731 chars)
Welcome Home! This charming 4-bedroom, 2-bath Colonial offers a perfect blend of classic character and functional living space. Step inside to find a warm and inviting layout featuring spacious bedrooms and a versatile bonus room - ideal for a home office, playroom, or additional living area. The home also includes a full basement, providing ample storage or potential for finishing to suit your needs. Whether you're relaxing indoors or entertaining guests, this property offers comfort and flexibility throughout. Conveniently located near local amenities, schools, and parks, this home is a fantastic opportunity for buyers seeking both space and value. Schedule your showing today and see all that this property has to offer!
-
2026-04-29historical
-
2026-04-29historical
-
2026-04-16status Active
-
2026-04-16status Active
-
2026-04-09historical Accepting Backup Offers
-
2026-04-09historical Active Under Contract
-
2026-03-31$155,000 Active
-
2026-03-31$155,000 Active
-
2025-12-01soldstatus $65,000
-
2010-09-30soldstatus $49,000
-
2009-10-27historical
-
2009-05-27$78,999
-
2004-06-22soldstatus $65,900
-
2003-12-26$64,800
-
2003-02-15historical
-
2002-12-16$78,900
ⓘ Source: listings_history table (triggers on properties + properties_extension) + one-shot
backfill from property_details.listing_events for pre-trigger history.
Tax reassessment forecast MI · Partial reset (capped growth)
- Current annual tax
- $1,834 · $153/mo
- Projected year-2 tax
- $2,111 · $176/mo
- Expected delta
- +$276/yr (+$23/mo · 15.1%)
ⓘ Screening estimate from a state-policy table — verify with the county assessor before closing.
Climate risk First Street
- Flood 1/10 Low FEMA zone X (unshaded) · 0% chance over 30 yrs
- Wildfire 1/10 Low
- Heat 3/10 Moderate 7 d/yr ≥97°F today · 15 d/yr by 30 yrs out
- Wind 2/10 Low
- Air quality 3/10 Moderate 3 unhealthy d/yr today · 5 by 30 yrs out
Nearby sold comps map
Loading sold comps map…
Walkable amenities ~0.75 mi
Loading nearby amenities…
Taxation est. · year 1
- Rental income
- $18,566
- − Mortgage interest
- −$8,682
- − Property taxes
- −$1,834
- − Insurance
- −$775
- − Repairs & maintenance
- −$1,485
- − Management
- −$1,485
- − Depreciation
- −$4,509
- Taxable loss
- −$206
- Est. tax savings @ 24.0%
- +$49
- After-tax cash flow
- $2,353/yr
For passive investors: Depreciation is non-cash, so a rental often shows a tax loss while cash-flowing — sheltering income. Rental losses are passive: they offset passive income freely, and up to $25,000/yr can offset ordinary (W-2) income if you actively participate and your MAGI is under $100k (phasing out to $0 by $150k); unused losses carry forward. On sale, claimed depreciation is recaptured at up to 25%, and gains may owe capital-gains tax (a 1031 exchange can defer both). Figures are a year-1 estimate at your 24.0% rate — not tax advice; consult a CPA.
Schools (NCES district)
- District
- Lincoln Park School District
- NCES district ID
- 2621600
- Math proficiency
- 15% ▼ -5.00%
- Reading proficiency
- 32% ▬ 0.00%
- Median HH income
- $41,486
- Composite
- 19.93/100
- National rank
- #8678
- State rank
- #440 of 540 in MI
Livability — Lincoln Park
- Score
- 80/100
- State rank
- #82
- US rank
- #1720
Category grades
Schools grade is shown separately in the Schools card above.
Census & demographics
- Census place
- Lincoln Park, MI
- County
- Wayne County · 1,562,939 people
- City population
- 39,257
- Metro
- Detroit-Warren-Dearborn, MI
- Population (ZIP)
- 39,257
- Household income
- $58,616
- Rent vs Own
- Severe rent burden
- 1142.0
Population outlook (Wayne County) Hauer SSP2
- Today (2025)
- 1,675,273 people
- By 2030
- 1,620,300 · -3.3%
- By 2040
- 1,502,341 · -10.3%
- By 2050
- 1,384,039 · -17.4%
- By 2075
- 1,124,592 · -32.9%
- By 2100
- 881,193 · -47.4%
Race, ethnicity, and origin ACS 2023
- Neighborhood character
- Diverse neighborhood (Simpson 0.57)
- Race & ethnicity
- White 60% Hispanic / Latino 25% Two or more races 12% Black 9% Native American 1%
- Hispanic origin (detail)
- Mexican 19% Puerto Rican 3%
- Common ancestry
- Romanian 6% Lithuanian 4% Slovak 1%
- Foreign-born
- 9% · Canada
- Languages at home
- 80% English-only · Spanish 17% Arabic 2%
Political lean MEDSL · Wayne
- 2024 margin
- Strong D (+29.0) · D 62.7% · R 33.7% · Other 3.6%
- 2008→2024 swing
- -20.5pp toward R · 2008: 49.5pp · 2024: 29.0pp
- All cycles
- 2024: D+29.0 2020: D+38.1 2016: D+37.3 2012: D+46.9 2008: D+49.5
Not yet ingested
- Civics
- —
Market trends
- HPI YoY
- ▼ -108.25%
- Current HPI
- 222.8545
- Rent YoY
- ▲ 4.65%
- Metro
- Detroit-Warren-Dearborn, MI
- State GDP YoY
- ▲ 1.37%
- F500 in state
- 28
Industry mix (Fortune 500 HQ in MI)
| Industry | F500 HQs | Revenue |
|---|---|---|
| Automotive Parts | 3 | $48B |
|
||
| Automotive | 2 | $372B |
|
||
| Chemicals | 1 | $45B |
|
||
| Automotive Retail | 1 | $29B |
|
||
| Healthcare / Medical Devices | 1 | $23B |
|
||
| Automotive Technology | 1 | $20B |
|
||
Price history
+96.5% since first listed18 events — show timeline
- 2026-05-14 Listed $155,000 REALCOMP
- 2026-05-14 Listed $155,000 MiRealSource-MiMLS
- 2026-04-29 Listing Removed — MiRealSource-MiMLS
- 2026-04-29 Listing Removed — REALCOMP
- 2026-04-16 Relisted — MiRealSource-MiMLS
- 2026-04-16 Relisted — REALCOMP
- 2026-04-09 Contingent — MiRealSource-MiMLS
- 2026-04-09 Contingent — REALCOMP
- 2026-03-31 Listed $155,000 MiRealSource-MiMLS
- 2026-03-31 Listed $155,000 REALCOMP
- 2025-12-01 Sold (Public Records) $65,000 Public Records
- 2010-09-30 Sold (Public Records) $49,000 Public Records
- 2009-10-27 Listing Removed — REALCOMP
- 2009-05-27 Listed $78,999 REALCOMP
- 2004-06-22 Sold (MLS) $65,900 REALCOMP
- 2003-12-26 Listed $64,800 REALCOMP
- 2003-02-15 Listing Removed — MiRealSource-MiMLS
- 2002-12-16 Listed $78,900 MiRealSource-MiMLS
Property tax history
+5.0%/yrLatest (2025): $1,834 · -6.6% YoY. Source: county tax records.
Cash-flow waterfall
monthlySold comps — $/sqft
last 12 mo · ≤1 miLoading sold comps…