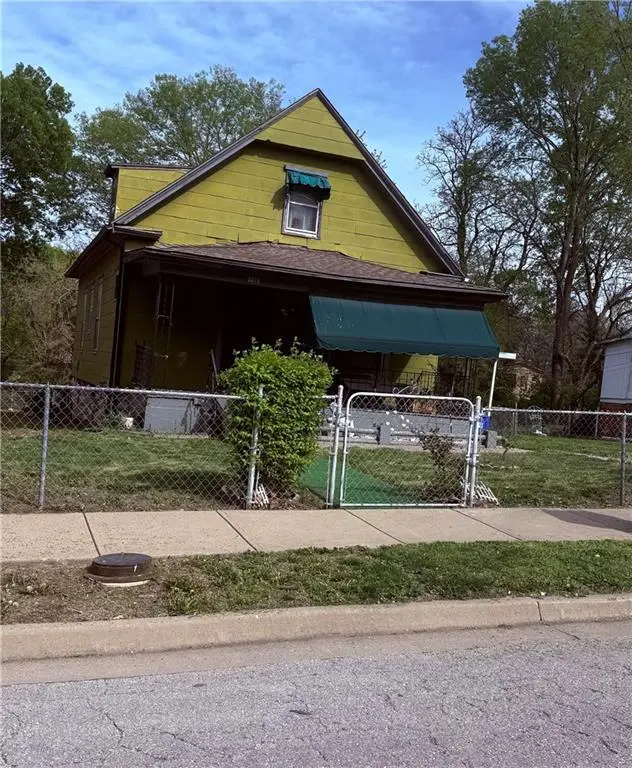
2013 Kansas Ave · Kansas City, MO
Flood risk 1/10 · Minimal
- FEMA flood zone
- X (unshaded)
- Chance of flooding over 30 yrs
- 0.0%
- Est. flood insurance / yr
- $473 – $860
Fire risk 1/10 · Minimal
- Est. fire insurance / yr
- $1,054 – $1,958
Heat risk 4/10 · Minor
- Hot days now (above 106°F)
- 7 days/yr
- Hot days in 30 yrs
- 17 days/yr
Wind risk 2/10 · Minimal
- Chance of severe wind over 30 yrs
- —
Air-quality risk 3/10 · Minor
- Unhealthy air days now
- 2 days/yr
- Unhealthy air days in 30 yrs
- 3 days/yr
Risk factors via First Street. Map © Google.
Why this score? — see what drove the B- grade
The composite is a weighted blend of 9 inputs, each scored 0–100. Each bar is that input's sub-score; the figure is the points it added to the 100-point composite (weight × sub-score).
- Cash flow +30.0/30.0
- DSCR +10.0/10.0
- 1% rule +8.6/10.0
- ARV discount +7.5/15.0
- Livability +3.9/5.0
- Rent growth +2.7/5.0
- Condition / age +2.5/5.0
- Schools +1.5/10.0
- Appreciation +1.1/10.0
$90,000
🖨 Deal sheet 📄 Offer letter ✓ Due diligence
Listing remarks MLS
Welcome to this classic 1920s 3-bedroom, 1-bath home nestled in the historic Washington Wheatley neighborhood of Kansas City. Owned by the same family for nearly 70 years, this property offers a unique opportunity to restore and personalize a home full of character—plus an additional adjacent lot (0.09 acres) included for added potential. Inside, you’ll find a functional layout with space to reimagine, including a private third bedroom upstairs—ideal for a home office, guest room, or flex space. While the home reflects its age, it offers solid bones and timeless charm ready for renovation. The additional lot provides flexibility for expansion, gardening, a garage, or future development. Conveniently located near Seton Center, Montgall Park, Phyllis Wheatley Elementary, and just minutes from the 18th & Vine District and Downtown Kansas City, this area continues to see growth and revitalization. Whether you're an investor or a buyer looking to create something special, this property offers value and opportunity. Property is being sold as-is. Seller has never occupied the property and makes no representations regarding its condition.
Key facts
- Near montgall park
- 4,269 sq ft lot
- Built 1920
Tags
Neighborhood map
What this means for you Summary
Snapshot
- This is a 2-bed/1.0-bath single-family listed at $90k.
Deal economics
- At list price, monthly cash flow is $438 ($5k/yr) — positive.
- The deal already cash-flows at list — no discount required.
- Meets the 1% rule at list price ($1k rent vs $90k).
- Recommended offer: $87k (3.0% below list) — sets the bar for market timing.
- Cap rate 12.1% vs local median 3.9% in Kansas City — top-decile yield for the area; either an underpriced asset or a hidden risk that comps aren't pricing in. Stress-test before assuming the spread holds.
Location & tenants
- Location reads 78/100 on livability (#28 in MO, #2,671 nationally) — a middle-class / working-renter tenant base. Strengths: amenities A+, commute A+, cost of living A+; Watch: schools C-, crime F.
- Kansas City 33 (urban): math 12% / reading 24% proficiency, ranked #308 of 324 in MO (top 95%) — low school quality limits family demand, transient renter base, plan for 1-2y turnover; 75% free/reduced lunch — lower-income household profile, screen leases tightly.
- Market conditions: Rents flat; 108 active listings in the ZIP; 38 comparable units currently listed for rent nearby; rentals at typical pace (median 24d on market — plan ~3-4 weeks tenant-placement turnaround); lower-income renter base — watch delinquency; 4,002 units permitted in Jackson County in 2024 (2,271 in 5+ unit buildings).
- This rent runs 44% of the median local income ($33k/yr) — at the standard rent-burdened threshold; future hikes will face affordability resistance.
Forward outlook
- Local home prices are declining (-3.0%/yr); year-one equity from $622 of loan paydown is wiped out by about $3k of value loss. Plan a longer hold.
- Jackson County population projected at +4% by 2050 — modest demand growth; plan on rents tracking national, not racing it.
- At projected returns (-3.0% appreciation + 0.9% rent growth), your $25k cash investment doubles in ~7 years — after that, you're playing with house money.
Negotiation context
- It's been on market 60 days — a 3% lower offer ($87k) is reasonable based on typical stale-listing flexibility.
- 2 sale attempts with the ask held roughly flat each time — persistent listings suggest the price (not the market) is what's stuck; bring a comps-based counter.
Risks & watch-outs
- Watch-outs: built in 1920 — expect roof / HVAC / electrical / plumbing capex.
Questions for the listing agent
- It's been on market 60 days. Have you received any prior offers? Is the seller open to a 3% concession, seller financing, or rate buy-down credit?
- Built in 1920 — when were the roof, HVAC, electrical panel, plumbing, and water heater last replaced?
- Is there a deadline driving the sale (1031 exchange, divorce, estate, relocation)? That informs how much negotiation room exists.
- Crime grade is F in this area — have there been break-ins, vandalism, or insurance claims at this property in the last 3 years? What carrier currently insures it and at what premium?
- What's the average days-on-market for RENTAL listings here right now (not sales)? A rising rental-DOM trend means longer vacancies and softer asking-rent achievability than the comps imply.
- What's the recent tenant-quality profile in this submarket — average credit score on applications, eviction rate, late-payment / NSF rate, and stable-employment percentage? A property-management company in the area should have these aggregated.
- How much new for-sale + rental construction is in the pipeline within 1–3 miles? Heavy new supply typically softens prices + rents 12–24 months out; constrained supply supports both.
Investment metrics
- 1% rule
- 1.36% ✓
- Cap rate
- 12.14%
- Cash-on-cash
- 20.87%
- DSCR
- 1.93
- GRM
- 6.1
CMA / ARV
- ARV (median comp)
- $187,737
- List price
- $90,000
- Delta
- -52.06%
- Verdict
- UNDERPRICED
- Comps
- 20 within 1.0 mi
Show comp detail 12 sales within ~0.75 mi
| Address | Dist | Beds/Ba | Sqft | Sold | Price | $/sf | Match |
|---|---|---|---|---|---|---|---|
| 2202 Agnes Ave | 0.17mi | 3/2.0 (+1) | 1,120 (-7%) | 0mo | $100,000 | $89 | 71 |
| 1834 Kansas Ave | 0.09mi | 3/2.5 (+1) | 1,302 (+8%) | 4mo | $299,500 | $230 | 68 |
| 2510 Bellefontaine Ave | 0.53mi | 2/1.0 | 1,094 (-9%) | 3mo | $54,500 | $50 | 57 |
| 2455 Montgall Ave | 0.49mi | 3/2.0 (+1) | 1,256 (+4%) | 13mo | $170,000 | $135 | 51 |
| 2334 Walrond Ave | 0.35mi | 3/1.5 (+1) | 1,370 (+14%) | 8mo | $59,000 | $43 | 48 |
| 2418 Benton Blvd | 0.38mi | 3/2.0 (+1) | 1,280 (+6%) | 19mo | $185,000 | $145 | 47 |
| 3016 E 26th St | 0.61mi | 3/1.0 (+1) | 1,285 (+7%) | 14mo | $74,900 | $58 | 44 |
| 2315 Olive St | 0.42mi | 3/2.0 (+1) | 1,350 (+12%) | 13mo | $149,900 | $111 | 40 |
| 3505 E 25th St | 0.63mi | 3/2.0 (+1) | 1,085 (-10%) | 11mo | $190,000 | $175 | 36 |
| 3809 Bernard Powell Dr | 0.61mi | 3/4.0 (+1) | 1,318 (+9%) | 5mo | $215,000 | $163 | 35 |
| 3012 E 27th St | 0.73mi | 2/1.5 | 1,050 (-13%) | 12mo | $79,999 | $76 | 32 |
| 2620 Montgall Ave | 0.69mi | 3/2.0 (+1) | 1,320 (+10%) | 15mo | $90,000 | $68 | 31 |
Match score weights: distance 35% · size 25% · config 20% · recency 20%. Top-matched comps best support the ARV.
Projected returns pro-forma
-3.0% appreciation · 0.94% rent growth · sell at horizon
- IRR
- 11.1%
- Equity multiple
- 1.43×
- Total profit
- $10,807
- Equity at exit
- $13,419
- IRR
- 18.5%
- Equity multiple
- 2.40×
- Total profit
- $35,400
- Equity at exit
- $7,782
Cash invested: $25,200 (down + closing). Projections, not guarantees.
Landlord ↔ Tenant lean methodology
- Overall (STATE)
- 81 Strongly Landlord-Friendly
- State Missouri
- 81 Strongly Landlord-Friendly · R+10
- County
- — inherits STATE
- City
- — inherits STATE
ZIP-level market 64127
- Home prices YoY
- -2.6%
- Rents YoY
- 0.9%
- Active inventory
- 108
- Price-to-rent
- 6.1×
Monthly cashflow live
- Estimated rent
- $1,226 high interval (Pro) →
- Mortgage (P&I)
- −$472
- Tax from tax record
- −$21 /mo · $253/yr
- Insurance
- −$38
- HOA
- −$0
- Vacancy / Maint / Mgmt
- −$258
- Net cashflow
- $438
Break-even live
UW: 25.0% down · 7.5% · 30yr · 1.5% tax · 5.0% vac · 8.0% maint · 8.0% mgmt
Financing live
Cash to close
- Down payment
- $22,500
- Closing costs
- $2,700
- Reserves months
- —
- Total cash needed
- —
Loan-product check · same deal, 3 products live
Conventional
25% down · 7.5% · 30yr
- Down + closing
- —
- Monthly P&I
- —
- Monthly cashflow
- —
- DSCR
- —
- Eligible?
- —
Personal DTI + credit; lowest rate.
DSCR
20% down · 8.5% · 30yr
- Down + closing
- —
- Monthly P&I
- —
- Monthly cashflow
- —
- DSCR
- —
- Eligible?
- —
No personal income docs; deal must DSCR.
Hard money
10% down · 12.0% · 12mo
- Down + closing
- —
- Monthly P&I
- —
- Monthly cashflow
- —
- DSCR
- —
- Eligible?
- —
Short-term bridge; refi at stabilization.
Rent comps 38 comps
| Address | Beds | Baths | Sqft | Rent | $/sqft | DOM | Units | Dist |
|---|---|---|---|---|---|---|---|---|
| 2900 E 21st St Kansas City, MO | 3.0 | 1.5 | 897 | $1,650 | $1.84 | 16d | 1 | 0.09mi |
| 3201 E 20th St Kansas City, MO | 2.0 | 1.0 | 900 | $1,050 | $1.17 | 23d | 1 | 0.14mi |
| 3305 E 19th St Kansas City, MO | 2.0 | 1.0 | 1500 | $1,200 | $0.80 | 43d | 1 | 0.24mi |
| 2003 Wabash Ave Unit B Kansas City, MO | 3.0 | 2.0 | 1200 | $1,095 | $0.91 | 23d | 1 | 0.26mi |
| 2413 College Ave Kansas City, MO | 2.0 | 2.0 | 1022 | $1,225 | $1.20 | 23d | 1 | 0.44mi |
| 2213 Askew Ave Kansas City, MO | 2.0 | 1.0 | 865 | $1,002 | $1.16 | 19d | 1 | 0.47mi |
| 2225 Askew Ave Kansas City, MO | 2.0 | 1.0 | 864 | $1,050 | $1.22 | 43d | 1 | 0.48mi |
| 2454 Benton Blvd Unit 2456-1 Kansas City, MO | 1.0 | 1.0 | 750 | $1,000 | $1.33 | 16d | 1 | 0.50mi |
| 2454 Benton Blvd Unit 2460-3 Kansas City, MO | 1.0 | 1.0 | 750 | $1,100 | $1.47 | 16d | 1 | 0.50mi |
| 2454 Benton Blvd Unit 2458-2 Kansas City, MO | 1.0 | 1.0 | 750 | $1,000 | $1.33 | 7d | 1 | 0.50mi |
| 2419 Bales Ave Kansas City, MO | 3.0 | 1.5 | 1116 | $1,500 | $1.34 | 2d | 1 | 0.54mi |
| 2701 Benton Blvd Unit 2703-2 Kansas City, MO | 2.0 | 1.0 | 800 | $1,200 | $1.50 | 1d | 1 | 0.78mi |
| 2701 Benton Blvd Unit 2705-3 Kansas City, MO | 2.0 | 1.0 | 800 | $1,200 | $1.50 | 7d | 1 | 0.78mi |
| 2424 Norton Ave Unit B Kansas City, MO | 3.0 | 1.0 | 982 | $1,150 | $1.17 | 16d | 1 | 0.83mi |
| 2101 Vine St Kansas City, MO | 1.0–2.0 | 1.0 | 942 | $1,499 | $1.59 | 16d | 1 | 0.83mi |
| 2447 Norton Ave Kansas City, MO | 2.0 | 1.0 | 800 | $976 | $1.22 | 16d | 1 | 0.88mi |
| 1905 Kensington Ave Kansas City, MO | 3.0 | 2.0 | 1285 | $1,325 | $1.03 | 23d | 1 | 0.91mi |
| 1018 Prospect Ave Unit 1018-2N Kansas City, MO | 2.0 | 1.0 | 754 | $895 | $1.19 | 23d | 1 | 0.91mi |
| 2834 E 10th St Kansas City, MO | 2.0 | 1.5 | 1020 | $1,250 | $1.23 | 43d | 1 | 0.94mi |
| 2538 Woodland Ave Unit 2B Kansas City, MO | 2.0 | 1.0 | 850 | $950 | $1.12 | 21d | 1 | 0.94mi |
| 2826 E 10th St Kansas City, MO | 2.0 | 1.5 | 1020 | $1,250 | $1.23 | 43d | 1 | 0.94mi |
| 916 Bellefontaine Ave Kansas City, MO | 3.0 | 1.5 | 1399 | $1,650 | $1.18 | 16d | 1 | 0.95mi |
| 2724 Brooklyn Ave Kansas City, MO | 3.0 | 2.5 | 1398 | $1,440 | $1.03 | 23d | 1 | 0.95mi |
| 901 Benton Blvd Unit 7 Kansas City, MO | 2.0 | 1.0 | 1100 | $1,202 | $1.09 | 43d | 1 | 1.00mi |
| 2454 Cypress Ave Kansas City, MO | 3.0 | 1.0 | 800 | $1,300 | $1.62 | 3d | 1 | 1.06mi |
| 1603 Elmwood Ave Kansas City, MO | 2.0 | 1.0 | 1064 | $1,031 | $0.97 | 12d | 1 | 1.08mi |
| 2637 E 29th St Unit 3 Kansas City, MO | 2.0 | 1.0 | 954 | $1,050 | $1.10 | 43d | 1 | 1.08mi |
| 3220 E 30th St Unit 1A Kansas City, MO | 2.0 | 1.0 | 1214 | $950 | $0.78 | 43d | 1 | 1.14mi |
| 3435 E 7th St Kansas City, MO | 2.0 | 1.0 | 970 | $949 | $0.98 | 7d | 1 | 1.18mi |
| 3009 Garfield Ave Kansas City, MO | 3.0 | 1.5 | 1334 | $1,425 | $1.07 | 43d | 1 | 1.27mi |
| 2501 Troost Ave Kansas City, MO | 2.0 | 1.0–2.0 | 984 | $2,679 | $2.72 | 43d | 15 | 1.30mi |
| 612 Garfield Ave Kansas City, MO | 1.0–2.0 | 1.0–2.0 | 900 | $1,875 | $2.08 | 1d | 44 | 1.34mi |
| 504 Bellefontaine Ave Unit 2 Kansas City, MO | 2.0 | 2.0 | 1500 | $1,300 | $0.87 | 43d | 1 | 1.37mi |
| 513 Prospect Ave Unit 6 Kansas City, MO | 1.0 | 1.0 | 700 | $795 | $1.14 | 23d | 1 | 1.37mi |
| 2938 Flora Ave Unit 1s Kansas City, MO | 2.0 | 1.0 | 795 | $875 | $1.10 | 3d | 1 | 1.43mi |
| 2120 Linwood Blvd Kansas City, MO | 3.0 | 1.0 | 1326 | $1,400 | $1.06 | 43d | 1 | 1.45mi |
| 815 Elmwood Ave Kansas City, MO | 3.0 | 1.5 | 1302 | $1,600 | $1.23 | 14d | 1 | 1.45mi |
| 3423 Garner Ave Unit B Kansas City, MO | 2.0 | 1.0 | 800 | $900 | $1.12 | 43d | 1 | 1.46mi |
Listing history 17 events
-
2026-06-18days on market $90,000 Active 60 DOM
-
2026-06-17days on market $90,000 Active 59 DOM
-
2026-06-16days on market $90,000 Active 58 DOM
-
2026-06-15days on market $90,000 Active 57 DOM
-
2026-06-13days on market $90,000 Active 55 DOM
-
2026-06-09days on market $90,000 Active 51 DOM
-
2026-06-08days on market $90,000 Active 50 DOM
-
2026-06-07days on market $90,000 Active 49 DOM
-
2026-06-05days on market $90,000 Active 46 DOM
-
2026-06-03days on market $90,000 Active 45 DOM
-
2026-06-02days on market $90,000 Active 44 DOM
-
2026-06-01days on market $90,000 Active 43 DOM
-
2026-05-31days on market $90,000 Active 42 DOM
-
2026-04-19$90,000 Active 1172-char remark
Show marketing remark (1172 chars)
Welcome to this classic 1920s 3-bedroom, 1-bath home nestled in the historic Washington Wheatley neighborhood of Kansas City. Owned by the same family for nearly 70 years, this property offers a unique opportunity to restore and personalize a home full of character—plus an additional adjacent lot (0.09 acres) included for added potential. Inside, you’ll find a functional layout with space to reimagine, including a private third bedroom upstairs—ideal for a home office, guest room, or flex space. While the home reflects its age, it offers solid bones and timeless charm ready for renovation. The additional lot provides flexibility for expansion, gardening, a garage, or future development. Conveniently located near Seton Center, Montgall Park, Phyllis Wheatley Elementary, and just minutes from the 18th & Vine District and Downtown Kansas City, this area continues to see growth and revitalization. Whether you're an investor or a buyer looking to create something special, this property offers value and opportunity. Property is being sold as-is. Seller has never occupied the property and makes no representations regarding its condition.
-
2025-12-31historical
-
2025-05-14price $125,000
-
2025-04-26$140,000 Active
ⓘ Source: listings_history table (triggers on properties + properties_extension) + one-shot
backfill from property_details.listing_events for pre-trigger history.
Tax reassessment forecast MO · Resets to sale price
- Current annual tax
- $253 · $21/mo
- Projected year-2 tax
- $873 · $73/mo
- Expected delta
- +$620/yr (+$52/mo · 245.2%)
ⓘ Screening estimate from a state-policy table — verify with the county assessor before closing.
Climate risk First Street
- Flood 1/10 Low FEMA zone X (unshaded) · 0% chance over 30 yrs
- Wildfire 1/10 Low
- Heat 4/10 Moderate 7 d/yr ≥106°F today · 17 d/yr by 30 yrs out
- Wind 2/10 Low
- Air quality 3/10 Moderate 2 unhealthy d/yr today · 3 by 30 yrs out
Nearby sold comps map
Loading sold comps map…
Walkable amenities ~0.75 mi
Loading nearby amenities…
Taxation est. · year 1
- Rental income
- $14,718
- − Mortgage interest
- −$5,041
- − Property taxes
- −$253
- − Insurance
- −$450
- − Repairs & maintenance
- −$1,177
- − Management
- −$1,177
- − Depreciation
- −$2,618
- Taxable income
- $4,000
- Est. tax owed @ 24.0%
- −$960
- After-tax cash flow
- $4,300/yr
For passive investors: Depreciation is non-cash, so a rental often shows a tax loss while cash-flowing — sheltering income. Rental losses are passive: they offset passive income freely, and up to $25,000/yr can offset ordinary (W-2) income if you actively participate and your MAGI is under $100k (phasing out to $0 by $150k); unused losses carry forward. On sale, claimed depreciation is recaptured at up to 25%, and gains may owe capital-gains tax (a 1031 exchange can defer both). Figures are a year-1 estimate at your 24.0% rate — not tax advice; consult a CPA.
Schools (NCES district)
- District
- Kansas City 33
- NCES district ID
- 2916400
- Math proficiency
- 12% ▼ -8.00%
- Reading proficiency
- 24% ▬ 0.00%
- Median HH income
- $35,227
- Composite
- 14.8/100
- National rank
- #9387
- State rank
- #308 of 324 in MO
Livability — Kansas City
- Score
- 78/100
- State rank
- #28
- US rank
- #2671
Category grades
Schools grade is shown separately in the Schools card above.
Census & demographics
- Census place
- Kansas City, MO
- County
- Jackson County · 687,798 people
- City population
- 439,467
- Metro
- Kansas City, MO-KS
- Population (ZIP)
- 17,668
- Household income
- $33,111
- Rent vs Own
- Severe rent burden
- 1943.0
Population outlook (Jackson County) Hauer SSP2
- Today (2025)
- 719,589 people
- By 2030
- 731,456 · +1.6%
- By 2040
- 746,689 · +3.8%
- By 2050
- 749,289 · +4.1%
- By 2075
- 736,227 · +2.3%
- By 2100
- 668,210 · -7.1%
Race, ethnicity, and origin ACS 2023
- Neighborhood character
- Diverse neighborhood (Simpson 0.65)
- Race & ethnicity
- Black 42% Hispanic / Latino 40% Two or more races 13% White 12% Native American 1%
- Hispanic origin (detail)
- Mexican 28%
- Foreign-born
- 20% · Canada, Vietnam
- Languages at home
- 67% English-only · Spanish 29%
Political lean MEDSL · Jackson
- 2024 margin
- D (+19.3) · D 58.9% · R 39.5% · Other 1.6%
- 2008→2024 swing
- -6.1pp toward R · 2008: 25.4pp · 2024: 19.3pp
- All cycles
- 2024: D+19.3 2020: D+22.0 2016: D+16.6 2012: D+19.0 2008: D+25.4
Not yet ingested
- Civics
- —
Market trends
- HPI YoY
- ▼ -7.88%
- Current HPI
- 289.2468
- Rent YoY
- ▲ 0.94%
- Metro
- Kansas City, MO-KS
- State GDP YoY
- ▲ 1.84%
- F500 in state
- 20
Industry mix (Fortune 500 HQ in MO)
| Industry | F500 HQs | Revenue |
|---|---|---|
| Healthcare | 1 | $163B |
|
||
| Insurance | 1 | $21B |
|
||
| Industrial Technology | 1 | $17B |
|
||
| Retail | 1 | $16B |
|
||
| Industrial Distribution | 1 | $10B |
|
||
| Utilities | 1 | $9B |
|
||
Price history
-35.7% since first listed4 events — show timeline
- 2026-04-19 Listed $90,000 Heartland MLS as Distributed by MLS Grid
- 2025-12-31 Listing Removed — Heartland MLS as Distributed by MLS Grid
- 2025-05-14 Price Changed $125,000 Heartland MLS as Distributed by MLS Grid
- 2025-04-26 Listed $140,000 Heartland MLS as Distributed by MLS Grid
Property tax history
+4.2%/yrLatest (2025): $253 · -67.6% YoY. Source: county tax records.
Cash-flow waterfall
monthlySold comps — $/sqft
last 12 mo · ≤1 miLoading sold comps…