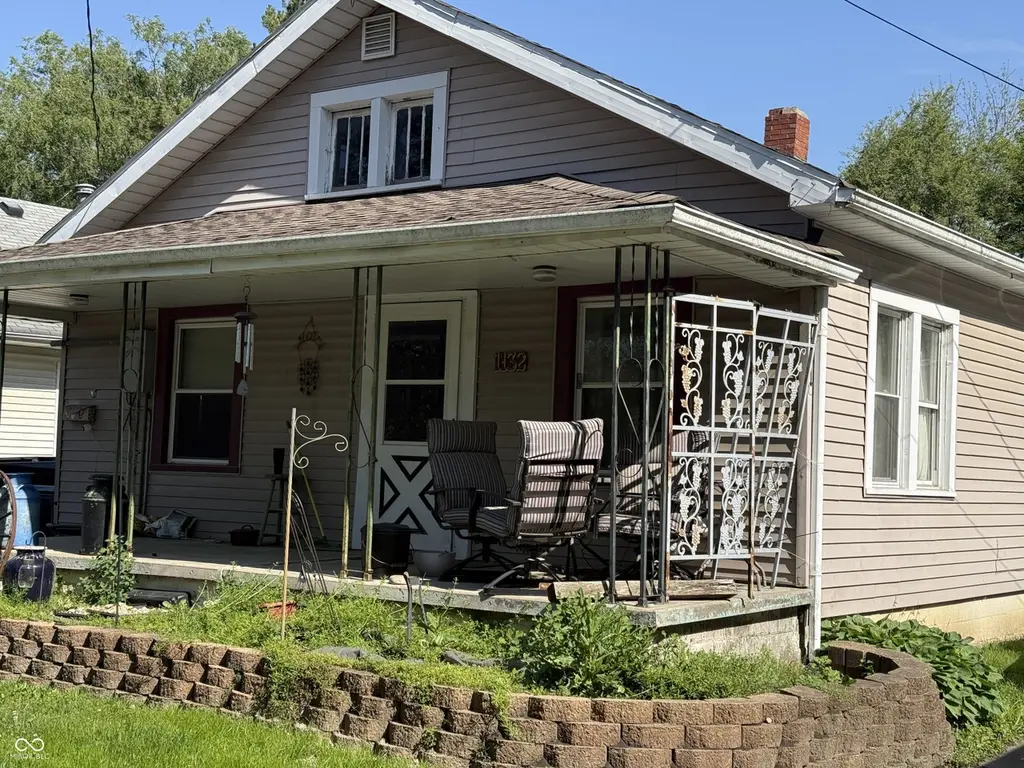
1132 Manor Ct · Anderson, IN
Flood risk 1/10 · Minimal
- FEMA flood zone
- X (unshaded)
- Chance of flooding over 30 yrs
- 0.0%
- Est. flood insurance / yr
- $473 – $860
Fire risk 1/10 · Minimal
- Est. fire insurance / yr
- $717 – $1,331
Heat risk 3/10 · Minor
- Hot days now (above 100°F)
- 7 days/yr
- Hot days in 30 yrs
- 18 days/yr
Wind risk 2/10 · Minimal
- Chance of severe wind over 30 yrs
- 0.0%
Air-quality risk 3/10 · Minor
- Unhealthy air days now
- 2 days/yr
- Unhealthy air days in 30 yrs
- 3 days/yr
Risk factors via First Street. Map © Google.
Why this score? — see what drove the B+ grade
The composite is a weighted blend of 9 inputs, each scored 0–100. Each bar is that input's sub-score; the figure is the points it added to the 100-point composite (weight × sub-score).
- Cash flow +30.0/30.0
- ARV discount +15.0/15.0
- 1% rule +10.0/10.0
- DSCR +10.0/10.0
- Rent growth +4.5/5.0
- Livability +3.0/5.0
- Condition / age +2.5/5.0
- Schools +1.6/10.0
- Appreciation +0.0/10.0
$65,000
🖨 Deal sheet (PDF) 📄 Offer letter ✓ Due diligence
Listing remarks MLS
NICE LITTLE HOME NEEDS A LITTLE TLC, NEWER ROOFING,NEWER SIDING, MOST WINDOWS AND DOORS ARE ARE REPLACEMENT. NICE DECK OFF THE REAR. HOME ALSO HAS A .63 ACRE OF AN LOT DIRECTLY BEHIND THE PROPERTY. THIS HOME WOULD MAKE A GREAT STARTER HOME OR RENTAL PROPERTY. THIS HOME IS SOLD BEING SOLD AS IS.
Key facts
- 3,825 sq ft lot
- Garage
- Built 1925
Property features AI
Exterior
- Parking: Detached 1-car garage
- Utilities: Public water; Municipal sewer connected
- Home design: Single-family residence; One level
- Construction: Vinyl siding; Block foundation
- Exterior features: Less than 1/4 acre lot
Interior
- Kitchen: Eat-in kitchen
- Bedrooms: 3 bedrooms (all on the main level)
- Bathrooms: 1 full bathroom (main level)
- Heating & cooling: Natural gas heating; Central air conditioning
- Interior features: Eat-in kitchen; Basement present
- Laundry & utility: Main-level laundry
Neighborhood map
What this means for you Summary
Snapshot
- This is a 3-bed/1.0-bath single-family listed at $65k.
Deal economics
- At list price, monthly cash flow is $455 ($5k/yr) — positive.
- The deal already cash-flows at list — no discount required.
- Meets the 1% rule at list price ($1k rent vs $65k).
- Recommended offer: $63k (3.0% below list) — sets the bar for market timing.
- Cap rate 14.7% vs local median 6.5% in Anderson — top-decile yield for the area; either an underpriced asset or a hidden risk that comps aren't pricing in. Stress-test before assuming the spread holds.
Location & tenants
- Location reads 60/100 on livability (#521 in IN) — a middle-class / working-renter tenant base. Strengths: cost of living A+, housing A+; Watch: schools F, crime D-, amenities F.
- Anderson Community School Corporation (urban): math 15% / reading 23% proficiency, ranked #280 of 301 in IN (top 93%) — low school quality limits family demand, transient renter base, plan for 1-2y turnover; 70% free/reduced lunch — lower-income household profile, screen leases tightly.
- Market conditions: Rents rising fast (+7.9%/yr); 188 active listings in the ZIP; 23 comparable units currently listed for rent nearby; rentals at typical pace (median 21d on market — plan ~3-4 weeks tenant-placement turnaround); lower-income renter base — watch delinquency; 184 units permitted in Madison County in 2024 (0 in 5+ unit buildings).
- This rent runs 36% of the median local income ($36k/yr) — at the standard rent-burdened threshold; future hikes will face affordability resistance.
Forward outlook
- Local home prices are declining (-3.0%/yr); year-one equity from $449 of loan paydown is wiped out by about $2k of value loss. Plan a longer hold.
- Madison County population projected at -14% by 2050 — secular population decline; favor cash flow + early exit over multi-decade hold.
- At projected returns (-3.0% appreciation + 7.9% rent growth), your $18k cash investment doubles in ~4 years — after that, you're playing with house money.
Negotiation context
- It's been on market 40 days — a 3% lower offer ($63k) is reasonable based on typical stale-listing flexibility.
- 5 sale attempts since 24y ago; this cycle's ask has dropped $10k (13%) from the opening price — seller is motivated, your offer sets the floor, not the list.
- Current owner paid $35k; list at $65k implies a 86% gain — meaningful room to come down on a strong offer.
Risks & watch-outs
- Watch-outs: built in 1925 — expect roof / HVAC / electrical / plumbing capex.
Questions for the listing agent
- It's been on market 40 days. Have you received any prior offers? Is the seller open to a 3% concession, seller financing, or rate buy-down credit?
- Built in 1925 — when were the roof, HVAC, electrical panel, plumbing, and water heater last replaced?
- Is there a deadline driving the sale (1031 exchange, divorce, estate, relocation)? That informs how much negotiation room exists.
- Schools are F-rated, which usually means shorter tenancies and higher turnover. Who's the typical renter profile here, and what's been the actual vacancy rate?
- Crime grade is D in this area — have there been break-ins, vandalism, or insurance claims at this property in the last 3 years? What carrier currently insures it and at what premium?
- What's the average days-on-market for RENTAL listings here right now (not sales)? A rising rental-DOM trend means longer vacancies and softer asking-rent achievability than the comps imply.
- What's the recent tenant-quality profile in this submarket — average credit score on applications, eviction rate, late-payment / NSF rate, and stable-employment percentage? A property-management company in the area should have these aggregated.
- How much new for-sale + rental construction is in the pipeline within 1–3 miles? Heavy new supply typically softens prices + rents 12–24 months out; constrained supply supports both.
Investment metrics
- 1% rule
- 1.68% ✓
- Cap rate
- 14.69%
- Cash-on-cash
- 29.99%
- DSCR
- 2.33
- GRM
- 5.0
CMA / ARV
- ARV (median comp)
- $92,943
- List price
- $65,000
- Delta
- -30.06%
- Verdict
- UNDERPRICED
- Comps
- 20 within 1.0 mi
Show comp detail 12 sales within ~0.75 mi
| Address | Dist | Beds/Ba | Sqft | Sold | Price | $/sf | Match |
|---|---|---|---|---|---|---|---|
| 2803 E Lynn St | 0.13mi | 3/1.0 | 1,358 (+1%) | 2mo | $160,000 | $118 | 91 |
| 2709 E Lynn St | 0.17mi | 2/1.0 (-1) | 1,305 (-3%) | 8mo | $135,000 | $103 | 75 |
| 3410 Forest Ter | 0.41mi | 2/1.0 (-1) | 1,344 (-0%) | 8mo | $120,000 | $89 | 69 |
| 1020 E 30th St | 0.08mi | 2/1.0 (-1) | 1,487 (+10%) | 7mo | $60,500 | $41 | 68 |
| 2926 Jefferson St | 0.29mi | 3/1.0 | 1,196 (-11%) | 8mo | $108,000 | $90 | 61 |
| 329 E 31st St | 0.54mi | 2/2.0 (-1) | 1,334 (-1%) | 7mo | $130,000 | $97 | 58 |
| 2915 Central Ave | 0.66mi | 2/1.0 (-1) | 1,309 (-3%) | 2mo | $59,000 | $45 | 58 |
| 3716 Columbus Ave | 0.66mi | 2/1.0 (-1) | 1,415 (+5%) | 2mo | $23,750 | $17 | 54 |
| 2120 George St | 0.62mi | 2/1.0 (-1) | 1,431 (+6%) | 3mo | $70,000 | $49 | 53 |
| 3711 Burton Pl | 0.68mi | 3/1.0 | 1,224 (-9%) | 2mo | $116,000 | $95 | 51 |
| 3608 Burton Pl | 0.62mi | 3/1.0 | 1,443 (+7%) | 10mo | $115,000 | $80 | 51 |
| 2425 Fletcher St | 0.69mi | 2/1.0 (-1) | 1,521 (+13%) | 7mo | $89,900 | $59 | 36 |
Match score weights: distance 35% · size 25% · config 20% · recency 20%. Top-matched comps best support the ARV.
Projected returns pro-forma
-3.0% appreciation · 7.88% rent growth · sell at horizon
- IRR
- 29.7%
- Equity multiple
- 2.32×
- Total profit
- $24,041
- Equity at exit
- $9,692
- IRR
- 39.6%
- Equity multiple
- 5.60×
- Total profit
- $83,690
- Equity at exit
- $5,620
Cash invested: $18,200 (down + closing). Projections, not guarantees.
Landlord ↔ Tenant lean methodology
- Overall (STATE)
- 90 Strongly Landlord-Friendly
- State Indiana
- 90 Strongly Landlord-Friendly · R+11
- County
- — inherits STATE
- City
- — inherits STATE
ZIP-level market 46016
- Home prices YoY
- -3.5%
- Rents YoY
- 7.9%
- Active inventory
- 188
- Price-to-rent
- 5.0×
Monthly cashflow live
- Estimated rent
- $1,090 high interval (Pro) →
- Mortgage (P&I)
- −$341
- Tax from tax record
- −$38 /mo · $460/yr
- Insurance
- −$27
- HOA
- −$0
- Vacancy / Maint / Mgmt
- −$229
- Net cashflow
- $455
Break-even live
Sensitivity live
| Price | -10% $492 | -5% $473 | +0% $455 | +5% $436 | +10% $418 |
|---|---|---|---|---|---|
| Rent | -10% $369 | -5% $412 | +0% $455 | +5% $498 | +10% $541 |
| Rate | -1.0pp $488 | -0.5pp $471 | base $455 | +0.5pp $438 | +1.0pp $421 |
UW: 25.0% down · 7.5% · 30yr · 1.5% tax · 5.0% vac · 8.0% maint · 8.0% mgmt
Financing live
Cash to close
- Down payment
- $16,250
- Closing costs
- $1,950
- Reserves months
- —
- Total cash needed
- —
Loan-product check · same deal, 3 products live
Conventional
25% down · 7.5% · 30yr
- Down + closing
- —
- Monthly P&I
- —
- Monthly cashflow
- —
- DSCR
- —
- Eligible?
- —
Personal DTI + credit; lowest rate.
DSCR
20% down · 8.5% · 30yr
- Down + closing
- —
- Monthly P&I
- —
- Monthly cashflow
- —
- DSCR
- —
- Eligible?
- —
No personal income docs; deal must DSCR.
Hard money
10% down · 12.0% · 12mo
- Down + closing
- —
- Monthly P&I
- —
- Monthly cashflow
- —
- DSCR
- —
- Eligible?
- —
Short-term bridge; refi at stabilization.
Rent comps 23 comps
| Address | Beds | Baths | Sqft | Rent | $/sqft | DOM | Units | Dist |
|---|---|---|---|---|---|---|---|---|
| 3009 E Lynn St Unit 1 Anderson, IN | 3.0 | 1.0 | 1000 | $875 | $0.88 | 21d | 1 | 0.09mi |
| 1318 E 28th St Anderson, IN | 3.0 | 1.0 | 1280 | $1,300 | $1.02 | 13d | 1 | 0.17mi |
| 3006 Noble St Anderson, IN | 2.0 | 1.0 | 1064 | $995 | $0.94 | 8d | 1 | 0.34mi |
| 228 E 29th St Anderson, IN | 3.0 | 2.0 | 1440 | $1,295 | $0.90 | 5d | 1 | 0.58mi |
| 2023 McKinley St Anderson, IN | 2.0 | 1.0 | 1500 | $950 | $0.63 | 44d | 1 | 0.64mi |
| 2625 Main St Anderson, IN | 2.0 | 1.0 | 988 | $895 | $0.91 | 24d | 1 | 0.71mi |
| 2111 Central Ave Anderson, IN | 3.0 | 1.0 | 1026 | $1,250 | $1.22 | 44d | 1 | 0.85mi |
| 3021 Delaware St Anderson, IN | 2.0 | 1.0 | 1154 | $1,150 | $1.00 | 8d | 1 | 0.89mi |
| 1726-1728 Walnut St Anderson, IN | 2.0 | 2.0 | 900 | $995 | $1.11 | 3d | 1 | 0.89mi |
| 2627 Chase St Anderson, IN | 3.0 | 1.0 | 1050 | $850 | $0.81 | 18d | 1 | 1.02mi |
| 812 Mellen Dr Unit 814 Anderson, IN | 2.0 | 1.0 | 924 | $950 | $1.03 | 3d | 1 | 1.14mi |
| 4426 Mellen Ct Anderson, IN | 2.0 | 1.0 | 899 | $900 | $1.00 | 2d | 1 | 1.20mi |
| 229 W 19th St Anderson, IN | 3.0 | 1.0 | 1200 | $1,000 | $0.83 | 44d | 1 | 1.21mi |
| 219 E 13th St Anderson, IN | 3.0 | 1.0 | 882 | $1,000 | $1.13 | 5d | 1 | 1.25mi |
| 2233 Fairview St Anderson, IN | 3.0 | 1.5 | 1452 | $1,195 | $0.82 | 24d | 1 | 1.28mi |
| 1626 Lora St Anderson, IN | 3.0 | 2.0 | 1352 | $1,295 | $0.96 | 44d | 1 | 1.30mi |
| 4015 Haverhill Dr Anderson, IN | 3.0 | 2.0 | 884 | $1,100 | $1.24 | 44d | 1 | 1.31mi |
| 618 W 22nd St Anderson, IN | 3.0 | 1.0 | 900 | $1,250 | $1.39 | 44d | 1 | 1.33mi |
| 2301 Sheridan St Anderson, IN | 2.0 | 1.0 | 900 | $950 | $1.06 | 44d | 1 | 1.33mi |
| 1045 Alhambra Dr Unit 6 Anderson, IN | 2.0 | 1.5 | 900 | $975 | $1.08 | 24d | 1 | 1.35mi |
| 4021 Brown St Anderson, IN | 2.0 | 1.0 | 1320 | $975 | $0.74 | 8d | 1 | 1.38mi |
| 1023 E 8th St Unit 3 Anderson, IN | 2.0 | 1.5 | 1200 | $1,175 | $0.98 | 8d | 1 | 1.43mi |
| 1829 E 8th St Anderson, IN | 1.0–3.0 | 1.0 | 810 | $1,250 | $1.54 | 24d | 9 | 1.43mi |
Listing history 23 events
-
2026-06-21days on market $65,000 Active 40 DOM
-
2026-06-18days on market $65,000 Active 37 DOM
-
2026-06-17days on market $65,000 Active 36 DOM
-
2026-06-16days on market $65,000 Active 35 DOM
-
2026-06-15days on market $65,000 Active 34 DOM
-
2026-06-13days on market $65,000 Active 32 DOM
-
2026-06-09days on market $65,000 Active 28 DOM
-
2026-06-08pricedays on market $65,000 Active 27 DOM
-
2026-06-07days on market $69,000 Active 26 DOM
-
2026-06-05days on market $69,000 Active 23 DOM
-
2026-06-03days on market $69,000 Active 22 DOM
-
2026-06-02days on market $69,000 Active 21 DOM
-
2026-06-01days on market $69,000 Active 20 DOM
-
2026-05-31days on market $69,000 Active 19 DOM
-
2026-05-12$75,000 Active 223-char remark
-
2007-04-02soldstatus $35,000 295-char remark
Show marketing remark (295 chars)
NICE LITTLE HOME NEEDS A LITTLE TLC, NEWER ROOFING,NEWER SIDING, MOST WINDOWS AND DOORS ARE ARE REPLACEMENT. NICE DECK OFF THE REAR. HOME ALSO HAS A .63 ACRE OF AN LOT DIRECTLY BEHIND THE PROPERTY. THIS HOME WOULD MAKE A GREAT STARTER HOME OR RENTAL PROPERTY. THIS HOME IS SOLD BEING SOLD AS IS.
-
2007-02-08$36,500 295-char remark
Show marketing remark (295 chars)
NICE LITTLE HOME NEEDS A LITTLE TLC, NEWER ROOFING,NEWER SIDING, MOST WINDOWS AND DOORS ARE ARE REPLACEMENT. NICE DECK OFF THE REAR. HOME ALSO HAS A .63 ACRE OF AN LOT DIRECTLY BEHIND THE PROPERTY. THIS HOME WOULD MAKE A GREAT STARTER HOME OR RENTAL PROPERTY. THIS HOME IS SOLD BEING SOLD AS IS.
-
2007-01-16historical
-
2006-10-16$36,500
-
2006-08-19historical
-
2005-08-19$36,000
-
2003-01-31soldstatus $53,400
-
2002-09-20$53,400
ⓘ Source: listings_history table (triggers on properties + properties_extension) + one-shot
backfill from property_details.listing_events for pre-trigger history.
Tax reassessment forecast IN · Partial reset (capped growth)
- Current annual tax
- $460 · $38/mo
- Projected year-2 tax
- $506 · $42/mo
- Expected delta
- +$46/yr (+$4/mo · 10.0%)
ⓘ Screening estimate from a state-policy table — verify with the county assessor before closing.
Climate risk First Street
- Flood 1/10 Low FEMA zone X (unshaded) · 0% chance over 30 yrs
- Wildfire 1/10 Low
- Heat 3/10 Moderate 7 d/yr ≥100°F today · 18 d/yr by 30 yrs out
- Wind 2/10 Low 0% chance of damaging wind over 30 yrs
- Air quality 3/10 Moderate 2 unhealthy d/yr today · 3 by 30 yrs out
Nearby sold comps map
Loading sold comps map…
Walkable amenities ~0.75 mi
Loading nearby amenities…
Taxation est. · year 1
- Rental income
- $13,080
- − Mortgage interest
- −$3,641
- − Property taxes
- −$460
- − Insurance
- −$325
- − Repairs & maintenance
- −$1,046
- − Management
- −$1,046
- − Depreciation
- −$1,891
- Taxable income
- $4,670
- Est. tax owed @ 24.0%
- −$1,121
- After-tax cash flow
- $4,337/yr
For passive investors: Depreciation is non-cash, so a rental often shows a tax loss while cash-flowing — sheltering income. Rental losses are passive: they offset passive income freely, and up to $25,000/yr can offset ordinary (W-2) income if you actively participate and your MAGI is under $100k (phasing out to $0 by $150k); unused losses carry forward. On sale, claimed depreciation is recaptured at up to 25%, and gains may owe capital-gains tax (a 1031 exchange can defer both). Figures are a year-1 estimate at your 24.0% rate — not tax advice; consult a CPA.
Schools (NCES district)
- District
- Anderson Community School Corporation
- NCES district ID
- 1800150
- Math proficiency
- 15% ▼ -14.00%
- Reading proficiency
- 23% ▼ -7.00%
- Median HH income
- $38,208
- Composite
- 15.93/100
- National rank
- #9250
- State rank
- #280 of 301 in IN
Livability — Anderson
- Score
- 60/100
- State rank
- #521
- US rank
- #18709
Category grades
Schools grade is shown separately in the Schools card above.
Census & demographics
- Census place
- Anderson, IN
- County
- Madison County · 69,445 people
- City population
- 57,762
- Metro
- Indianapolis-Carmel-Anderson, IN
- Population (ZIP)
- 17,834
- Household income
- $36,029
- Rent vs Own
- Severe rent burden
- 1193.0
Population outlook (Madison County) Hauer SSP2
- Today (2025)
- 125,800 people
- By 2030
- 122,640 · -2.5%
- By 2040
- 115,420 · -8.3%
- By 2050
- 108,148 · -14.0%
- By 2075
- 91,838 · -27.0%
- By 2100
- 75,670 · -39.8%
Race, ethnicity, and origin ACS 2023
- Neighborhood character
- Diverse neighborhood (Simpson 0.58)
- Race & ethnicity
- White 61% Black 18% Hispanic / Latino 13% Two or more races 11% Native American 1%
- Hispanic origin (detail)
- Mexican 10% Puerto Rican 1%
- Common ancestry
- Italian 2% Slovak 1% Iranian 1%
- Foreign-born
- 4% · Canada
- Languages at home
- 86% English-only · Spanish 12%
Political lean MEDSL · Madison
- 2024 margin
- Strong R (+26.9) · D 35.6% · R 62.5% · Other 1.9%
- 2008→2024 swing
- -33.5pp toward R · 2008: 6.5pp · 2024: -26.9pp
- All cycles
- 2024: R+26.9 2020: R+22.6 2016: R+25.7 2012: R+4.5 2008: D+6.5
Not yet ingested
- Civics
- —
Market trends
- HPI YoY
- ▼ -11.12%
- Current HPI
- 302.7437
- Rent YoY
- ▲ 7.88%
- Metro
- Indianapolis-Carmel-Anderson, IN
- State GDP YoY
- ▲ 2.90%
- F500 in state
- 18
Industry mix (Fortune 500 HQ in IN)
| Industry | F500 HQs | Revenue |
|---|---|---|
| Industrial Machinery | 2 | $37B |
|
||
| Healthcare | 1 | $177B |
|
||
| Pharmaceuticals | 1 | $45B |
|
||
| Metals / Steel | 1 | $18B |
|
||
| Agriculture | 1 | $17B |
|
||
| Packaging | 1 | $12B |
|
||
Price history
+21.7% since first listed11 events — show timeline
- 2026-06-08 Price Changed $65,000 MIBOR as Distributed by MLS Grid
- 2026-05-22 Price Changed $69,000 MIBOR as Distributed by MLS Grid
- 2026-05-12 Listed $75,000 MIBOR as Distributed by MLS Grid
- 2007-04-02 Sold (MLS) $35,000 MIBOR as Distributed by MLS Grid
- 2007-02-08 Listed $36,500 MIBOR as Distributed by MLS Grid
- 2007-01-16 Listing Removed — MIBOR as Distributed by MLS Grid
- 2006-10-16 Listed $36,500 MIBOR as Distributed by MLS Grid
- 2006-08-19 Listing Removed — MIBOR as Distributed by MLS Grid
- 2005-08-19 Listed $36,000 MIBOR as Distributed by MLS Grid
- 2003-01-31 Sold (MLS) $53,400 MIBOR as Distributed by MLS Grid
- 2002-09-20 Listed $53,400 MIBOR as Distributed by MLS Grid
Property tax history
+2.9%/yrLatest (2021): $460 · +5.9% YoY. Source: county tax records.
Cash-flow waterfall
monthlySold comps — $/sqft
last 12 mo · ≤1 miLoading sold comps…