25920 View · Valle Vista, CA
Flood risk 1/10 · Minimal
- FEMA flood zone
- X (unshaded)
- Chance of flooding over 30 yrs
- 0.0%
- Est. flood insurance / yr
- $507 – $1,088
Fire risk 10/10 · Severe
- Est. fire insurance / yr
- $659 – $1,223
Heat risk 7/10 · Major
- Hot days now (above 101°F)
- 7 days/yr
- Hot days in 30 yrs
- 22 days/yr
Wind risk 1/10 · Minimal
- Chance of severe wind over 30 yrs
- —
Air-quality risk 6/10 · Moderate
- Unhealthy air days now
- 10 days/yr
- Unhealthy air days in 30 yrs
- 12 days/yr
Risk factors via First Street. Map © Google.
Why this score? — see what drove the C grade
The composite is a weighted blend of 9 inputs, each scored 0–100. Each bar is that input's sub-score; the figure is the points it added to the 100-point composite (weight × sub-score).
- Cash flow +25.6/30.0
- DSCR +8.5/10.0
- ARV discount +7.5/15.0
- 1% rule +5.8/10.0
- Rent growth +3.7/5.0
- Livability +2.9/5.0
- Schools +2.5/10.0
- Condition / age +2.5/5.0
- Appreciation +0.0/10.0
$234,900
🖨 Deal sheet 📄 Offer letter ✓ Due diligence
Listing remarks
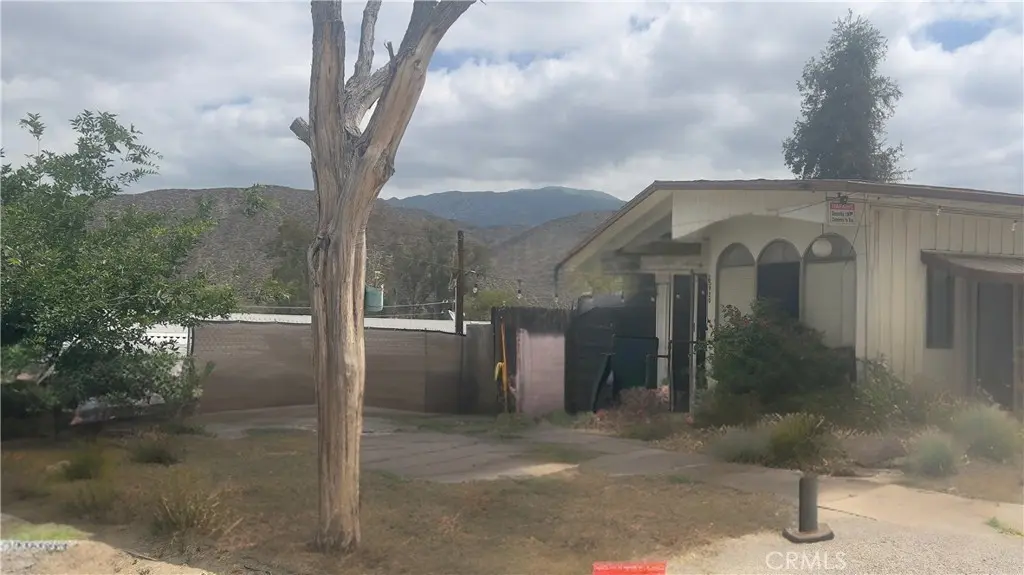
Great opportunity for investors or owner-occupants! This tenant-occupied manufactured home offers expanded living space with permitted bonus room additions and a functional layout that feels much larger than expected. Situated on a generously sized lot with beautiful mountain views, the property features spacious living areas, covered patio space, additional flex/storage rooms, and plenty of outdoor usability. The interior has been well maintained and offers excellent potential for personalization or long-term investment value. Conveniently located near shopping, schools, and commuter access. A must-see property with unique space and versatility not commonly found in this price range!
Key facts
- 8,712 sq ft lot
- 2 garage spots
- Built 1966
Property features AI
Finance
- Financial info: Assessments: Unknown
- HOA & community: Community offers biking, hiking; mountainous area
Exterior
- Parking: Attached garage with front entry; Driveway (concrete); Two parking spaces
- Utilities: Public/District water; Public sewer; Natural gas connected; Electricity connected; Sewer connected
- Home design: Manufactured house; Single-story; Faces west
- Construction: No common walls; Year built source: appraiser
- Exterior features: Covered front porch and additional porch; Patio; Awning; Has a view; 0–1 unit/acre lot characteristic
Interior
- Kitchen: Formica counters; Formal dining area
- Bedrooms: Two main-level bedrooms; All bedrooms on the lower level
- Flooring: Vinyl; Carpet
- Bathrooms: Two full bathrooms; Bathtub; Shower-in-tub
- Heating & cooling: Central furnace heating; Heat pump; Evaporative cooling
- Interior features: Blinds; One-level home with front entry; Main floor primary bedroom; Bonus room; Living room
- Laundry & utility: Washer hookup; Gas dryer hookup; Laundry room
Neighborhood map
What this means for you Summary
Snapshot
- This is a 2-bed/2.0-bath manufactured listed at $235k.
Deal economics
- At list price, monthly cash flow is $557 ($7k/yr) — positive.
- The deal already cash-flows at list — no discount required.
- Meets the 1% rule at list price ($3k rent vs $235k).
- Recommended offer: $231k (1.5% below list) — sets the bar for market timing.
- Cap rate 9.1% vs local median 4.3% in Valle Vista — top-decile yield for the area; either an underpriced asset or a hidden risk that comps aren't pricing in. Stress-test before assuming the spread holds.
Location & tenants
- Location reads 57/100 on livability (#739 in CA) — a working-class tenant base; expect higher turnover. Strengths: housing A+; Watch: employment D+, schools F, crime F.
- Hemet Unified (suburban): math 19% / reading 41% proficiency, ranked #360 of 517 in CA (top 70%) — families likely to look elsewhere, expect single-tenant / working-renter base with shorter leases; 66% free/reduced lunch — lower-income household profile, screen leases tightly.
- Market conditions: Rents rising fast (+4.9%/yr); 323 active listings in the ZIP; 4 comparable units currently listed for rent nearby; rentals lingering (median 44d on market — plan ~5-8 weeks vacancy on turnover, expect pricing pressure); 50% of comp listings sitting > 30 days — soft ceiling on asking rent; 9,195 units permitted in Riverside County in 2024 (1,512 in 5+ unit buildings).
- This rent runs 41% of the median local income ($74k/yr) — at the standard rent-burdened threshold; future hikes will face affordability resistance.
Forward outlook
- Local home prices are declining (-3.0%/yr); year-one equity from $2k of loan paydown is wiped out by about $7k of value loss. Plan a longer hold.
- Riverside County population projected at +22% by 2050 — long-run rental-demand tailwind backs the buy-and-hold thesis.
- At projected returns (-3.0% appreciation + 4.9% rent growth), your $66k cash investment doubles in ~9 years — after that, you're playing with house money.
Negotiation context
- It's been on market 15 days — a 2% lower offer ($231k) is reasonable based on typical stale-listing flexibility.
Risks & watch-outs
- Climate carrying-cost: severe wildfire risk; extreme-heat days projected 7→22/yr by 2055 (HVAC capex compounding) — expect insurance premiums to compound above CPI over the hold.
Questions for the listing agent
- Built in 1966 — when were the roof, HVAC, electrical panel, plumbing, and water heater last replaced?
- Is there a deadline driving the sale (1031 exchange, divorce, estate, relocation)? That informs how much negotiation room exists.
- Schools are F-rated, which usually means shorter tenancies and higher turnover. Who's the typical renter profile here, and what's been the actual vacancy rate?
- Crime grade is F in this area — have there been break-ins, vandalism, or insurance claims at this property in the last 3 years? What carrier currently insures it and at what premium?
- What's the average days-on-market for RENTAL listings here right now (not sales)? A rising rental-DOM trend means longer vacancies and softer asking-rent achievability than the comps imply.
- What's the recent tenant-quality profile in this submarket — average credit score on applications, eviction rate, late-payment / NSF rate, and stable-employment percentage? A property-management company in the area should have these aggregated.
- How much new for-sale + rental construction is in the pipeline within 1–3 miles? Heavy new supply typically softens prices + rents 12–24 months out; constrained supply supports both.
Investment metrics
- 1% rule
- 1.08% ✓
- Cap rate
- 9.14%
- Cash-on-cash
- 10.16%
- DSCR
- 1.45
- GRM
- 7.7
CMA / ARV
- ARV (on-the-fly)
- $129,884
- Comps found
- 3
Show comp detail 3 sales within ~0.75 mi
| Address | Dist | Beds/Ba | Sqft | Sold | Price | $/sf | Match |
|---|---|---|---|---|---|---|---|
| 45521 State Highway 74 #104 | 0.28mi | 3/2.0 (+1) | 1,512 (-12%) | 2mo | $115,000 | $76 | 61 |
| 45521 State Highway 74 #107 | 0.30mi | 3/2.0 (+1) | 1,664 (-3%) | 22mo | $185,000 | $111 | 58 |
| 45521 E State Highway 74, Spc 25 | 0.29mi | 3/2.0 (+1) | 1,600 (-6%) | 18mo | $111,200 | $70 | 56 |
Match score weights: distance 35% · size 25% · config 20% · recency 20%. Top-matched comps best support the ARV.
Projected returns pro-forma
-3.0% appreciation · 4.9% rent growth · sell at horizon
- IRR
- 0.9%
- Equity multiple
- 1.03×
- Total profit
- $2,267
- Equity at exit
- $35,024
- IRR
- 12.2%
- Equity multiple
- 2.04×
- Total profit
- $68,425
- Equity at exit
- $20,310
Cash invested: $65,772 (down + closing). Projections, not guarantees.
Landlord ↔ Tenant lean methodology
- Overall (STATE)
- 18 Strongly Tenant-Friendly
- State California
- 18 Strongly Tenant-Friendly · D+13
- County
- — inherits STATE
- City
- — inherits STATE
ZIP-level market 92544
- Rents YoY
- 4.9%
- Active inventory
- 323
- Price-to-rent
- 7.7×
Monthly cashflow live
- Estimated rent
- $2,536 medium interval (Pro) →
- Mortgage (P&I)
- −$1,232
- Tax from tax record
- −$117 /mo · $1,404/yr
- Insurance
- −$98
- HOA
- −$0
- Vacancy / Maint / Mgmt
- −$533
- Net cashflow
- $557
Break-even live
UW: 25.0% down · 7.5% · 30yr · 1.5% tax · 5.0% vac · 8.0% maint · 8.0% mgmt
Financing live
Cash to close
- Down payment
- $58,725
- Closing costs
- $7,047
- Reserves months
- —
- Total cash needed
- —
Loan-product check · same deal, 3 products live
Conventional
25% down · 7.5% · 30yr
- Down + closing
- —
- Monthly P&I
- —
- Monthly cashflow
- —
- DSCR
- —
- Eligible?
- —
Personal DTI + credit; lowest rate.
DSCR
20% down · 8.5% · 30yr
- Down + closing
- —
- Monthly P&I
- —
- Monthly cashflow
- —
- DSCR
- —
- Eligible?
- —
No personal income docs; deal must DSCR.
Hard money
10% down · 12.0% · 12mo
- Down + closing
- —
- Monthly P&I
- —
- Monthly cashflow
- —
- DSCR
- —
- Eligible?
- —
Short-term bridge; refi at stabilization.
Rent comps 4 comps
| Address | Beds | Baths | Sqft | Rent | $/sqft | DOM | Units | Dist |
|---|---|---|---|---|---|---|---|---|
| 26126 Marshall Ave Hemet, CA | 3.0 | 2.0 | 1350 | $2,610 | $1.93 | 12d | 1 | 0.22mi |
| 26126 Marshall Ave Hemet, CA | 3.0 | 2.0 | 1350 | $2,900 | $2.15 | 20d | 1 | 0.22mi |
| 44826 Orpington Ave Hemet, CA | 3.0 | 2.0 | 1419 | $2,500 | $1.76 | 43d | 1 | 1.07mi |
| 44755 Palm Ave Hemet, CA | 3.0 | 2.0 | 1478 | $2,700 | $1.83 | 43d | 1 | 1.18mi |
Listing history 13 events
-
2026-06-18days on market $234,900 Active 15 DOM
-
2026-06-17days on market $234,900 Active 14 DOM
-
2026-06-16days on market $234,900 Active 13 DOM
-
2026-06-15days on market $234,900 Active 12 DOM
-
2026-06-13days on market $234,900 Active 10 DOM
-
2026-06-09days on market $234,900 Active 6 DOM
-
2026-06-08days on market $234,900 Active 5 DOM
-
2026-06-07days on market $234,900 Active 4 DOM
-
2026-06-03statusdays on market $234,900 Active 1 DOM
-
2026-06-02days on market $234,900 Coming Soon 8 DOM
-
2026-06-01days on market $234,900 Coming Soon 7 DOM
-
2026-05-31days on market $234,900 Coming Soon 6 DOM
-
2026-05-26historical $234,900
ⓘ Source: listings_history table (triggers on properties + properties_extension) + one-shot
backfill from property_details.listing_events for pre-trigger history.
Tax reassessment forecast CA · Resets to sale price
- Current annual tax
- $1,404 · $117/mo
- Projected year-2 tax
- $1,785 · $149/mo
- Expected delta
- +$381/yr (+$32/mo · 27.2%)
ⓘ Screening estimate from a state-policy table — verify with the county assessor before closing.
Climate risk First Street
- Flood 1/10 Low FEMA zone X (unshaded) · 0% chance over 30 yrs
- Wildfire 10/10 Extreme
- Heat 7/10 Severe 7 d/yr ≥101°F today · 22 d/yr by 30 yrs out
- Wind 1/10 Low
- Air quality 6/10 Major 10 unhealthy d/yr today · 12 by 30 yrs out
Nearby sold comps map
Loading sold comps map…
Walkable amenities ~0.75 mi
Loading nearby amenities…
Taxation est. · year 1
- Rental income
- $30,433
- − Mortgage interest
- −$13,158
- − Property taxes
- −$1,404
- − Insurance
- −$1,174
- − Repairs & maintenance
- −$2,435
- − Management
- −$2,435
- − Depreciation
- −$6,833
- Taxable income
- $2,994
- Est. tax owed @ 24.0%
- −$718
- After-tax cash flow
- $5,963/yr
For passive investors: Depreciation is non-cash, so a rental often shows a tax loss while cash-flowing — sheltering income. Rental losses are passive: they offset passive income freely, and up to $25,000/yr can offset ordinary (W-2) income if you actively participate and your MAGI is under $100k (phasing out to $0 by $150k); unused losses carry forward. On sale, claimed depreciation is recaptured at up to 25%, and gains may owe capital-gains tax (a 1031 exchange can defer both). Figures are a year-1 estimate at your 24.0% rate — not tax advice; consult a CPA.
Schools (NCES district)
- District
- Hemet Unified
- NCES district ID
- 0616920
- Math proficiency
- 19% ▼ -3.00%
- Reading proficiency
- 41% ▲ 4.00%
- Median HH income
- $39,962
- Composite
- 25.16/100
- National rank
- #7517
- State rank
- #360 of 517 in CA
Livability — Valle Vista
- Score
- 57/100
- State rank
- #739
- US rank
- #21678
Category grades
Schools grade is shown separately in the Schools card above.
Census & demographics
- Census place
- Valle Vista, CA
- County
- Riverside County · 2,287,001 people
- Metro
- Riverside-San Bernardino-Ontario, CA
- Population (ZIP)
- 51,751
- Household income
- $73,596
- Rent vs Own
- Severe rent burden
- 1518.0
Population outlook (Riverside County) Hauer SSP2
- Today (2025)
- 2,664,475 people
- By 2030
- 2,802,692 · +5.2%
- By 2040
- 3,050,904 · +14.5%
- By 2050
- 3,256,783 · +22.2%
- By 2075
- 3,655,058 · +37.2%
- By 2100
- 3,766,594 · +41.4%
Race, ethnicity, and origin ACS 2023
- Neighborhood character
- Diverse neighborhood (Simpson 0.59)
- Race & ethnicity
- Hispanic / Latino 49% White 40% Two or more races 18% Black 5% Asian 3% Native American 2%
- Hispanic origin (detail)
- Mexican 43% Puerto Rican 1%
- Common ancestry
- Slovak 2% Italian 2% Portuguese 2%
- Foreign-born
- 15% · Canada, China
- Languages at home
- 70% English-only · Spanish 27% Other Asian/Pacific 1% Other Indo-European 1%
Political lean MEDSL · Riverside
- 2024 margin
- Toss-up / Even · D 48.0% · R 49.3% · Other 2.6%
- 2008→2024 swing
- -3.6pp toward R · 2008: 2.3pp · 2024: -1.3pp
- All cycles
- 2024: R+1.3 2020: D+8.0 2016: D+4.3 2012: R+0.4 2008: D+2.3
Not yet ingested
- Civics
- —
Market trends
- HPI YoY
- ▼ -219.06%
- Current HPI
- 391.972
- Rent YoY
- ▲ 4.90%
- Metro
- Riverside-San Bernardino-Ontario, CA
- State GDP YoY
- ▲ 3.21%
- F500 in state
- 116
Industry mix (Fortune 500 HQ in CA)
| Industry | F500 HQs | Revenue |
|---|---|---|
| Technology | 27 | $1,492B |
|
||
| Financial Services | 3 | $174B |
|
||
| Retail | 3 | $44B |
|
||
| Insurance | 3 | $26B |
|
||
| Media / Entertainment | 2 | $115B |
|
||
| Pharmaceuticals / Biotech | 2 | $62B |
|
||
Price history
1 event — show timeline
- 2026-05-26 Coming Soon $234,900 CRMLS
Property tax history
+6.0%/yrLatest (2025): $1,404 · +111.2% YoY. Source: county tax records.
Cash-flow waterfall
monthlySold comps — $/sqft
last 12 mo · ≤1 miLoading sold comps…