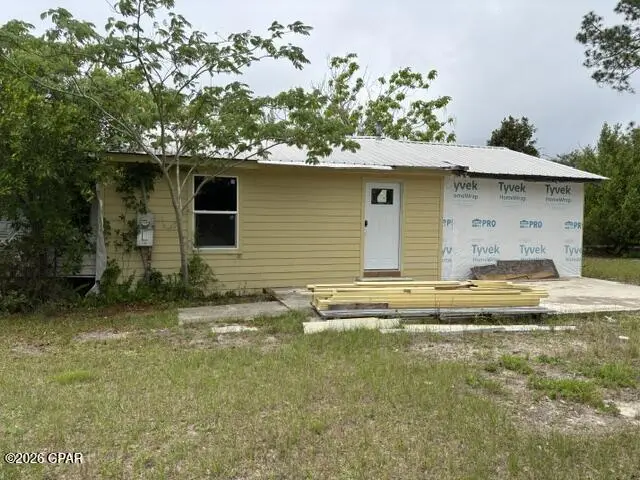
2600 W 18th St · Panama City, FL
Flood risk 1/10 · Minimal
- FEMA flood zone
- X (unshaded)
- Chance of flooding over 30 yrs
- 0.0%
- Est. flood insurance / yr
- $507 – $1,088
Fire risk 1/10 · Minimal
- Est. fire insurance / yr
- $947 – $1,759
Heat risk 10/10 · Severe
- Hot days now (above 106°F)
- 7 days/yr
- Hot days in 30 yrs
- 22 days/yr
Wind risk 9/10 · Severe
- Chance of severe wind over 30 yrs
- 99.0%
Air-quality risk 1/10 · Minimal
- Unhealthy air days now
- 0 days/yr
- Unhealthy air days in 30 yrs
- 0 days/yr
Risk factors via First Street. Map © Google.
Why this score? — see what drove the B grade
The composite is a weighted blend of 9 inputs, each scored 0–100. Each bar is that input's sub-score; the figure is the points it added to the 100-point composite (weight × sub-score).
- Cash flow +30.0/30.0
- 1% rule +10.0/10.0
- DSCR +10.0/10.0
- ARV discount +7.5/15.0
- Schools +4.3/10.0
- Livability +3.6/5.0
- Rent growth +2.8/5.0
- Condition / age +2.5/5.0
- Appreciation +0.0/10.0
$99,000
🖨 Deal sheet 📄 Offer letter ✓ Due diligence
Listing remarks MLS
Investor Special!! Great location!! Charming Fixer Upper located in the desirable St. Andrews neighborhood. This home needs major renovations but has tons of potential. Florida Room has damage from a tornado. Large corner lot! Bring your vision and transform this into a fantastic investment! Call your favorite realtor today! Cash only. Sold As-Is
Key facts
- Corner home
- Complete renovation
- 9,235 sq ft lot
Tags
Property features AI
Finance
- HOA & community: Short-term rentals allowed
Exterior
- Utilities: Electricity available; Public sewer
- Home design: Residential multi-family zoning
- Construction: Wood frame construction; Slab foundation
- Exterior features: Lot dimensions approximately 70 x 132; Lot area about 0.21 acres; Publicly maintained city street access; Paved lot/road
Interior
- Kitchen: Kitchen (first level) — 20 x 14
- Bedrooms: Primary bedroom (first level); Two additional bedrooms (first level); Bedroom (first level) — 11 x 13
- Bathrooms: 1 full bathroom
- Heating & cooling: Central air conditioning; Electric heating
- Interior features: 5 total rooms; Paved road frontage (city street)
Neighborhood map
What this means for you Summary
Snapshot
- This is a 3-bed/1.0-bath single-family listed at $99k.
Deal economics
- At list price, monthly cash flow is $656 ($8k/yr) — positive.
- The deal already cash-flows at list — no discount required.
- Meets the 1% rule at list price ($2k rent vs $99k).
- Recommended offer: $98k (1.5% below list) — sets the bar for market timing.
- Cap rate 14.3% vs local median 4.7% in Panama City — top-decile yield for the area; either an underpriced asset or a hidden risk that comps aren't pricing in. Stress-test before assuming the spread holds.
Location & tenants
- Location reads 72/100 on livability (#350 in FL) — a middle-class / working-renter tenant base. Strengths: cost of living A+, housing A+, health & safety A+; Watch: crime F, amenities F, commute F.
- Bay (suburban): math 51% / reading 51% proficiency, ranked #29 of 73 in FL (top 40%) — acceptable for families but not a draw, mixed tenant base, ~2y average lease.
- Market conditions: Rents rising (+1.2%/yr); 381 active listings in the ZIP; 8 comparable units currently listed for rent nearby; rentals at typical pace (median 21d on market — plan ~3-4 weeks tenant-placement turnaround); 2,473 units permitted in Bay County in 2024 (559 in 5+ unit buildings).
Forward outlook
- Local home prices are declining (-3.0%/yr); year-one equity from $684 of loan paydown is wiped out by about $3k of value loss. Plan a longer hold.
- Bay County population projected at +24% by 2050 — long-run rental-demand tailwind backs the buy-and-hold thesis.
- At projected returns (-3.0% appreciation + 1.2% rent growth), your $28k cash investment doubles in ~5 years — after that, you're playing with house money.
Negotiation context
- It's been on market 18 days — a 2% lower offer ($98k) is reasonable based on typical stale-listing flexibility.
- 6 sale attempts since 18y ago with the ask held roughly flat each time — persistent listings suggest the price (not the market) is what's stuck; bring a comps-based counter.
- Current owner paid $75k; 32% above their basis — modest negotiation headroom, anchor on the comps not their cost.
Risks & watch-outs
- Watch-outs: built in 1932 — expect roof / HVAC / electrical / plumbing capex.
- Climate carrying-cost: severe wind risk, 99% chance of damaging wind over 30y; extreme-heat days projected 7→22/yr by 2055 (HVAC capex compounding) — expect insurance premiums to compound above CPI over the hold.
Questions for the listing agent
- Built in 1932 — when were the roof, HVAC, electrical panel, plumbing, and water heater last replaced?
- Is there a deadline driving the sale (1031 exchange, divorce, estate, relocation)? That informs how much negotiation room exists.
- Schools are B-rated — typically a magnet for longer-tenancy family renters. What's the average tenant stay here, and is there a school-zone premium baked into asking?
- Crime grade is F in this area — have there been break-ins, vandalism, or insurance claims at this property in the last 3 years? What carrier currently insures it and at what premium?
- What's the average days-on-market for RENTAL listings here right now (not sales)? A rising rental-DOM trend means longer vacancies and softer asking-rent achievability than the comps imply.
- What's the recent tenant-quality profile in this submarket — average credit score on applications, eviction rate, late-payment / NSF rate, and stable-employment percentage? A property-management company in the area should have these aggregated.
- How much new for-sale + rental construction is in the pipeline within 1–3 miles? Heavy new supply typically softens prices + rents 12–24 months out; constrained supply supports both.
Investment metrics
- 1% rule
- 1.72% ✓
- Cap rate
- 14.25%
- Cash-on-cash
- 28.42%
- DSCR
- 2.26
- GRM
- 4.8
CMA / ARV
- ARV (median comp)
- $200,613
- List price
- $99,000
- Delta
- -50.65%
- Verdict
- UNDERPRICED
- Comps
- 20 within 1.0 mi
Show comp detail 4 sales within ~0.75 mi
| Address | Dist | Beds/Ba | Sqft | Sold | Price | $/sf | Match |
|---|---|---|---|---|---|---|---|
| 1813 Hickory Ave | 0.07mi | 2/2.0 (-1) | 894 (-2%) | 12mo | $170,000 | $190 | 74 |
| 2018 Clay Ave Ave | 0.40mi | 3/1.0 | 840 (-8%) | 12mo | $59,000 | $70 | 58 |
| 1708 Lake Ave | 0.42mi | 2/1.0 (-1) | 1,000 (+10%) | 9mo | $110,000 | $110 | 52 |
| 1711 Wilmont Ave Unit 1/2 | 0.14mi | 3/2.0 | 1,040 (+14%) | 21mo | $180,000 | $173 | 49 |
Match score weights: distance 35% · size 25% · config 20% · recency 20%. Top-matched comps best support the ARV.
Projected returns pro-forma
-3.0% appreciation · 1.24% rent growth · sell at horizon
- IRR
- 20.7%
- Equity multiple
- 1.82×
- Total profit
- $22,830
- Equity at exit
- $14,761
- IRR
- 27.6%
- Equity multiple
- 3.24×
- Total profit
- $62,081
- Equity at exit
- $8,560
Cash invested: $27,720 (down + closing). Projections, not guarantees.
Landlord ↔ Tenant lean methodology
- Overall (STATE)
- 87 Strongly Landlord-Friendly
- State Florida
- 87 Strongly Landlord-Friendly · R+3
- County
- — inherits STATE
- City
- — inherits STATE
ZIP-level market 32405
- Rents YoY
- 1.2%
- Active inventory
- 381
- Price-to-rent
- 4.8×
Monthly cashflow live
- Estimated rent
- $1,706 high interval (Pro) →
- Mortgage (P&I)
- −$519
- Tax from tax record
- −$131 /mo · $1,570/yr
- Insurance
- −$41
- HOA
- −$0
- Vacancy / Maint / Mgmt
- −$358
- Net cashflow
- $656
Break-even live
UW: 25.0% down · 7.5% · 30yr · 1.5% tax · 5.0% vac · 8.0% maint · 8.0% mgmt
Financing live
Cash to close
- Down payment
- $24,750
- Closing costs
- $2,970
- Reserves months
- —
- Total cash needed
- —
Loan-product check · same deal, 3 products live
Conventional
25% down · 7.5% · 30yr
- Down + closing
- —
- Monthly P&I
- —
- Monthly cashflow
- —
- DSCR
- —
- Eligible?
- —
Personal DTI + credit; lowest rate.
DSCR
20% down · 8.5% · 30yr
- Down + closing
- —
- Monthly P&I
- —
- Monthly cashflow
- —
- DSCR
- —
- Eligible?
- —
No personal income docs; deal must DSCR.
Hard money
10% down · 12.0% · 12mo
- Down + closing
- —
- Monthly P&I
- —
- Monthly cashflow
- —
- DSCR
- —
- Eligible?
- —
Short-term bridge; refi at stabilization.
Rent comps 8 comps
| Address | Beds | Baths | Sqft | Rent | $/sqft | DOM | Units | Dist |
|---|---|---|---|---|---|---|---|---|
| 1804 Arthur Ave Panama City, FL | 3.0 | 1.5 | 1044 | $1,795 | $1.72 | 21d | 1 | 0.13mi |
| 1301 Frankford Ave Apt B104 Panama City, FL | 2.0 | 1.0 | 780 | $1,000 | $1.28 | 13d | 1 | 0.67mi |
| 3722 Burnham Way Panama City, FL | 3.0 | 2.0 | 1040 | $1,600 | $1.54 | 21d | 1 | 0.82mi |
| 4105 W 22nd St Unit 4105 Panama City, FL | 3.0 | 2.0 | 1000 | $1,395 | $1.40 | 21d | 1 | 1.09mi |
| 2100 W Beach Dr Unit F102 Panama City, FL | 2.0 | 1.0 | 970 | $1,700 | $1.75 | 21d | 1 | 1.09mi |
| 4455 W 19th St #17 Panama City, FL | 2.0 | 1.5 | 1104 | $1,400 | $1.27 | 21d | 1 | 1.27mi |
| 4324 W 20th St Panama City, FL | 1.0–3.0 | 1.0–2.5 | 1000 | $1,630 | $1.63 | 13d | 12 | 1.34mi |
| 901 W 19th St Panama City, FL | 1.0–2.0 | 1.0–2.0 | 787 | $1,168 | $1.48 | 21d | 5 | 1.42mi |
Listing history 15 events
-
2026-05-07$99,000 Active 409-char remark
-
2025-07-03soldstatus $62,500
-
2025-06-30soldstatus $62,500 Closed 348-char remark
Show marketing remark (348 chars)
Investor Special!! Great location!! Charming Fixer Upper located in the desirable St. Andrews neighborhood. This home needs major renovations but has tons of potential. Florida Room has damage from a tornado. Large corner lot! Bring your vision and transform this into a fantastic investment! Call your favorite realtor today! Cash only. Sold As-Is
-
2025-06-30soldstatus $62,500 Sold
Show marketing remark (348 chars)
Investor Special!! Great location!! Charming Fixer Upper located in the desirable St. Andrews neighborhood. This home needs major renovations but has tons of potential. Florida Room has damage from a tornado. Large corner lot! Bring your vision and transform this into a fantastic investment! Call your favorite realtor today! Cash only. Sold As-Is
-
2025-06-12historical Active Under Contract 348-char remark
Show marketing remark (349 chars)
Investor Special!! Great location!! Charming Fixer Upper located in the desirable St. Andrews neighborhood. This home needs major renovations but has tons of potential. Florida Room has damage from a tornado. Large corner lot! Bring your vision and transform this into a fantastic investment! Call your favorite realtor today! Cash only. Sold As-Is
-
2025-06-12status Pending
Show marketing remark (349 chars)
Investor Special!! Great location!! Charming Fixer Upper located in the desirable St. Andrews neighborhood. This home needs major renovations but has tons of potential. Florida Room has damage from a tornado. Large corner lot! Bring your vision and transform this into a fantastic investment! Call your favorite realtor today! Cash only. Sold As-Is
-
2025-05-27$72,500 Active 348-char remark
Show marketing remark (348 chars)
Investor Special!! Great location!! Charming Fixer Upper located in the desirable St. Andrews neighborhood. This home needs major renovations but has tons of potential. Florida Room has damage from a tornado. Large corner lot! Bring your vision and transform this into a fantastic investment! Call your favorite realtor today! Cash only. Sold As-Is
-
2025-05-27$72,500 Active
Show marketing remark (348 chars)
Investor Special!! Great location!! Charming Fixer Upper located in the desirable St. Andrews neighborhood. This home needs major renovations but has tons of potential. Florida Room has damage from a tornado. Large corner lot! Bring your vision and transform this into a fantastic investment! Call your favorite realtor today! Cash only. Sold As-Is
-
2021-12-30soldstatus $110,000
-
2021-12-14historical
-
2021-12-02historical
-
2021-11-05$130,000
-
2021-07-19soldstatus $76,500
-
2021-07-08$89,000
-
2008-05-02$99,900
ⓘ Source: listings_history table (triggers on properties + properties_extension) + one-shot
backfill from property_details.listing_events for pre-trigger history.
Tax reassessment forecast FL · Resets to sale price
- Current annual tax
- $1,570 · $131/mo
- Projected year-2 tax
- $1,570 · $131/mo
- Expected delta
- $0/yr ($0/mo · 0.0%)
ⓘ Screening estimate from a state-policy table — verify with the county assessor before closing.
Climate risk First Street
- Flood 1/10 Low FEMA zone X (unshaded) · 0% chance over 30 yrs
- Wildfire 1/10 Low
- Heat 10/10 Extreme 7 d/yr ≥106°F today · 22 d/yr by 30 yrs out
- Wind 9/10 Extreme 99% chance of damaging wind over 30 yrs
- Air quality 1/10 Low 0 unhealthy d/yr today · 0 by 30 yrs out
Nearby sold comps map
Loading sold comps map…
Walkable amenities ~0.75 mi
Loading nearby amenities…
Taxation est. · year 1
- Rental income
- $20,471
- − Mortgage interest
- −$5,546
- − Property taxes
- −$1,570
- − Insurance
- −$495
- − Repairs & maintenance
- −$1,638
- − Management
- −$1,638
- − Depreciation
- −$2,880
- Taxable income
- $6,706
- Est. tax owed @ 24.0%
- −$1,609
- After-tax cash flow
- $6,268/yr
For passive investors: Depreciation is non-cash, so a rental often shows a tax loss while cash-flowing — sheltering income. Rental losses are passive: they offset passive income freely, and up to $25,000/yr can offset ordinary (W-2) income if you actively participate and your MAGI is under $100k (phasing out to $0 by $150k); unused losses carry forward. On sale, claimed depreciation is recaptured at up to 25%, and gains may owe capital-gains tax (a 1031 exchange can defer both). Figures are a year-1 estimate at your 24.0% rate — not tax advice; consult a CPA.
Schools (NCES district)
- District
- Bay
- NCES district ID
- 1200090
- Math proficiency
- 51% ▼ -8.00%
- Reading proficiency
- 51% ▼ -7.00%
- Median HH income
- $47,740
- Composite
- 43.41/100
- National rank
- #3014
- State rank
- #29 of 73 in FL
Livability — Panama City
- Score
- 72/100
- State rank
- #350
- US rank
- #5823
Category grades
Schools grade is shown separately in the Schools card above.
Census & demographics
- Census place
- Panama City, FL
- County
- Bay County · 163,593 people
- City population
- 91,445
- Metro
- Panama City, FL
- Population (ZIP)
- 29,984
- Household income
- $73,373
- Rent vs Own
- Severe rent burden
- 1008.0
Population outlook (Bay County) Hauer SSP2
- Today (2025)
- 206,264 people
- By 2030
- 217,740 · +5.6%
- By 2040
- 238,738 · +15.7%
- By 2050
- 255,545 · +23.9%
- By 2075
- 288,295 · +39.8%
- By 2100
- 288,638 · +39.9%
Race, ethnicity, and origin ACS 2023
- Neighborhood character
- Predominantly White (67%)
- Race & ethnicity
- White 67% Black 17% Two or more races 8% Hispanic / Latino 7% Native American 1%
- Hispanic origin (detail)
- Mexican 2% Puerto Rican 3%
- Common ancestry
- Slovak 4% Lithuanian 2% Romanian 2%
- Foreign-born
- 7% · Canada
- Languages at home
- 89% English-only · Spanish 6% Arabic 1% French/Haitian/Cajun 1%
Political lean MEDSL · Bay
- 2024 margin
- Solid R (+47.4) · D 25.8% · R 73.1% · Other 1.1%
- 2008→2024 swing
- -6.6pp toward R · 2008: -40.7pp · 2024: -47.4pp
- All cycles
- 2024: R+47.4 2020: R+43.5 2016: R+46.3 2012: R+43.6 2008: R+40.7
Not yet ingested
- Civics
- —
Market trends
- HPI YoY
- ▼ -217.88%
- Current HPI
- 262.7854
- Rent YoY
- ▲ 1.24%
- Metro
- Panama City, FL
- State GDP YoY
- ▲ 3.28%
- F500 in state
- 36
Industry mix (Fortune 500 HQ in FL)
| Industry | F500 HQs | Revenue |
|---|---|---|
| Industrial Technology | 2 | $29B |
|
||
| Insurance | 2 | $17B |
|
||
| Retail | 1 | $60B |
|
||
| Technology Distribution | 1 | $58B |
|
||
| Homebuilding | 1 | $35B |
|
||
| Technology Manufacturing | 1 | $35B |
|
||
Price history
-24.9% since first listed17 events — show timeline
- 2026-06-04 Sold (MLS) $75,000 CPARMLS
- 2026-05-25 Pending — CPARMLS
- 2026-05-07 Listed $99,000 CPARMLS
- 2025-07-03 Sold (Public Records) $62,500 Public Records
- 2025-06-30 Sold (MLS) $62,500 CPARMLS
- 2025-06-30 Sold (MLS) $62,500 ECAR
- 2025-06-12 Contingent — CPARMLS
- 2025-06-12 Pending — ECAR
- 2025-05-27 Listed $72,500 CPARMLS
- 2025-05-27 Listed $72,500 ECAR
- 2021-12-30 Sold (Public Records) $110,000 Public Records
- 2021-12-14 Listing Removed — CPARMLS
- 2021-12-02 Listing Removed — CPARMLS
- 2021-11-05 Listed $130,000 CPARMLS
- 2021-07-19 Sold (MLS) $76,500 CPARMLS
- 2021-07-08 Listed $89,000 CPARMLS
- 2008-05-02 Listed $99,900 CPARMLS
Property tax history
+8.5%/yrLatest (2025): $1,570 · +8.3% YoY. Source: county tax records.
Cash-flow waterfall
monthlySold comps — $/sqft
last 12 mo · ≤1 miLoading sold comps…