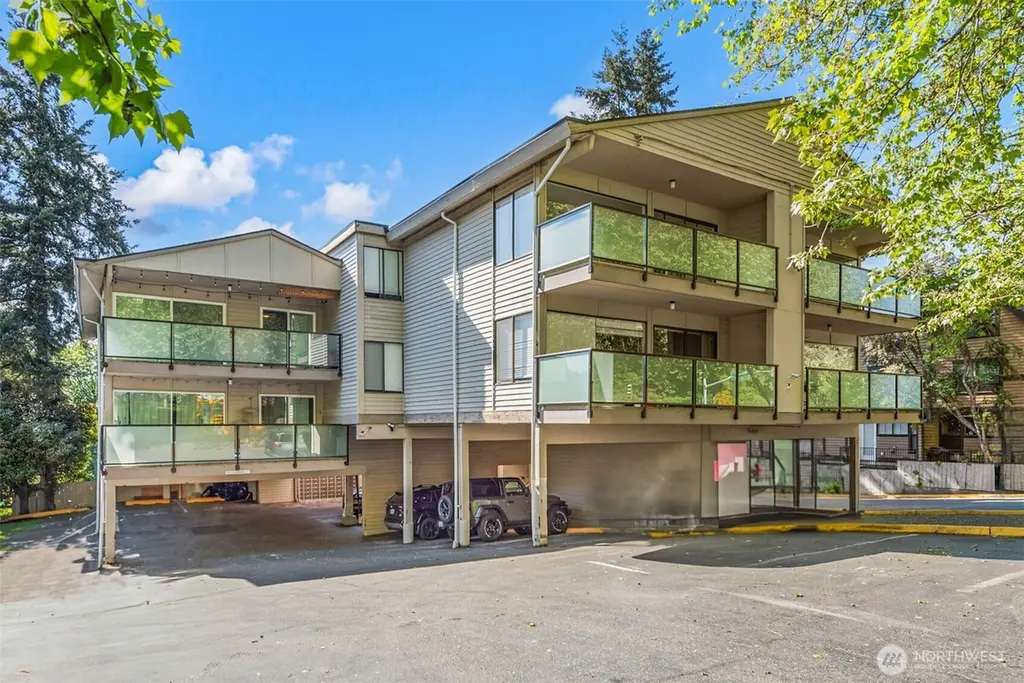
321 Bellevue Way SE #403 · Bellevue, WA
Flood risk 1/10 · Minimal
- FEMA flood zone
- X (unshaded)
- Chance of flooding over 30 yrs
- 0.0%
- Est. flood insurance / yr
- $507 – $1,088
Fire risk 1/10 · Minimal
- Est. fire insurance / yr
- $604 – $1,122
Heat risk 3/10 · Minor
- Hot days now (above 87°F)
- 7 days/yr
- Hot days in 30 yrs
- 15 days/yr
Wind risk 1/10 · Minimal
- Chance of severe wind over 30 yrs
- —
Air-quality risk 7/10 · Major
- Unhealthy air days now
- 10 days/yr
- Unhealthy air days in 30 yrs
- 12 days/yr
Risk factors via First Street. Map © Google.
Why this score? — see what drove the D grade
The composite is a weighted blend of 9 inputs, each scored 0–100. Each bar is that input's sub-score; the figure is the points it added to the 100-point composite (weight × sub-score).
- ARV discount +15.0/15.0
- Schools +6.9/10.0
- Appreciation +4.8/10.0
- Livability +4.4/5.0
- Cash flow +4.2/30.0
- Condition / age +2.5/5.0
- Rent growth +2.4/5.0
- 1% rule +1.1/10.0
- DSCR +0.0/10.0
$468,000
🖨 Deal sheet 📄 Offer letter ✓ Due diligence
Listing remarks
Heart of Downtown Bellevue. City living at its best with this spacious, light filled, top floor home in a quiet and serene setting. A large covered balcony overlooking greenbelt and creek with sunset views and a nice cross breeze through unit. Features include a functional galley kitchen with ample storage, a classic fireplace, elevator access, and a secured storage locker just across the hall. Includes covered parking with ample visitor parking. Walk Score of 89. On the bus line to Downtown Bellevue and Seattle. Recent building-wide upgrades include a newer roof and new plumbing. Modernized walk-in shower. Brand new washer dryer combo. No current special assessment. No rental cap.
Key facts
- Classic fireplace
- Top floor home
- Elevator access
Tags
Property features AI
Finance
- Other: 24 units in the building; Elevator access; Bus lines nearby (routes 550, 556)
- Financial info: Listing terms: Cash or Conventional
- HOA & community: HOA fee of $598.68 monthly; HOA covers common area maintenance, earthquake insurance, lawn service, sewer, trash and water; Association contact: Propvivo - Vivek Khanna; Community amenities include elevator, garden space and laundry room; Pets allowed
Exterior
- Parking: 25 parking spaces in community; 1 covered space; Carport
- Utilities: Electric energy source; Power provided by PSE; Water and sewer provided through HOA; Cable connected (Xfinity)
- Home design: Condominium (one level unit); Brookside building; Built in 1989 (effective); West-facing entry on main level; Located on 4th floor of a 5-story building
- Construction: Wood construction; Composition roof; Condominium structure
- Exterior features: Wood exterior; Balcony/Deck/Patio; Creek waterfront; Curbs, paved and sidewalk access; Open space nearby
Interior
- Kitchen: Dishwasher; Microwave; Refrigerator; Stove/Range
- Bedrooms: 2 bedrooms (both on main level: primary bedroom and one additional bedroom)
- Flooring: Vinyl plank flooring
- Bathrooms: 1 full bathroom (main level) with 1 shower
- Heating & cooling: Baseboard heating; Window cooling unit(s)
- Interior features: Electric cooking; Garbage disposal; Insulated windows; Top-floor unit; Unit has a view
- Laundry & utility: Washer; Dryer; Building laundry room (4th floor); Water heater located on balcony
Neighborhood map
What this means for you Summary
Snapshot
- This is a 2-bed/1.0-bath condo listed at $468k.
Deal economics
- At list price, monthly cash flow is $-1k ($-15k/yr) — negative.
- To cash-flow at today's rent, offer at most $244k (48.0% below list).
- To meet the 1% rule (rent ≥ 1% of price), the offer needs to be $284k (39.3% below list).
- Recommended offer: $244k (48.0% below list) — sets the bar for cash-flow.
- Cap rate 3.0% vs local median 1.1% in Bellevue — top-decile yield for the area; either an underpriced asset or a hidden risk that comps aren't pricing in. Stress-test before assuming the spread holds.
Location & tenants
- Location reads 87/100 on livability (#15 in WA, #314 nationally) — a professional / high-income tenant draw. Strengths: amenities A+, commute A+, employment A+; Watch: cost of living F.
- Bellevue School District (urban): math 73% / reading 79% proficiency, ranked #7 of 291 in WA (top 2%) — strong family-tenant draw, lease renewals of 3-5y typical; only 15% free/reduced lunch — higher-income household profile.
- Zoned schools: Enatai Elementary School (433 students, 20% FRL); Bellevue High School (1,517 students, 15% FRL) — zoned schools at 17% FRL track the district average.
- Market conditions: Rents soft (-0.2%/yr); 350 active listings in the ZIP; 40 comparable units currently listed for rent nearby; rentals leasing fast (median 5d on market — plan ~1-2 weeks tenant-placement turnaround); high-income renter base; 10,555 units permitted in King County in 2024 (7,119 in 5+ unit buildings).
Forward outlook
- In year one you build about $2k of equity ($3k loan paydown + $-2k appreciation (-0.3% local appreciation)).
- King County population projected at +44% by 2050 — long-run rental-demand tailwind backs the buy-and-hold thesis.
- By year 10, paydown + projected appreciation supports a ~$35k cash-out refi (75% LTV) — recoverable capital for the next deal without selling this one.
Negotiation context
- It's been on market 34 days — a 3% lower offer ($454k) is reasonable based on typical stale-listing flexibility.
- 3 sale attempts since 18y ago with the ask held roughly flat each time — persistent listings suggest the price (not the market) is what's stuck; bring a comps-based counter.
- Current owner paid $377k; 24% above their basis — modest negotiation headroom, anchor on the comps not their cost.
Risks & watch-outs
- Watch-outs: HOA is 21% of rent.
Questions for the listing agent
- What do current leases actually rent for vs. the listed asking? Can we see a recent rent roll and the last 12 months of T-12 income?
- It's been on market 34 days. Have you received any prior offers? Is the seller open to a 48% concession, seller financing, or rate buy-down credit?
- Built in 1969 — when were the roof, HVAC, electrical panel, plumbing, and water heater last replaced?
- What does the HOA fee cover, when was the last increase, and are there any pending special assessments or reserve-fund shortfalls?
- Any open or pending special assessments — roof, HVAC, plumbing, elevator, façade? What's the per-unit balance and payoff schedule, and is the seller paying it off at close or rolling it to the buyer?
- Is there a deadline driving the sale (1031 exchange, divorce, estate, relocation)? That informs how much negotiation room exists.
- Schools are A-rated — typically a magnet for longer-tenancy family renters. What's the average tenant stay here, and is there a school-zone premium baked into asking?
- The area grade is low — what's the realistic commute time and amenity access for the typical tenant pool here? Any planned neighborhood developments (good or bad) we should know about?
- What's the average days-on-market for RENTAL listings here right now (not sales)? A rising rental-DOM trend means longer vacancies and softer asking-rent achievability than the comps imply.
- What's the recent tenant-quality profile in this submarket — average credit score on applications, eviction rate, late-payment / NSF rate, and stable-employment percentage? A property-management company in the area should have these aggregated.
- How much new apartment / multifamily construction is in the pipeline within 1–3 miles? Heavy new supply (>2% of stock underway) typically softens rents 12–24 months out; light construction supports rent growth.
Investment metrics
- 1% rule
- 0.61% ✗
- Cap rate
- 3.03%
- Cash-on-cash
- -11.64%
- DSCR
- 0.48
- GRM
- 13.7
CMA / ARV
- ARV (median comp)
- $668,323
- List price
- $468,000
- Delta
- -29.97%
- Verdict
- UNDERPRICED
- Comps
- 20 within 1.0 mi
Projected returns pro-forma
-0.34% appreciation · 0.0% rent growth · sell at horizon
- IRR
- -19.1%
- Equity multiple
- 0.16×
- Total profit
- $-110,113
- Equity at exit
- $128,048
- IRR
- -14.6%
- Equity multiple
- -0.36×
- Total profit
- $-178,205
- Equity at exit
- $147,792
Cash invested: $131,040 (down + closing). Projections, not guarantees.
Landlord ↔ Tenant lean methodology
- Overall (STATE)
- 28 Tenant-Leaning
- State Washington
- 28 Tenant-Leaning · D+8
- County
- — inherits STATE
- City
- — inherits STATE
ZIP-level market 98004
- Home prices YoY
- -0.1%
- Rents YoY
- -0.2%
- Active inventory
- 350
- Price-to-rent
- 13.7×
Monthly cashflow live
- Estimated rent
- $2,840 high interval (Pro) →
- Mortgage (P&I)
- −$2,454
- Tax from tax record
- −$267 /mo · $3,206/yr
- Insurance
- −$195
- HOA
- −$598
- Vacancy / Maint / Mgmt
- −$596
- Net cashflow
- $-1,271
Break-even live
UW: 25.0% down · 7.5% · 30yr · 1.5% tax · 5.0% vac · 8.0% maint · 8.0% mgmt
Financing live
Cash to close
- Down payment
- $117,000
- Closing costs
- $14,040
- Reserves months
- —
- Total cash needed
- —
Loan-product check · same deal, 3 products live
Conventional
25% down · 7.5% · 30yr
- Down + closing
- —
- Monthly P&I
- —
- Monthly cashflow
- —
- DSCR
- —
- Eligible?
- —
Personal DTI + credit; lowest rate.
DSCR
20% down · 8.5% · 30yr
- Down + closing
- —
- Monthly P&I
- —
- Monthly cashflow
- —
- DSCR
- —
- Eligible?
- —
No personal income docs; deal must DSCR.
Hard money
10% down · 12.0% · 12mo
- Down + closing
- —
- Monthly P&I
- —
- Monthly cashflow
- —
- DSCR
- —
- Eligible?
- —
Short-term bridge; refi at stabilization.
Rent comps 40 comps
| Address | Beds | Baths | Sqft | Rent | $/sqft | DOM | Units | Dist |
|---|---|---|---|---|---|---|---|---|
| 417 Bellevue Way SE Unit TH202 Bellevue, WA | 2.0 | 1.0 | 1065 | $2,650 | $2.49 | 43d | 1 | 0.02mi |
| 417 Bellevue Way SE Unit TH402 Bellevue, WA | 2.0 | 1.0 | 1065 | $2,750 | $2.58 | 43d | 1 | 0.02mi |
| 330 102nd Ave SE Bellevue, WA | 2.0 | 1.5 | 950 | $2,795 | $2.94 | 24d | 1 | 0.07mi |
| 433 Bellevue Way SE Bellevue, WA | 1.0–2.0 | 1.0 | 925 | $2,355 | $2.55 | 2d | 4 | 0.07mi |
| 410 102nd Ave SE Bellevue, WA | 2.0 | 2.0 | 895 | $2,650 | $2.96 | 43d | 2 | 0.09mi |
| 324 102nd Ave SE Bellevue, WA | 1.0 | 1.0 | 992 | $2,450 | $2.47 | 10d | 1 | 0.09mi |
| 331 102nd Ave SE Bellevue, WA | 2.0 | 1.5 | 1044 | $2,195 | $2.10 | 21d | 1 | 0.12mi |
| 537 Bellevue Way SE Bellevue, WA | 1.0–3.0 | 1.0–2.0 | 1030 | $2,348 | $2.28 | 7d | 6 | 0.12mi |
| 545 Bellevue Way SE Bellevue, WA | 1.0 | 1.0 | 638 | $1,949 | $3.05 | 2d | 1 | 0.16mi |
| 191 106th Ave SE #2 Bellevue, WA | 2.0 | 1.0 | 979 | $2,495 | $2.55 | 21d | 1 | 0.17mi |
| 550 Bellevue Way SE Bellevue, WA | 1.0 | 1.0 | 725 | $1,950 | $2.69 | 23d | 1 | 0.17mi |
| 10333 Main St Bellevue, WA | 2.0 | 1.0–2.0 | 913 | $4,962 | $5.43 | 1d | 13 | 0.18mi |
| 10226 SE 6th St Bellevue, WA | 1.0 | 1.0 | 700 | $1,732 | $2.48 | 21d | 3 | 0.18mi |
| 136 102nd Ave SE Bellevue, WA | 1.0–2.0 | 1.0–2.0 | 911 | $3,467 | $3.81 | 1d | 4 | 0.18mi |
| 10245 Main St Bellevue, WA | 1.0 | 1.0 | 783 | $2,650 | $3.38 | 4d | 2 | 0.21mi |
| 10575 Main St Bellevue, WA | 3.0 | 1.0–3.0 | 1182 | $4,672 | $3.95 | 1d | 30 | 0.25mi |
| 10022 Meydenbauer Way SE Bellevue, WA | 1.0–2.0 | 1.0 | 775 | $2,195 | $2.83 | 3d | 2 | 0.25mi |
| 10701 Main St Bellevue, WA | 1.0 | 1.0 | 469 | $2,285 | $4.87 | 1d | 6 | 0.28mi |
| 10333 NE 1st St Bellevue, WA | 2.0 | 1.0–2.0 | 907 | $4,235 | $4.67 | 1d | 18 | 0.28mi |
| 10000 Main St #403 Bellevue, WA | 1.0 | 1.5 | 804 | $3,800 | $4.73 | 11d | 1 | 0.30mi |
| 188 Bellevue Way NE Bellevue, WA | 1.0–2.0 | 1.5–2.0 | 1189 | $5,995 | $5.04 | 43d | 2 | 0.33mi |
| 10708 Main St Bellevue, WA | 1.0 | 1.0 | 604 | $2,000 | $3.31 | 24d | 1 | 0.33mi |
| 10001 NE 1st St Bellevue, WA | 2.0 | 1.0–2.0 | 957 | $6,061 | $6.33 | 1d | 9 | 0.33mi |
| 118 107th Ave NE Unit B105 Bellevue, WA | 1.0 | 1.0 | 657 | $2,295 | $3.49 | 2d | 1 | 0.34mi |
| 111 108th Ave NE #411 Bellevue, WA | 1.0 | 1.0 | 718 | $2,200 | $3.06 | 43d | 1 | 0.35mi |
| 250 Bellevue Way NE #812 Bellevue, WA | 1.0–2.0 | 1.0–2.0 | 957 | $3,620 | $3.78 | 1d | 2 | 0.40mi |
| 9906 Lake Washington Blvd NE Bellevue, WA | 1.0 | 1.0 | 600 | $1,795 | $2.99 | 7d | 1 | 0.42mi |
| 10410 NE 2nd St Bellevue, WA | 3.0 | 1.0–2.0 | 1056 | $3,208 | $3.04 | 2d | 1 | 0.43mi |
| 362 Bellevue Way NE Unit 974 Bellevue, WA | 1.0 | 1.0 | 820 | $2,890 | $3.52 | 43d | 1 | 0.45mi |
| 290 106th Pl NE Bellevue, WA | 2.0 | 1.0 | 531 | $2,530 | $4.76 | 2d | 14 | 0.50mi |
| 308 108th Ave NE Bellevue, WA | 1.0 | 1.0 | 651 | $2,539 | $3.90 | 1d | 8 | 0.51mi |
| 35 112th Ave NE Bellevue, WA | 2.0 | 1.0–2.0 | 859 | $5,840 | $6.79 | 1d | 20 | 0.55mi |
| 11115 NE 2nd St Bellevue, WA | 1.0 | 1.0 | 546 | $2,195 | $4.02 | 1d | 6 | 0.58mi |
| 10485 NE 6th St Bellevue, WA | 1.0–3.0 | 1.0–3.5 | 2202 | $16,662 | $7.57 | 1d | 14 | 0.58mi |
| 511 100th Ave NE Bellevue, WA | 1.0 | 1.0 | 638 | $2,300 | $3.61 | 16d | 1 | 0.64mi |
| 317 112th Ave NE Bellevue, WA | 2.0 | 1.0–2.0 | 905 | $4,830 | $5.34 | 1d | 22 | 0.65mi |
| 10640 SE 16th St Unit 3 Bellevue, WA | 2.0 | 1.0 | 720 | $2,095 | $2.91 | 4d | 1 | 0.73mi |
| 10640 SE 16th St Unit 5 Bellevue, WA | 1.0 | 1.0 | 720 | $1,855 | $2.58 | 43d | 1 | 0.73mi |
| 688 110th Ave NE Bellevue, WA | 3.0 | 1.0–3.5 | 2159 | $14,953 | $6.93 | 1d | 23 | 0.75mi |
| 860 100th Ave NE Bellevue, WA | 2.0 | 1.5 | 1021 | $2,395 | $2.35 | 19d | 1 | 0.79mi |
HOA detail condo
- Monthly dues
- $598 · $7,176/yr
- ⚠ Special-assessment mentions
-
…upgrades include a newer roof and new plumbing. Modernized walk-in shower. Brand new washer dryer combo. No current special assessment. No rental cap.
Listing history 24 events
-
2026-06-18days on market $468,000 Active 34 DOM
-
2026-06-17days on market $468,000 Active 33 DOM
-
2026-06-16days on market $468,000 Active 32 DOM
-
2026-06-15days on market $468,000 Active 31 DOM
-
2026-06-13days on market $468,000 Active 29 DOM
-
2026-06-09days on market $468,000 Active 25 DOM
-
2026-06-08days on market $468,000 Active 24 DOM
-
2026-06-07days on market $468,000 Active 23 DOM
-
2026-06-04days on market $468,000 Active 20 DOM
-
2026-06-03days on market $468,000 Active 19 DOM
-
2026-06-02days on market $468,000 Active 18 DOM
-
2026-06-01days on market $468,000 Active 17 DOM
-
2026-05-31days on market $468,000 Active 16 DOM
-
2026-05-15$468,000 Active
-
2017-07-28soldstatus $377,000 Sold
-
2017-07-28soldstatus $377,000
-
2017-07-19status Pending
-
2017-07-11$349,950 Active
-
2008-07-16soldstatus $270,000 Sold
-
2008-07-16soldstatus $270,000
-
2008-06-27historical
-
2008-05-16$279,900
-
1992-01-15soldstatus $79,000
-
1979-10-16soldstatus $47,000
ⓘ Source: listings_history table (triggers on properties + properties_extension) + one-shot
backfill from property_details.listing_events for pre-trigger history.
Tax reassessment forecast WA · Resets to sale price
- Current annual tax
- $3,206 · $267/mo
- Projected year-2 tax
- $4,586 · $382/mo
- Expected delta
- +$1,380/yr (+$115/mo · 43.1%)
ⓘ Screening estimate from a state-policy table — verify with the county assessor before closing.
Climate risk First Street
- Flood 1/10 Low FEMA zone X (unshaded) · 0% chance over 30 yrs
- Wildfire 1/10 Low
- Heat 3/10 Moderate 7 d/yr ≥87°F today · 15 d/yr by 30 yrs out
- Wind 1/10 Low
- Air quality 7/10 Severe 10 unhealthy d/yr today · 12 by 30 yrs out
Nearby sold comps map
Loading sold comps map…
Walkable amenities ~0.75 mi
Loading nearby amenities…
Taxation est. · year 1
- Rental income
- $34,080
- − Mortgage interest
- −$26,215
- − Property taxes
- −$3,206
- − Insurance
- −$2,340
- − Repairs & maintenance
- −$2,726
- − Management
- −$2,726
- − HOA
- −$7,176
- − Depreciation
- −$13,615
- Taxable loss
- −$23,925
- Est. tax savings @ 24.0%
- +$5,742
- After-tax cash flow
- $-9,508/yr
For passive investors: Depreciation is non-cash, so a rental often shows a tax loss while cash-flowing — sheltering income. Rental losses are passive: they offset passive income freely, and up to $25,000/yr can offset ordinary (W-2) income if you actively participate and your MAGI is under $100k (phasing out to $0 by $150k); unused losses carry forward. On sale, claimed depreciation is recaptured at up to 25%, and gains may owe capital-gains tax (a 1031 exchange can defer both). Figures are a year-1 estimate at your 24.0% rate — not tax advice; consult a CPA.
Schools (NCES district)
- District
- Bellevue School District
- NCES district ID
- 5300390
- Math proficiency
- 73% ▼ -2.00%
- Reading proficiency
- 79% ▬ 0.00%
- Median HH income
- $92,676
- Composite
- 69.36/100
- National rank
- #622
- State rank
- #7 of 291 in WA
Livability — Bellevue
- Score
- 87/100
- State rank
- #15
- US rank
- #314
Category grades
Schools grade is shown separately in the Schools card above.
Census & demographics
- Census place
- Bellevue, WA
- County
- King County · 2,251,916 people
- City population
- 156,686
- Metro
- Seattle-Tacoma-Bellevue, WA
- Population (ZIP)
- 39,897
- Household income
- $182,545
- Rent vs Own
- Severe rent burden
- 1961.0
Population outlook (King County) Hauer SSP2
- Today (2025)
- 2,576,485 people
- By 2030
- 2,803,316 · +8.8%
- By 2040
- 3,255,921 · +26.4%
- By 2050
- 3,706,444 · +43.9%
- By 2075
- 4,746,063 · +84.2%
- By 2100
- 5,407,730 · +109.9%
Race, ethnicity, and origin ACS 2023
- Neighborhood character
- Diverse neighborhood (Simpson 0.64)
- Race & ethnicity
- White 45% Asian 40% Two or more races 9% Hispanic / Latino 6% Black 2%
- Hispanic origin (detail)
- Mexican 3%
- Common ancestry
- Italian 3% Romanian 2% Portuguese 2%
- Foreign-born
- 42% · China, Canada, South Korea
- Languages at home
- 56% English-only · Chinese 14% Other Indo-European 9% Other Asian/Pacific 7%
Political lean MEDSL · King
- 2024 margin
- Solid D (+51.7) · D 74.2% · R 22.5% · Other 3.4%
- 2008→2024 swing
- +9.6pp toward D · 2008: 42.1pp · 2024: 51.7pp
- All cycles
- 2024: D+51.7 2020: D+52.7 2016: D+50.4 2012: D+39.9 2008: D+42.1
Not yet ingested
- Civics
- —
Market trends
- HPI YoY
- ▼ -0.34%
- Current HPI
- 405.5569
- Rent YoY
- ▼ -0.24%
- Metro
- Seattle-Tacoma-Bellevue, WA
- State GDP YoY
- ▲ 4.65%
- F500 in state
- 22
Industry mix (Fortune 500 HQ in WA)
| Industry | F500 HQs | Revenue |
|---|---|---|
| Retail | 2 | $269B |
|
||
| Technology / Retail | 1 | $638B |
|
||
| Technology | 1 | $245B |
|
||
| Telecommunications | 1 | $38B |
|
||
| Food / Beverage | 1 | $36B |
|
||
| Automotive / Trucks | 1 | $34B |
|
||
Price history
+895.7% since first listed11 events — show timeline
- 2026-05-15 Listed $468,000 NWMLS as Distributed by MLS Grid
- 2017-07-28 Sold (Public Records) $377,000 Public Records
- 2017-07-28 Sold (MLS) $377,000 NWMLS as Distributed by MLS Grid
- 2017-07-19 Pending — NWMLS as Distributed by MLS Grid
- 2017-07-11 Listed $349,950 NWMLS as Distributed by MLS Grid
- 2008-07-16 Sold (Public Records) $270,000 Public Records
- 2008-07-16 Sold (MLS) $270,000 NWMLS as Distributed by MLS Grid
- 2008-06-27 Delisted — NWMLS as Distributed by MLS Grid
- 2008-05-16 Listed $279,900 NWMLS as Distributed by MLS Grid
- 1992-01-15 Sold (Public Records) $79,000 Public Records
- 1979-10-16 Sold (Public Records) $47,000 Public Records
Property tax history
+4.4%/yrLatest (2025): $3,206 · -25.1% YoY. Source: county tax records.
Cash-flow waterfall
monthlySold comps — $/sqft
last 12 mo · ≤1 miLoading sold comps…