510 1st St · Bernice, OK
Flood risk No data
- FEMA flood zone
- —
- Chance of flooding over 30 yrs
- —
- Est. flood insurance / yr
- —
Fire risk No data
- Est. fire insurance / yr
- —
Heat risk No data
- Hot days now (above threshold)
- —
- Hot days in 30 yrs
- —
Wind risk No data
- Chance of severe wind over 30 yrs
- —
Air-quality risk No data
- Unhealthy air days now
- —
- Unhealthy air days in 30 yrs
- —
Risk factors via First Street. Map © Google.
Why this score? — see what drove the D+ grade
The composite is a weighted blend of 9 inputs, each scored 0–100. Each bar is that input's sub-score; the figure is the points it added to the 100-point composite (weight × sub-score).
- Cash flow +14.2/30.0
- Appreciation +10.0/10.0
- ARV discount +7.5/15.0
- DSCR +4.3/10.0
- 1% rule +4.0/10.0
- Livability +3.0/5.0
- Rent growth +2.5/5.0
- Condition / age +2.5/5.0
- Schools +1.4/10.0
$117,000
🖨 Deal sheet 📄 Offer letter ✓ Due diligence
Listing remarks
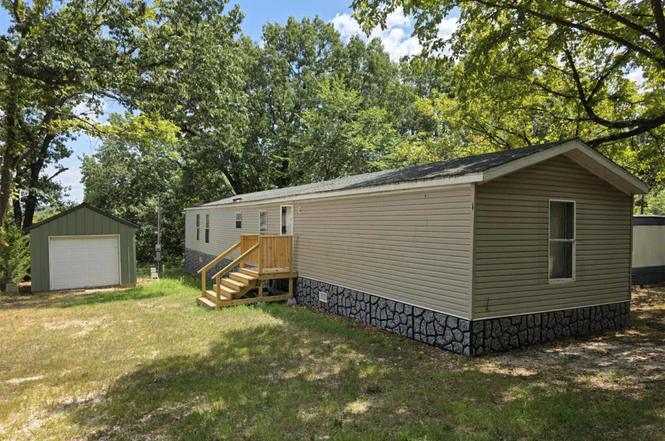
Ready to try out the lake life? This single wide is the perfect get away spot! Minutes from Bernice State park and boat ramp, restaurants and lake entertainment. One block from the water! New kitchen remodel, electric, septic and water in 2023.
Key facts
- Water
- New kitchen remodel
- Septic
Tags
Property features AI
Exterior
- Security: No safety shelter
- Utilities: Electricity available; Public water; Septic tank sewer
- Home design: Single-wide manufactured home; 1 story; North-facing; Tie-down foundation
- Construction: Built by builder; Manufactured construction with vinyl siding; Asphalt/fiberglass roof
- Exterior features: Porch; Storage structure; Corner lot; Mature trees
Interior
- Kitchen: Microwave; Oven; Range; Refrigerator
- Flooring: Carpet; Laminate
- Bathrooms: 2 full bathrooms
- Heating & cooling: Electric heating; Has heating
- Interior features: Ceiling fan(s); Laminate countertops; Vinyl window frames; No additional interior features listed
- Laundry & utility: Electric water heater
Neighborhood map
What this means for you Summary
Snapshot
- This is a 3-bed/2.0-bath manufactured listed at $117k.
Deal economics
- At list price, monthly cash flow is $20 ($243/yr) — positive.
- The deal already cash-flows at list — no discount required.
- To meet the 1% rule (rent ≥ 1% of price), the offer needs to be $105k (10.3% below list).
- Recommended offer: $103k (12.0% below list) — sets the bar for market timing.
Location & tenants
- Location reads 60/100 on livability (#346 in OK) — a middle-class / working-renter tenant base. Strengths: cost of living A+, housing A+; Watch: schools F, amenities F, commute F.
- Afton (rural): math 16% / reading 18% proficiency, ranked #206 of 270 in OK (top 76%) — low school quality limits family demand, transient renter base, plan for 1-2y turnover; 76% free/reduced lunch — lower-income household profile, screen leases tightly.
- Market conditions: 146 active listings in the ZIP; 51 units permitted in Delaware County in 2024 (0 in 5+ unit buildings).
Forward outlook
- In year one you build about $13k of equity ($809 loan paydown + $12k appreciation (10.0% local appreciation)).
- Delaware County population projected to shrink 6% by 2050 — rents likely to lag national; underwrite the cash flow, not the appreciation.
- At projected returns (10.0% appreciation + 3.0% rent growth), your $33k cash investment doubles in ~3 years — after that, you're playing with house money.
- By year 3, paydown + projected appreciation supports a ~$32k cash-out refi (75% LTV) — recoverable capital for the next deal without selling this one.
Negotiation context
- It's been on market 209 days — a 12% lower offer ($103k) is reasonable based on typical stale-listing flexibility.
Questions for the listing agent
- It's been on market 209 days. Have you received any prior offers? Is the seller open to a 12% concession, seller financing, or rate buy-down credit?
- Why hasn't it sold? Are there any deal-killer items the seller is aware of (foundation, flood, title, zoning, code violations)?
- Is there a deadline driving the sale (1031 exchange, divorce, estate, relocation)? That informs how much negotiation room exists.
- Schools are F-rated, which usually means shorter tenancies and higher turnover. Who's the typical renter profile here, and what's been the actual vacancy rate?
- The area grade is low — what's the realistic commute time and amenity access for the typical tenant pool here? Any planned neighborhood developments (good or bad) we should know about?
- What's the average days-on-market for RENTAL listings here right now (not sales)? A rising rental-DOM trend means longer vacancies and softer asking-rent achievability than the comps imply.
- What's the recent tenant-quality profile in this submarket — average credit score on applications, eviction rate, late-payment / NSF rate, and stable-employment percentage? A property-management company in the area should have these aggregated.
- How much new for-sale + rental construction is in the pipeline within 1–3 miles? Heavy new supply typically softens prices + rents 12–24 months out; constrained supply supports both.
Investment metrics
- 1% rule
- 0.90% ✗
- Cap rate
- 6.50%
- Cash-on-cash
- 0.74%
- DSCR
- 1.03
- GRM
- 9.3
CMA / ARV
No comps found within radius.
Projected returns pro-forma
10.0% appreciation · 3.0% rent growth · sell at horizon
- IRR
- 24.8%
- Equity multiple
- 2.98×
- Total profit
- $65,025
- Equity at exit
- $105,403
- IRR
- 21.9%
- Equity multiple
- 6.82×
- Total profit
- $190,507
- Equity at exit
- $227,305
Cash invested: $32,760 (down + closing). Projections, not guarantees.
Landlord ↔ Tenant lean methodology
- Overall (STATE)
- 83 Strongly Landlord-Friendly
- State Oklahoma
- 83 Strongly Landlord-Friendly · R+20
- County
- — inherits STATE
- City
- — inherits STATE
ZIP-level market 74331
- Home prices YoY
- 11.1%
- Active inventory
- 146
- Price-to-rent
- 9.3×
Monthly cashflow live
- Estimated rent
- $1,049 medium interval (Pro) →
- Mortgage (P&I)
- −$614
- Tax est. 1.5%
- −$146 /mo · $1,755/yr
- Insurance
- −$49
- HOA
- −$0
- Vacancy / Maint / Mgmt
- −$220
- Net cashflow
- $20
Break-even live
UW: 25.0% down · 7.5% · 30yr · 1.5% tax · 5.0% vac · 8.0% maint · 8.0% mgmt
Financing live
Cash to close
- Down payment
- $29,250
- Closing costs
- $3,510
- Reserves months
- —
- Total cash needed
- —
Loan-product check · same deal, 3 products live
Conventional
25% down · 7.5% · 30yr
- Down + closing
- —
- Monthly P&I
- —
- Monthly cashflow
- —
- DSCR
- —
- Eligible?
- —
Personal DTI + credit; lowest rate.
DSCR
20% down · 8.5% · 30yr
- Down + closing
- —
- Monthly P&I
- —
- Monthly cashflow
- —
- DSCR
- —
- Eligible?
- —
No personal income docs; deal must DSCR.
Hard money
10% down · 12.0% · 12mo
- Down + closing
- —
- Monthly P&I
- —
- Monthly cashflow
- —
- DSCR
- —
- Eligible?
- —
Short-term bridge; refi at stabilization.
Listing history 16 events
-
2026-06-18price $117,000 Active 209 DOM
-
2026-06-18days on market $147,900 Active 209 DOM
-
2026-06-17days on market $147,900 Active 208 DOM
-
2026-06-16days on market $147,900 Active 207 DOM
-
2026-06-15days on market $147,900 Active 206 DOM
-
2026-06-13days on market $147,900 Active 204 DOM
-
2026-06-12days on market $147,900 Active 203 DOM
-
2026-06-09days on market $147,900 Active 200 DOM
-
2026-06-08days on market $147,900 Active 199 DOM
-
2026-06-08days on market $147,900 Active 198 DOM
-
2026-06-05days on market $147,900 Active 196 DOM
-
2026-06-04days on market $147,900 Active 194 DOM
-
2026-06-02days on market $147,900 Active 193 DOM
-
2026-06-01days on market $147,900 Active 192 DOM
-
2026-05-31days on market $147,900 Active 191 DOM
-
2025-11-21$147,900 Active
ⓘ Source: listings_history table (triggers on properties + properties_extension) + one-shot
backfill from property_details.listing_events for pre-trigger history.
Nearby sold comps map
Loading sold comps map…
Walkable amenities ~0.75 mi
Loading nearby amenities…
Taxation est. · year 1
- Rental income
- $12,589
- − Mortgage interest
- −$6,554
- − Property taxes
- −$1,755
- − Insurance
- −$585
- − Repairs & maintenance
- −$1,007
- − Management
- −$1,007
- − Depreciation
- −$3,404
- Taxable loss
- −$1,723
- Est. tax savings @ 24.0%
- +$413
- After-tax cash flow
- $656/yr
For passive investors: Depreciation is non-cash, so a rental often shows a tax loss while cash-flowing — sheltering income. Rental losses are passive: they offset passive income freely, and up to $25,000/yr can offset ordinary (W-2) income if you actively participate and your MAGI is under $100k (phasing out to $0 by $150k); unused losses carry forward. On sale, claimed depreciation is recaptured at up to 25%, and gains may owe capital-gains tax (a 1031 exchange can defer both). Figures are a year-1 estimate at your 24.0% rate — not tax advice; consult a CPA.
Schools (NCES district)
- District
- Afton
- NCES district ID
- 4002520
- Math proficiency
- 16% ▼ -8.00%
- Reading proficiency
- 18% ▼ -9.00%
- Median HH income
- $37,117
- Composite
- 14.19/100
- National rank
- #9453
- State rank
- #206 of 270 in OK
Livability — Bernice
- Score
- 60/100
- State rank
- #346
- US rank
- #18861
Category grades
Schools grade is shown separately in the Schools card above.
Census & demographics
- Census place
- Bernice, OK
- Population (ZIP)
- 7,110
Population outlook (Delaware County) Hauer SSP2
- Today (2025)
- 41,302 people
- By 2030
- 40,888 · -1.0%
- By 2040
- 39,802 · -3.6%
- By 2050
- 38,839 · -6.0%
- By 2075
- 37,438 · -9.4%
- By 2100
- 34,910 · -15.5%
Race, ethnicity, and origin ACS 2023
- Neighborhood character
- Predominantly White (71%)
- Race & ethnicity
- White 71% Native American 14% Two or more races 12% Hispanic / Latino 2%
- Common ancestry
- Italian 3% Slovak 2% Serbian 2%
- Foreign-born
- 1% · Canada
Political lean MEDSL · Delaware
- 2024 margin
- Solid R (+60.4) · D 19.2% · R 79.6% · Other 1.2%
- 2008→2024 swing
- -26.6pp toward R · 2008: -33.8pp · 2024: -60.4pp
- All cycles
- 2024: R+60.4 2020: R+58.5 2016: R+54.1 2012: R+41.3 2008: R+33.8
Not yet ingested
- Civics
- —
Market trends
- HPI YoY
- ▲ 32.91%
- Current HPI
- 329.9447
- Rent YoY
- —
- Metro
- —
- State GDP YoY
- ▲ 1.55%
- F500 in state
- 6
Industry mix (Fortune 500 HQ in OK)
| Industry | F500 HQs | Revenue |
|---|---|---|
| Energy | 3 | $48B |
|
||
Price history
1 event — show timeline
- 2025-11-21 Listed $147,900 MLS Technology, Inc.
Cash-flow waterfall
monthlySold comps — $/sqft
last 12 mo · ≤1 miLoading sold comps…