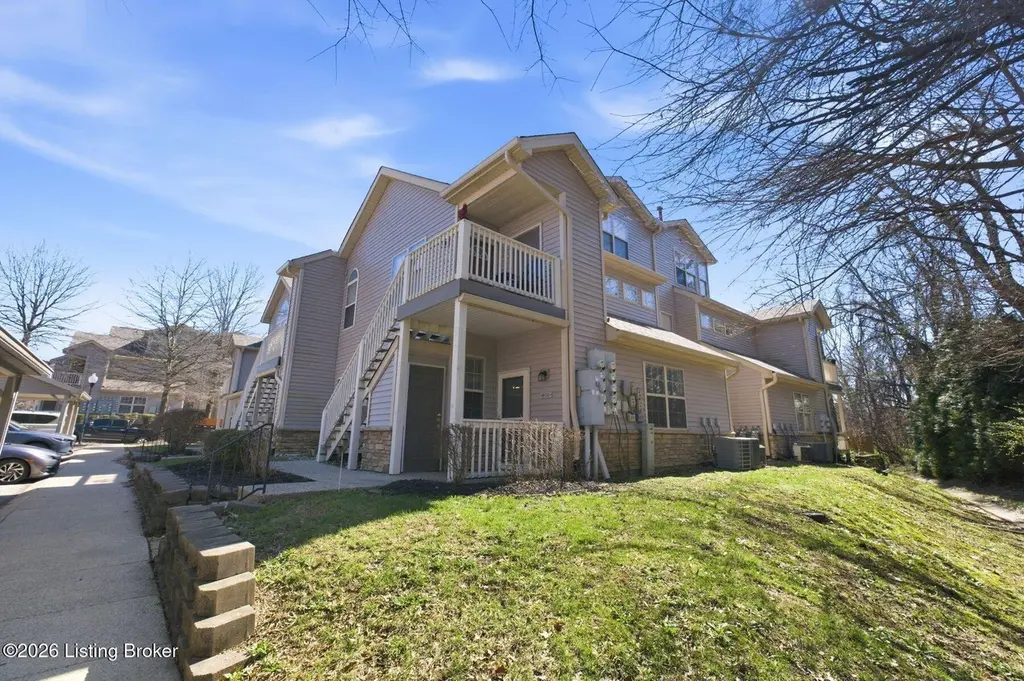
13410 Prospect Glen Way · River Bluff, KY
Flood risk 1/10 · Minimal
- FEMA flood zone
- X (unshaded)
- Chance of flooding over 30 yrs
- 0.0%
- Est. flood insurance / yr
- $507 – $1,088
Fire risk 1/10 · Minimal
- Est. fire insurance / yr
- $839 – $1,559
Heat risk 5/10 · Moderate
- Hot days now (above 104°F)
- 7 days/yr
- Hot days in 30 yrs
- 20 days/yr
Wind risk 2/10 · Minimal
- Chance of severe wind over 30 yrs
- 2.0%
Air-quality risk 3/10 · Minor
- Unhealthy air days now
- 2 days/yr
- Unhealthy air days in 30 yrs
- 4 days/yr
Risk factors via First Street. Map © Google.
Why this score? — see what drove the C- grade
The composite is a weighted blend of 9 inputs, each scored 0–100. Each bar is that input's sub-score; the figure is the points it added to the 100-point composite (weight × sub-score).
- Cash flow +18.1/30.0
- ARV discount +9.4/15.0
- DSCR +5.7/10.0
- Schools +4.7/10.0
- 1% rule +4.5/10.0
- Rent growth +3.7/5.0
- Livability +3.3/5.0
- Condition / age +2.5/5.0
- Appreciation +0.0/10.0
$194,500
🖨 Deal sheet 📄 Offer letter ✓ Due diligence
Listing remarks
Updated, first-floor, corner unit condo within desirable North Oldham County school district. Located just minutes from Prospect's best restaurants, shopping, and schools, this unit offers a low maintenance lifestyle with convenient single-floor living. Featuring new luxury vinyl plank flooring and fresh paint throughout, this condo is truly move-in ready. The kitchen offers ample cabinet and counter space, and opens to the dining and living areas. Includes washer and dryer. The primary bedroom features a walk-in closet and oversized en-suite bathroom. Enjoy the private patio with additional storage. Parking includes a covered carport. Pets are welcome in this community.
Key facts
- Fresh paint
- Walk-in closet
- First-floor
Tags
Property features AI
Finance
- Other: Building has 3 floors and 63 condo units in the complex; Laundry located in unit and rentals are allowed in the subdivision; Subdivision: Prospect Glen; Directions: US-42 to Ridgemoor Dr to street.
- HOA & community: HOA/association applies; Association amenities include storage; Association fee covers exterior maintenance, groundskeeping, master insurance, snow removal, and trash; Association fee applies
Exterior
- Parking: Detached assigned parking (1 space); Surface parking available (1 surface space in subdivision)
- Utilities: Electricity connected; Natural gas available
- Home design: Condominium; One-story unit; Located on level 1; Architectural style: Other
- Construction: Built in 2004; Vinyl siding, wood frame with stone veneer; Shingle roof; Slab foundation
- Exterior features: Cleared, level lot; Storm sewer; Covenants/restrictions apply; No fencing
Interior
- Kitchen: Kitchen located on the first floor
- Bedrooms: 2 bedrooms, both on the first floor (primary bedroom on the first floor)
- Bathrooms: 2 full bathrooms, both on the first floor
- Heating & cooling: Forced air heating (natural gas); Central air conditioning
- Interior features: Great room; Total of 7 rooms; No basement
- Laundry & utility: In-unit laundry on the first floor
Neighborhood map
What this means for you Summary
Snapshot
- This is a 2-bed/2.0-bath condo listed at $194k.
Deal economics
- At list price, monthly cash flow is $172 ($2k/yr) — positive.
- The deal already cash-flows at list — no discount required.
- To meet the 1% rule (rent ≥ 1% of price), the offer needs to be $185k (4.7% below list).
- Recommended offer: $185k (4.7% below list) — sets the bar for 1% rule.
Location & tenants
- Location reads 66/100 on livability (#242 in KY) — a middle-class / working-renter tenant base. Strengths: crime A+, employment A+, housing A+; Watch: amenities F, commute F, health & safety F.
- Oldham County (suburban): math 48% / reading 55% proficiency, ranked #6 of 165 in KY (top 4%) — acceptable for families but not a draw, mixed tenant base, ~2y average lease; only 16% free/reduced lunch — higher-income household profile.
- Market conditions: Rents rising fast (+4.8%/yr); 242 active listings in the ZIP; 1 comparable units currently listed for rent nearby; high-income renter base; 402 units permitted in Oldham County in 2024 (56 in 5+ unit buildings).
- This rent is only 15% of the median local income ($153k/yr) — well below the 30% rent-burden line; pricing power to push rent on renewal without tenant pushback.
Forward outlook
- Local home prices are declining (-3.0%/yr); year-one equity from $1k of loan paydown is wiped out by about $6k of value loss. Plan a longer hold.
- Oldham County population projected at +32% by 2050 — long-run rental-demand tailwind backs the buy-and-hold thesis.
Negotiation context
- Only 3 days on market — expect competitive offers; lowballing is unlikely to land.
- 4 sale attempts since 22y ago with the ask held roughly flat each time — persistent listings suggest the price (not the market) is what's stuck; bring a comps-based counter.
Risks & watch-outs
- Climate carrying-cost: extreme-heat days projected 7→20/yr by 2055 (HVAC capex compounding) — expect insurance premiums to compound above CPI over the hold.
Questions for the listing agent
- What does the HOA fee cover, when was the last increase, and are there any pending special assessments or reserve-fund shortfalls?
- Any open or pending special assessments — roof, HVAC, plumbing, elevator, façade? What's the per-unit balance and payoff schedule, and is the seller paying it off at close or rolling it to the buyer?
- Is there a deadline driving the sale (1031 exchange, divorce, estate, relocation)? That informs how much negotiation room exists.
- What's the average days-on-market for RENTAL listings here right now (not sales)? A rising rental-DOM trend means longer vacancies and softer asking-rent achievability than the comps imply.
- What's the recent tenant-quality profile in this submarket — average credit score on applications, eviction rate, late-payment / NSF rate, and stable-employment percentage? A property-management company in the area should have these aggregated.
- How much new apartment / multifamily construction is in the pipeline within 1–3 miles? Heavy new supply (>2% of stock underway) typically softens rents 12–24 months out; light construction supports rent growth.
Investment metrics
- 1% rule
- 0.95% ✗
- Cap rate
- 7.35%
- Cash-on-cash
- 3.78%
- DSCR
- 1.17
- GRM
- 8.7
CMA / ARV
- ARV (median comp)
- $203,114
- List price
- $194,500
- Delta
- -4.24%
- Verdict
- FAIR
- Comps
- 18 within 1.0 mi
Projected returns pro-forma
-3.0% appreciation · 4.81% rent growth · sell at horizon
- IRR
- -8.4%
- Equity multiple
- 0.69×
- Total profit
- $-17,147
- Equity at exit
- $29,001
- IRR
- 3.2%
- Equity multiple
- 1.25×
- Total profit
- $13,775
- Equity at exit
- $16,817
Cash invested: $54,460 (down + closing). Projections, not guarantees.
Landlord ↔ Tenant lean methodology
- Overall (STATE)
- 83 Strongly Landlord-Friendly
- State Kentucky
- 83 Strongly Landlord-Friendly · R+16
- County
- — inherits STATE
- City
- — inherits STATE
ZIP-level market 40059
- Rents YoY
- 4.8%
- Active inventory
- 242
- Price-to-rent
- 8.7×
Monthly cashflow live
- Estimated rent
- $1,854 medium interval (Pro) →
- Mortgage (P&I)
- −$1,020
- Tax from tax record
- −$168 /mo · $2,019/yr
- Insurance
- −$81
- HOA
- −$24
- Vacancy / Maint / Mgmt
- −$389
- Net cashflow
- $172
Break-even live
UW: 25.0% down · 7.5% · 30yr · 1.5% tax · 5.0% vac · 8.0% maint · 8.0% mgmt
Financing live
Cash to close
- Down payment
- $48,625
- Closing costs
- $5,835
- Reserves months
- —
- Total cash needed
- —
Loan-product check · same deal, 3 products live
Conventional
25% down · 7.5% · 30yr
- Down + closing
- —
- Monthly P&I
- —
- Monthly cashflow
- —
- DSCR
- —
- Eligible?
- —
Personal DTI + credit; lowest rate.
DSCR
20% down · 8.5% · 30yr
- Down + closing
- —
- Monthly P&I
- —
- Monthly cashflow
- —
- DSCR
- —
- Eligible?
- —
No personal income docs; deal must DSCR.
Hard money
10% down · 12.0% · 12mo
- Down + closing
- —
- Monthly P&I
- —
- Monthly cashflow
- —
- DSCR
- —
- Eligible?
- —
Short-term bridge; refi at stabilization.
Rent comps 1 comps
| Address | Beds | Baths | Sqft | Rent | $/sqft | DOM | Units | Dist |
|---|---|---|---|---|---|---|---|---|
| 13202 Prospect Glen Way Prospect, KY | 2.0 | 2.0 | 848 | $1,450 | $1.71 | 21d | 1 | 0.05mi |
HOA detail condo
- Monthly dues
- $24 · $288/yr
- Assessments
- None detected in remarks — confirm with the listing agent.
Listing history 18 events
-
2026-06-18days on market $194,500 Active 3 DOM
-
2026-06-17days on market $194,500 Active 2 DOM
-
2026-06-16statusdays on market $194,500 Active 1 DOM
-
2026-06-07statusdays on market $194,500 Pending 25 DOM
-
2026-06-05days on market $194,500 Active 23 DOM
-
2026-06-03days on market $194,500 Active 22 DOM
-
2026-06-02days on market $194,500 Active 21 DOM
-
2026-06-01days on market $194,500 Active 20 DOM
-
2026-05-31days on market $194,500 Active 19 DOM
-
2026-05-12$194,500 Active 679-char remark
-
2014-04-04soldstatus $275,000
-
2011-03-10soldstatus $81,000
-
2011-02-03historical
-
2010-08-03historical
-
2010-08-03$95,000
-
2010-07-21$89,900
-
2004-04-27soldstatus $110,000
-
2004-02-20$110,000
ⓘ Source: listings_history table (triggers on properties + properties_extension) + one-shot
backfill from property_details.listing_events for pre-trigger history.
Tax reassessment forecast KY · Resets to sale price
- Current annual tax
- $2,019 · $168/mo
- Projected year-2 tax
- $2,019 · $168/mo
- Expected delta
- $0/yr ($0/mo · 0.0%)
ⓘ Screening estimate from a state-policy table — verify with the county assessor before closing.
Climate risk First Street
- Flood 1/10 Low FEMA zone X (unshaded) · 0% chance over 30 yrs
- Wildfire 1/10 Low
- Heat 5/10 Major 7 d/yr ≥104°F today · 20 d/yr by 30 yrs out
- Wind 2/10 Low 2% chance of damaging wind over 30 yrs
- Air quality 3/10 Moderate 2 unhealthy d/yr today · 4 by 30 yrs out
Nearby sold comps map
Loading sold comps map…
Walkable amenities ~0.75 mi
Loading nearby amenities…
Taxation est. · year 1
- Rental income
- $22,252
- − Mortgage interest
- −$10,895
- − Property taxes
- −$2,019
- − Insurance
- −$972
- − Repairs & maintenance
- −$1,780
- − Management
- −$1,780
- − HOA
- −$288
- − Depreciation
- −$5,658
- Taxable loss
- −$1,140
- Est. tax savings @ 24.0%
- +$274
- After-tax cash flow
- $2,334/yr
For passive investors: Depreciation is non-cash, so a rental often shows a tax loss while cash-flowing — sheltering income. Rental losses are passive: they offset passive income freely, and up to $25,000/yr can offset ordinary (W-2) income if you actively participate and your MAGI is under $100k (phasing out to $0 by $150k); unused losses carry forward. On sale, claimed depreciation is recaptured at up to 25%, and gains may owe capital-gains tax (a 1031 exchange can defer both). Figures are a year-1 estimate at your 24.0% rate — not tax advice; consult a CPA.
Schools (NCES district)
- District
- Oldham County
- NCES district ID
- 2104530
- Math proficiency
- 48% ▼ -15.00%
- Reading proficiency
- 55% ▼ -14.00%
- Median HH income
- $84,329
- Composite
- 47.29/100
- National rank
- #2303
- State rank
- #6 of 165 in KY
Livability — River Bluff
- Score
- 66/100
- State rank
- #242
- US rank
- #11821
Category grades
Schools grade is shown separately in the Schools card above.
Census & demographics
- County
- Jefferson County · 790,184 people
- Metro
- Louisville/Jefferson County, KY-IN
- Population (ZIP)
- 20,892
- Household income
- $152,727
- Rent vs Own
- Severe rent burden
- 255.0
Population outlook (Oldham County) Hauer SSP2
- Today (2025)
- 75,661 people
- By 2030
- 80,948 · +7.0%
- By 2040
- 90,894 · +20.1%
- By 2050
- 100,168 · +32.4%
- By 2075
- 123,605 · +63.4%
- By 2100
- 133,523 · +76.5%
Race, ethnicity, and origin ACS 2023
- Neighborhood character
- Predominantly White (86%)
- Race & ethnicity
- White 86% Asian 4% Two or more races 4% Black 4% Hispanic / Latino 2%
- Common ancestry
- Slovak 4% Italian 3% Romanian 2%
- Foreign-born
- 8% · Canada, China
- Languages at home
- 93% English-only · Other Indo-European 3% Chinese 1% Spanish 1%
Political lean MEDSL · Oldham
- 2024 margin
- Strong R (+22.6) · D 37.7% · R 60.3% · Other 2.0%
- 2008→2024 swing
- +8.1pp toward D · 2008: -30.7pp · 2024: -22.6pp
- All cycles
- 2024: R+22.6 2020: R+21.4 2016: R+31.1 2012: R+36.6 2008: R+30.7
Not yet ingested
- Civics
- —
Market trends
- HPI YoY
- ▼ -159.22%
- Current HPI
- 229.5964
- Rent YoY
- ▲ 4.81%
- Metro
- Louisville/Jefferson County, KY-IN
- State GDP YoY
- ▲ 1.81%
- F500 in state
- 4
Industry mix (Fortune 500 HQ in KY)
| Industry | F500 HQs | Revenue |
|---|---|---|
| Healthcare | 1 | $118B |
|
||
| Food / Beverage | 1 | $7B |
|
||
Price history
+76.8% since first listed9 events — show timeline
- 2026-06-15 Listed $194,500 Metro Search MLS
- 2014-04-04 Sold (Public Records) $275,000 Public Records
- 2011-03-10 Sold (Public Records) $81,000 Public Records
- 2011-02-03 Listing Removed — Metro Search MLS
- 2010-08-03 Listed $95,000 Metro Search MLS
- 2010-08-03 Listing Removed — Metro Search MLS
- 2010-07-21 Listed $89,900 Metro Search MLS
- 2004-04-27 Sold (MLS) $110,000 Metro Search MLS
- 2004-02-20 Listed $110,000 Metro Search MLS
Property tax history
+5.9%/yrLatest (2025): $2,019 · +0.1% YoY. Source: county tax records.
Cash-flow waterfall
monthlySold comps — $/sqft
last 12 mo · ≤1 miLoading sold comps…