 Triplex
818 E 18th St · Oakland, CA
Flood risk 1/10 · Minimal
- FEMA flood zone
- X (unshaded)
- Chance of flooding over 30 yrs
- 0.0%
- Est. flood insurance / yr
- $507 – $1,088
Fire risk 1/10 · Minimal
- Est. fire insurance / yr
- $659 – $1,223
Heat risk 3/10 · Minor
- Hot days now (above 84°F)
- 7 days/yr
- Hot days in 30 yrs
- 15 days/yr
Wind risk 1/10 · Minimal
- Chance of severe wind over 30 yrs
- —
Air-quality risk 8/10 · Major
- Unhealthy air days now
- 14 days/yr
- Unhealthy air days in 30 yrs
- 14 days/yr
Risk factors via First Street. Map © Google.
Why this score? — see what drove the B+ grade
The composite is a weighted blend of 9 inputs, each scored 0–100. Each bar is that input's sub-score; the figure is the points it added to the 100-point composite (weight × sub-score).
- Cash flow +30.0/30.0
- ARV discount +15.0/15.0
- 1% rule +10.0/10.0
- DSCR +10.0/10.0
- Livability +3.6/5.0
- Rent growth +3.3/5.0
- Schools +3.0/10.0
- Condition / age +2.5/5.0
- Appreciation +0.0/10.0
$499,000
🖨 Deal sheet 📄 Offer letter ✓ Due diligence
Multi-family units
County records classify this as Multi-Family (2-4 Unit). Listing-text estimate: 3 units. confirmed
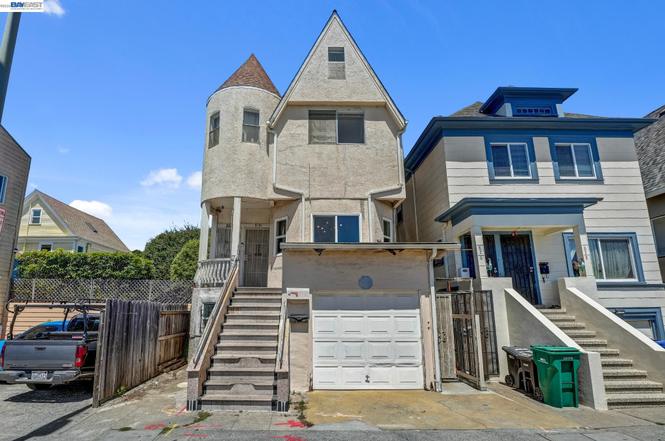
Listing remarks
818 E18th Street brings classic Oakland character, flexible multi-unit living, and rare usable space into one interesting property. From the street, the home has that unmistakable old-Oakland Victorian presence, the kind of charm you do not see replicated in newer construction. Inside, the property is laid out with two main residential units plus a ground-level flex space behind the garage, giving the next owner ways to use, occupy, or explore its potential. The upper unit, 816, is a bright 2-bedroom, 1-bath residence with durable white oak finish hard-flooring, clean countertops, honeycomb tile backsplash, stainless steel stove, bistro-style hood, wood floating shelves, and an eat-in kitch
Key facts
- Communal backyard
- Private balcony
- Laundry setup
Tags
Property features AI
Finance
- Other: Building area approximately 2,708 square feet
- Financial info: 3 total units
Exterior
- Parking: Attached parking; 1 parking space total
- Utilities: Public water; Public sewer
- Home design: Residential income property (Triplex); Built in 1895
- Construction: Stucco construction
- Exterior features: Back yard; Balcony/Patio; Fenced; Level, rectangular lot
Interior
- Flooring: Tile; Vinyl; Carpet
- Bathrooms: Unit 1 has 1 bathroom; Unit 2 has 2 bathrooms; Unit 3 has 2 bathrooms
- Heating & cooling: Has heating; No air conditioning
- Interior features: Storage
Neighborhood map
What this means for you Summary
Snapshot
- This is a 3 × 3-bed/1.7-bath units multifamily listed at $499k.
Deal economics
- At list price, monthly cash flow is $2k ($29k/yr) — positive. Per door: $793/mo.
- The deal already cash-flows at list — no discount required.
- Meets the 1% rule at list price ($8k rent vs $499k).
- Cap rate 12.0% vs local median 2.4% in Oakland — top-decile yield for the area; either an underpriced asset or a hidden risk that comps aren't pricing in. Stress-test before assuming the spread holds.
Location & tenants
- Location reads 71/100 on livability (#224 in CA) — a middle-class / working-renter tenant base. Strengths: amenities A+, commute A+, employment A+; Watch: schools C-, crime F, cost of living F.
- Oakland Unified (urban): math 27% / reading 33% proficiency, ranked #1,007 of 1,400 in CA (top 72%) — families likely to look elsewhere, expect single-tenant / working-renter base with shorter leases; 68% free/reduced lunch — lower-income household profile, screen leases tightly.
- Market conditions: Rents rising (+3.2%/yr); 133 active listings in the ZIP; 4 comparable units currently listed for rent nearby; rentals leasing fast (median 5d on market — plan ~1-2 weeks tenant-placement turnaround); solid renter incomes; 1,742 units permitted in Alameda County in 2024 (856 in 5+ unit buildings).
- At $7,576/mo this rent would consume 96% of the median local household income ($95k/yr) (locally 2002% of renters already pay >50% of income on rent) — very limited rent-growth headroom before tenants either downsize or default.
Forward outlook
- Local home prices are declining (-3.0%/yr); year-one equity from $3k of loan paydown is wiped out by about $15k of value loss. Plan a longer hold.
- Alameda County population projected at +34% by 2050 — long-run rental-demand tailwind backs the buy-and-hold thesis.
- At projected returns (-3.0% appreciation + 3.2% rent growth), your $140k cash investment doubles in ~6 years — after that, you're playing with house money.
Negotiation context
- Only 1 days on market — expect competitive offers; lowballing is unlikely to land.
- 2 sale attempts since 20y ago with the ask held roughly flat each time — persistent listings suggest the price (not the market) is what's stuck; bring a comps-based counter.
- Current owner paid $152k; list at $499k implies a 228% gain — meaningful room to come down on a strong offer.
Risks & watch-outs
- Watch-outs: built in 1895 — expect roof / HVAC / electrical / plumbing capex.
Questions for the listing agent
- Can we see the unit-by-unit rent roll, current vacancy, and any below-market leases? What's the average tenancy length?
- What capital expenditures (roof, boiler, parking lot, exteriors) have been made in the last 5 years, and what's planned in the next 2?
- Built in 1895 — when were the roof, HVAC, electrical panel, plumbing, and water heater last replaced?
- Is there a deadline driving the sale (1031 exchange, divorce, estate, relocation)? That informs how much negotiation room exists.
- Crime grade is F in this area — have there been break-ins, vandalism, or insurance claims at this property in the last 3 years? What carrier currently insures it and at what premium?
- What's the average days-on-market for RENTAL listings here right now (not sales)? A rising rental-DOM trend means longer vacancies and softer asking-rent achievability than the comps imply.
- What's the recent tenant-quality profile in this submarket — average credit score on applications, eviction rate, late-payment / NSF rate, and stable-employment percentage? A property-management company in the area should have these aggregated.
- How much new apartment / multifamily construction is in the pipeline within 1–3 miles? Heavy new supply (>2% of stock underway) typically softens rents 12–24 months out; light construction supports rent growth.
Investment metrics
- 1% rule
- 1.52% ✓
- Cap rate
- 12.01%
- Cash-on-cash
- 20.43%
- DSCR
- 1.91
- GRM
- 5.5
CMA / ARV
- ARV (on-the-fly)
- $732,270
- Comps found
- 3
Show comp detail 3 sales within ~0.75 mi
| Address | Dist | Beds/Ba | Sqft | Sold | Price | $/sf | Match |
|---|---|---|---|---|---|---|---|
| 2141 11th Ave | 0.30mi | 4/2.0 (-1) | 1,702 (-10%) | 6mo | $540,000 | $317 | 54 |
| 2020 17th Ave | 0.54mi | 6/3.0 (+1) | 2,000 (+5%) | 11mo | $800,000 | $400 | 52 |
| 1829 E 22nd St | 0.66mi | 4/4.0 (-1) | 1,664 (-12%) | 1mo | $640,000 | $385 | 39 |
Match score weights: distance 35% · size 25% · config 20% · recency 20%. Top-matched comps best support the ARV.
Projected returns pro-forma
-3.0% appreciation · 3.24% rent growth · sell at horizon
- IRR
- 13.0%
- Equity multiple
- 1.52×
- Total profit
- $72,708
- Equity at exit
- $74,403
- IRR
- 22.1%
- Equity multiple
- 2.91×
- Total profit
- $266,842
- Equity at exit
- $43,144
Cash invested: $139,720 (down + closing). Projections, not guarantees.
Landlord ↔ Tenant lean methodology
- Overall (CITY)
- 0 Strongly Tenant-Friendly
- State California
- 18 Strongly Tenant-Friendly · D+13
- County
- — inherits STATE
- City Oakland
- 0 Strongly Tenant-Friendly · D+62
ZIP-level market 94607
- Rents YoY
- 3.2%
- Active inventory
- 133
- Price-to-rent
- 16.5×
Monthly cashflow live
- Estimated rent
- $7,576 high interval (Pro) →
- Mortgage (P&I)
- −$2,617
- Tax from tax record
- −$781 /mo · $9,375/yr
- Insurance
- −$208
- HOA
- −$0
- Vacancy / Maint / Mgmt
- −$1,591
- Net cashflow
- $2,379
Break-even live
3-unit breakdown (identical units grouped — click to expand)
| Units | Beds | Baths | Est. rent |
|---|---|---|---|
| 3× units | 3 | 1.7 | $7,575 |
| #1 | 3 | 1.7 | $2,525 |
| #2 | 3 | 1.7 | $2,525 |
| #3 | 3 | 1.7 | $2,525 |
| Total (3 units) | $7,576 | ||
UW: 25.0% down · 7.5% · 30yr · 1.5% tax · 5.0% vac · 8.0% maint · 8.0% mgmt
Financing live
Cash to close
- Down payment
- $124,750
- Closing costs
- $14,970
- Reserves months
- —
- Total cash needed
- —
Loan-product check · same deal, 3 products live
Conventional
25% down · 7.5% · 30yr
- Down + closing
- —
- Monthly P&I
- —
- Monthly cashflow
- —
- DSCR
- —
- Eligible?
- —
Personal DTI + credit; lowest rate.
DSCR
20% down · 8.5% · 30yr
- Down + closing
- —
- Monthly P&I
- —
- Monthly cashflow
- —
- DSCR
- —
- Eligible?
- —
No personal income docs; deal must DSCR.
Hard money
10% down · 12.0% · 12mo
- Down + closing
- —
- Monthly P&I
- —
- Monthly cashflow
- —
- DSCR
- —
- Eligible?
- —
Short-term bridge; refi at stabilization.
Rent comps 4 comps
| Address | Beds | Baths | Sqft | Rent | $/sqft | DOM | Units | Dist |
|---|---|---|---|---|---|---|---|---|
| 2203 8th Ave Unit 2 Oakland, CA | 4.0 | 2.0 | 1300 | $3,100 | $2.38 | 4d | 1 | 0.27mi |
| 2422 E 24th St Unit 1 Oakland, CA | 5.0 | 1.0 | 2364 | $3,500 | $1.48 | 43d | 1 | 1.20mi |
| 2900 Sheffield Ave Oakland, CA | 4.0 | 2.0 | 1692 | $7,000 | $4.14 | 3d | 1 | 1.40mi |
| 1950 Broadway Oakland, CA | 4.0 | 1.0–2.0 | 737 | $6,907 | $9.37 | 1d | 53 | 1.46mi |
Listing history 2 events
-
2026-06-18remarks 699-char remark
-
2026-06-18$499,000 Active 1 DOM
ⓘ Source: listings_history table (triggers on properties + properties_extension) + one-shot
backfill from property_details.listing_events for pre-trigger history.
Tax reassessment forecast CA · Resets to sale price
- Current annual tax
- $9,375 · $781/mo
- Projected year-2 tax
- $9,375 · $781/mo
- Expected delta
- $0/yr ($0/mo · 0.0%)
ⓘ Screening estimate from a state-policy table — verify with the county assessor before closing.
Climate risk First Street
- Flood 1/10 Low FEMA zone X (unshaded) · 0% chance over 30 yrs
- Wildfire 1/10 Low
- Heat 3/10 Moderate 7 d/yr ≥84°F today · 15 d/yr by 30 yrs out
- Wind 1/10 Low
- Air quality 8/10 Severe 14 unhealthy d/yr today · 14 by 30 yrs out
Nearby sold comps map
Loading sold comps map…
Walkable amenities ~0.75 mi
Loading nearby amenities…
Taxation est. · year 1
- Rental income
- $90,912
- − Mortgage interest
- −$27,952
- − Property taxes
- −$9,375
- − Insurance
- −$2,495
- − Repairs & maintenance
- −$7,273
- − Management
- −$7,273
- − Depreciation
- −$14,516
- Taxable income
- $22,028
- Est. tax owed @ 24.0%
- −$5,287
- After-tax cash flow
- $23,262/yr
For passive investors: Depreciation is non-cash, so a rental often shows a tax loss while cash-flowing — sheltering income. Rental losses are passive: they offset passive income freely, and up to $25,000/yr can offset ordinary (W-2) income if you actively participate and your MAGI is under $100k (phasing out to $0 by $150k); unused losses carry forward. On sale, claimed depreciation is recaptured at up to 25%, and gains may owe capital-gains tax (a 1031 exchange can defer both). Figures are a year-1 estimate at your 24.0% rate — not tax advice; consult a CPA.
Schools (NCES district)
- District
- Oakland Unified
- NCES district ID
- 0628050
- Math proficiency
- 27% ▬ 0.00%
- Reading proficiency
- 33% ▬ 0.00%
- Median HH income
- $55,194
- Composite
- 29.52/100
- National rank
- #11769
- State rank
- #1007 of 1400 in CA
Livability — Oakland
- Score
- 71/100
- State rank
- #224
- US rank
- #7245
Category grades
Schools grade is shown separately in the Schools card above.
Census & demographics
- Census place
- Oakland, CA
- County
- Alameda County · 1,614,355 people
- City population
- 385,993
- Metro
- San Francisco-Oakland-Berkeley, CA
- Population (ZIP)
- 28,804
- Household income
- $94,863
- Rent vs Own
- Severe rent burden
- 2002.0
Population outlook (Alameda County) Hauer SSP2
- Today (2025)
- 1,928,884 people
- By 2030
- 2,069,146 · +7.3%
- By 2040
- 2,338,405 · +21.2%
- By 2050
- 2,586,608 · +34.1%
- By 2075
- 3,061,911 · +58.7%
- By 2100
- 3,234,133 · +67.7%
Race, ethnicity, and origin ACS 2023
- Neighborhood character
- Highly diverse neighborhood (Simpson 0.78)
- Race & ethnicity
- Black 29% White 25% Asian 25% Hispanic / Latino 13% Two or more races 10%
- Hispanic origin (detail)
- Mexican 8%
- Common ancestry
- Lithuanian 1% Romanian 1% Portuguese 1%
- Foreign-born
- 28% · China, Canada, Vietnam
- Languages at home
- 65% English-only · Chinese 16% Spanish 8% Arabic 2%
Political lean MEDSL · Alameda
- 2024 margin
- Solid D (+53.6) · D 74.6% · R 21.0% · Other 4.4%
- 2008→2024 swing
- -5.9pp toward R · 2008: 59.5pp · 2024: 53.6pp
- All cycles
- 2024: D+53.6 2020: D+62.5 2016: D+64.4 2012: D+59.8 2008: D+59.5
Not yet ingested
- Civics
- —
Market trends
- HPI YoY
- ▼ -170.49%
- Current HPI
- 263.5885
- Rent YoY
- ▲ 3.24%
- Metro
- San Francisco-Oakland-Berkeley, CA
- State GDP YoY
- ▲ 3.21%
- F500 in state
- 116
Industry mix (Fortune 500 HQ in CA)
| Industry | F500 HQs | Revenue |
|---|---|---|
| Technology | 27 | $1,492B |
|
||
| Financial Services | 3 | $174B |
|
||
| Retail | 3 | $44B |
|
||
| Insurance | 3 | $26B |
|
||
| Media / Entertainment | 2 | $115B |
|
||
| Pharmaceuticals / Biotech | 2 | $62B |
|
||
Price history
+1748.1% since first listed7 events — show timeline
- 2026-06-17 Listed $499,000 bridgeMLS, Bay East AOR, or Contra Costa AOR
- 2016-07-19 Listing Removed — bridgeMLS, Bay East AOR, or Contra Costa AOR
- 2006-09-21 Listing Removed — bridgeMLS, Bay East AOR, or Contra Costa AOR
- 2006-09-15 Price Changed — bridgeMLS, Bay East AOR, or Contra Costa AOR
- 2006-08-11 Listed — bridgeMLS, Bay East AOR, or Contra Costa AOR
- 1991-12-31 Sold (Public Records) $152,000 Public Records
- 1979-09-01 Sold (Public Records) $27,000 Public Records
Property tax history
+2.6%/yrLatest (2025): $9,375 · +4.5% YoY. Source: county tax records.
Cash-flow waterfall
monthlySold comps — $/sqft
last 12 mo · ≤1 miLoading sold comps…