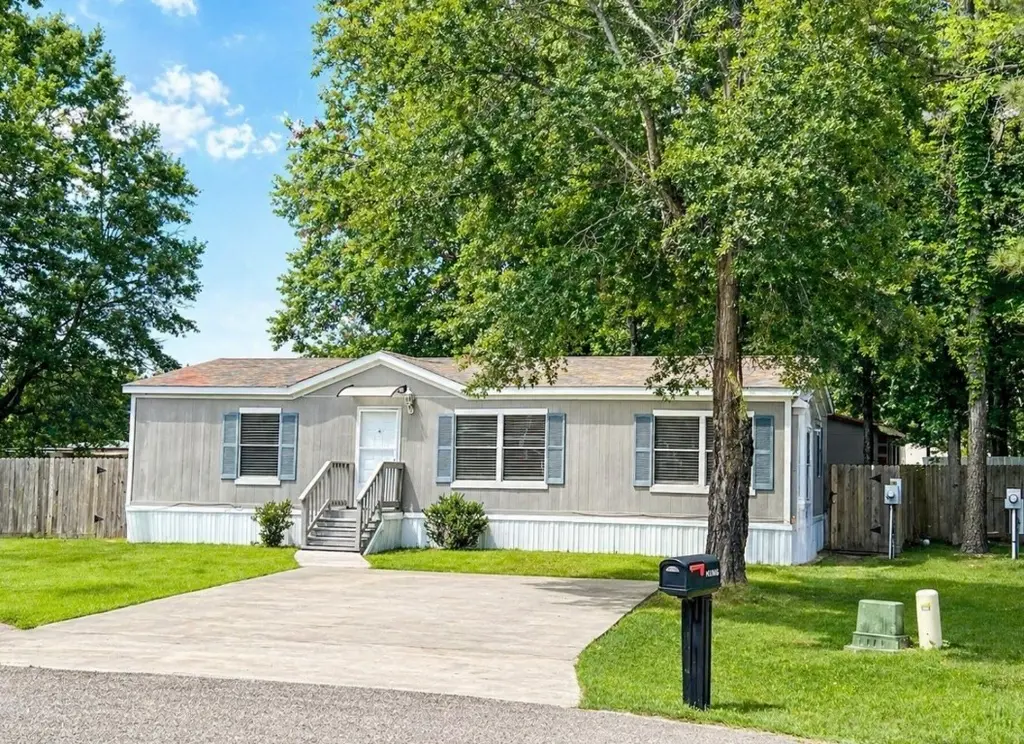
33114 Mckinley Cir · The Woodlands, TX
Flood risk 1/10 · Minimal
- FEMA flood zone
- X (unshaded)
- Chance of flooding over 30 yrs
- 0.0%
- Est. flood insurance / yr
- $507 – $1,088
Fire risk 3/10 · Minor
- Est. fire insurance / yr
- $1,222 – $2,270
Heat risk 8/10 · Major
- Hot days now (above 111°F)
- 7 days/yr
- Hot days in 30 yrs
- 23 days/yr
Wind risk 8/10 · Major
- Chance of severe wind over 30 yrs
- 99.0%
Air-quality risk 2/10 · Minimal
- Unhealthy air days now
- 2 days/yr
- Unhealthy air days in 30 yrs
- 2 days/yr
Risk factors via First Street. Map © Google.
Why this score? — see what drove the B+ grade
The composite is a weighted blend of 9 inputs, each scored 0–100. Each bar is that input's sub-score; the figure is the points it added to the 100-point composite (weight × sub-score).
- Cash flow +28.4/30.0
- DSCR +10.0/10.0
- Appreciation +10.0/10.0
- ARV discount +7.5/15.0
- 1% rule +7.3/10.0
- Livability +4.5/5.0
- Schools +3.9/10.0
- Rent growth +2.6/5.0
- Condition / age +2.5/5.0
$204,000
🖨 Deal sheet 📄 Offer letter ✓ Due diligence
Listing remarks MLS
Nice 3 bedroom manufactured home located in quiet neighborhood. You will enjoy living close to Kroger, Target and the new HEB for your convenience and close to the Woodlands. Some of the upgrades include a recent new roof. Hurry won't last long!
Key facts
- Dual sinks
- Private bath
- Soaking tub
Tags
Property features AI
Finance
- Other: Has additional parcel(s)
- HOA & community: Community managed by MC Management; Annual association fee of $300
Exterior
- Parking: No designated parking listed
- Utilities: Public water; Public sewer
- Home design: Residential property; Located on a cul-de-sac in a subdivision; Concrete road access
- Construction: Built in 2003; Composition roof; Construction materials: Unknown
- Exterior features: Deck; Patio; Private yard; Fence (back yard); Storage shed(s)
Interior
- Kitchen: Dishwasher; Electric oven; Electric range; Garbage disposal; Refrigerator; Breakfast nook adjacent to kitchen (approx. 10x13)
- Bedrooms: Primary bedroom on the first floor (approx. 11x13); Two additional bedrooms on the first floor (approx. 13x10 and 10x10); Home configured for 3 bedrooms
- Flooring: Carpet; Laminate; Tile; Vinyl
- Bathrooms: 2 full bathrooms
- Heating & cooling: Central heating (electric); Central air conditioning (electric); Energy-efficient thermostat
- Interior features: Window treatments; Ceiling fans; Programmable thermostat; Window coverings
- Laundry & utility: Washer hookup; Electric dryer hookup
Neighborhood map
What this means for you Summary
Snapshot
- This is a 3-bed/2.0-bath manufactured listed at $204k.
Deal economics
- At list price, monthly cash flow is $662 ($8k/yr) — positive.
- The deal already cash-flows at list — no discount required.
- Meets the 1% rule at list price ($3k rent vs $204k).
- Recommended offer: $198k (3.0% below list) — sets the bar for market timing.
- Cap rate 10.2% vs local median 2.3% in The Woodlands — top-decile yield for the area; either an underpriced asset or a hidden risk that comps aren't pricing in. Stress-test before assuming the spread holds.
Location & tenants
- Location reads 91/100 on livability (#1 in TX, #47 nationally) — a professional / high-income tenant draw. Strengths: schools A+, amenities A+, commute A+; Watch: cost of living D-.
- Magnolia ISD (rural): math 42% / reading 45% proficiency, ranked #247 of 826 in TX (top 30%) — families likely to look elsewhere, expect single-tenant / working-renter base with shorter leases.
- Market conditions: Rents flat; 1604 active listings in the ZIP; 7 comparable units currently listed for rent nearby; rentals leasing fast (median 10d on market — plan ~1-2 weeks tenant-placement turnaround); high-income renter base; 13,259 units permitted in Montgomery County in 2024 (1,402 in 5+ unit buildings).
Forward outlook
- In year one you build about $22k of equity ($1k loan paydown + $20k appreciation (10.0% local appreciation)).
- Montgomery County population projected at +65% by 2050 — long-run rental-demand tailwind backs the buy-and-hold thesis.
- At projected returns (10.0% appreciation + 0.3% rent growth), your $57k cash investment doubles in ~2 years — after that, you're playing with house money.
- By year 2, paydown + projected appreciation supports a ~$35k cash-out refi (75% LTV) — recoverable capital for the next deal without selling this one.
Negotiation context
- It's been on market 34 days — a 3% lower offer ($198k) is reasonable based on typical stale-listing flexibility.
- 4 sale attempts since 19y ago; this cycle's ask is 14471% above the opening price — seller raised mid-cycle; expect resistance to lowballs.
Risks & watch-outs
- Climate carrying-cost: severe wind risk, 99% chance of damaging wind over 30y; extreme-heat days projected 7→23/yr by 2055 (HVAC capex compounding) — expect insurance premiums to compound above CPI over the hold.
Questions for the listing agent
- It's been on market 34 days. Have you received any prior offers? Is the seller open to a 3% concession, seller financing, or rate buy-down credit?
- What does the HOA fee cover, when was the last increase, and are there any pending special assessments or reserve-fund shortfalls?
- Is there a deadline driving the sale (1031 exchange, divorce, estate, relocation)? That informs how much negotiation room exists.
- Schools are A-rated — typically a magnet for longer-tenancy family renters. What's the average tenant stay here, and is there a school-zone premium baked into asking?
- What's the average days-on-market for RENTAL listings here right now (not sales)? A rising rental-DOM trend means longer vacancies and softer asking-rent achievability than the comps imply.
- What's the recent tenant-quality profile in this submarket — average credit score on applications, eviction rate, late-payment / NSF rate, and stable-employment percentage? A property-management company in the area should have these aggregated.
- How much new for-sale + rental construction is in the pipeline within 1–3 miles? Heavy new supply typically softens prices + rents 12–24 months out; constrained supply supports both.
Investment metrics
- 1% rule
- 1.23% ✓
- Cap rate
- 10.18%
- Cash-on-cash
- 13.90%
- DSCR
- 1.62
- GRM
- 6.8
CMA / ARV
No comps found within radius.
Projected returns pro-forma
10.0% appreciation · 0.32% rent growth · sell at horizon
- IRR
- 33.3%
- Equity multiple
- 3.57×
- Total profit
- $146,619
- Equity at exit
- $183,779
- IRR
- 27.9%
- Equity multiple
- 7.77×
- Total profit
- $386,623
- Equity at exit
- $396,327
Cash invested: $57,120 (down + closing). Projections, not guarantees.
Landlord ↔ Tenant lean methodology
- Overall (STATE)
- 87 Strongly Landlord-Friendly
- State Texas
- 87 Strongly Landlord-Friendly · R+5
- County
- — inherits STATE
- City
- — inherits STATE
ZIP-level market 77354
- Home prices YoY
- 2.4%
- Rents YoY
- 0.3%
- Active inventory
- 1604
- Price-to-rent
- 6.8×
Monthly cashflow live
- Estimated rent
- $2,514 high interval (Pro) →
- Mortgage (P&I)
- −$1,070
- Tax from tax record
- −$145 /mo · $1,739/yr
- Insurance
- −$85
- HOA
- −$25
- Vacancy / Maint / Mgmt
- −$528
- Net cashflow
- $662
Break-even live
UW: 25.0% down · 7.5% · 30yr · 1.5% tax · 5.0% vac · 8.0% maint · 8.0% mgmt
Financing live
Cash to close
- Down payment
- $51,000
- Closing costs
- $6,120
- Reserves months
- —
- Total cash needed
- —
Loan-product check · same deal, 3 products live
Conventional
25% down · 7.5% · 30yr
- Down + closing
- —
- Monthly P&I
- —
- Monthly cashflow
- —
- DSCR
- —
- Eligible?
- —
Personal DTI + credit; lowest rate.
DSCR
20% down · 8.5% · 30yr
- Down + closing
- —
- Monthly P&I
- —
- Monthly cashflow
- —
- DSCR
- —
- Eligible?
- —
No personal income docs; deal must DSCR.
Hard money
10% down · 12.0% · 12mo
- Down + closing
- —
- Monthly P&I
- —
- Monthly cashflow
- —
- DSCR
- —
- Eligible?
- —
Short-term bridge; refi at stabilization.
Rent comps 7 comps
| Address | Beds | Baths | Sqft | Rent | $/sqft | DOM | Units | Dist |
|---|---|---|---|---|---|---|---|---|
| 33200 Forest West St Magnolia, TX | 1.0–3.0 | 1.5–2.5 | 1307 | $4,065 | $3.11 | 1d | 22 | 0.32mi |
| 33124 Magnolia Cir Magnolia, TX | 2.0 | 2.0 | 1122 | $1,875 | $1.67 | 43d | 1 | 0.43mi |
| 10333 Research Forest Dr Unit 3047 Magnolia, TX | 3.0 | 2.0 | 1377 | $2,383 | $1.73 | 10d | 1 | 0.70mi |
| 33154 Oak Heights Pl Magnolia, TX | 3.0–4.0 | 2.5 | 1812 | $2,195 | $1.21 | 4d | 7 | 0.77mi |
| 10333 Research Forest Dr Unit 10366 Magnolia, TX | 3.0 | 2.0 | 1377 | $2,372 | $1.72 | 10d | 1 | 0.78mi |
| 10333 Research Forest Dr Unit 3228 Magnolia, TX | 3.0 | 2.0 | 1377 | $2,340 | $1.70 | 2d | 1 | 0.78mi |
| 39300 Cimarron Way Magnolia, TX | 2.0 | 2.0 | 1172 | $1,353 | $1.15 | 11d | 1 | 0.98mi |
HOA detail
- Monthly dues
- $25 · $300/yr
Listing history 14 events
-
2026-06-04days on market $204,000 Active 34 DOM
-
2026-06-03days on market $204,000 Active 33 DOM
-
2026-06-02days on market $204,000 Active 32 DOM
-
2026-06-01days on market $204,000 Active 31 DOM
-
2026-05-31days on market $204,000 Active 30 DOM
-
2026-05-01$204,000 Active 673-char remark
-
2018-04-25soldstatus
-
2018-04-24soldstatus Sold 245-char remark
Show marketing remark (245 chars)
Nice 3 bedroom manufactured home located in quiet neighborhood. You will enjoy living close to Kroger, Target and the new HEB for your convenience and close to the Woodlands. Some of the upgrades include a recent new roof. Hurry won't last long!
-
2018-04-05status Pending 245-char remark
Show marketing remark (245 chars)
Nice 3 bedroom manufactured home located in quiet neighborhood. You will enjoy living close to Kroger, Target and the new HEB for your convenience and close to the Woodlands. Some of the upgrades include a recent new roof. Hurry won't last long!
-
2018-03-27status Option Pending 245-char remark
Show marketing remark (245 chars)
Nice 3 bedroom manufactured home located in quiet neighborhood. You will enjoy living close to Kroger, Target and the new HEB for your convenience and close to the Woodlands. Some of the upgrades include a recent new roof. Hurry won't last long!
-
2018-03-15$94,000 Active 245-char remark
Show marketing remark (245 chars)
Nice 3 bedroom manufactured home located in quiet neighborhood. You will enjoy living close to Kroger, Target and the new HEB for your convenience and close to the Woodlands. Some of the upgrades include a recent new roof. Hurry won't last long!
-
2011-01-20soldstatus
-
2007-04-18historical
-
2007-03-14$24,950
ⓘ Source: listings_history table (triggers on properties + properties_extension) + one-shot
backfill from property_details.listing_events for pre-trigger history.
Tax reassessment forecast TX · Resets to sale price
- Current annual tax
- $1,739 · $145/mo
- Projected year-2 tax
- $3,733 · $311/mo
- Expected delta
- +$1,994/yr (+$166/mo · 114.7%)
ⓘ Screening estimate from a state-policy table — verify with the county assessor before closing.
Climate risk First Street
- Flood 1/10 Low FEMA zone X (unshaded) · 0% chance over 30 yrs
- Wildfire 3/10 Moderate
- Heat 8/10 Severe 7 d/yr ≥111°F today · 23 d/yr by 30 yrs out
- Wind 8/10 Severe 99% chance of damaging wind over 30 yrs
- Air quality 2/10 Low 2 unhealthy d/yr today · 2 by 30 yrs out
Nearby sold comps map
Loading sold comps map…
Walkable amenities ~0.75 mi
Loading nearby amenities…
Taxation est. · year 1
- Rental income
- $30,171
- − Mortgage interest
- −$11,427
- − Property taxes
- −$1,739
- − Insurance
- −$1,020
- − Repairs & maintenance
- −$2,414
- − Management
- −$2,414
- − HOA
- −$300
- − Depreciation
- −$5,935
- Taxable income
- $4,923
- Est. tax owed @ 24.0%
- −$1,181
- After-tax cash flow
- $6,757/yr
For passive investors: Depreciation is non-cash, so a rental often shows a tax loss while cash-flowing — sheltering income. Rental losses are passive: they offset passive income freely, and up to $25,000/yr can offset ordinary (W-2) income if you actively participate and your MAGI is under $100k (phasing out to $0 by $150k); unused losses carry forward. On sale, claimed depreciation is recaptured at up to 25%, and gains may owe capital-gains tax (a 1031 exchange can defer both). Figures are a year-1 estimate at your 24.0% rate — not tax advice; consult a CPA.
Schools (NCES district)
- District
- Magnolia ISD
- NCES district ID
- 4828740
- Math proficiency
- 42% ▼ -7.00%
- Reading proficiency
- 45% ▼ -4.00%
- Median HH income
- $71,692
- Composite
- 39.46/100
- National rank
- #3958
- State rank
- #247 of 826 in TX
Livability — The Woodlands
- Score
- 91/100
- State rank
- #1
- US rank
- #47
Category grades
Schools grade is shown separately in the Schools card above.
Census & demographics
- County
- Montgomery County · 663,713 people
- City population
- 32,847
- Metro
- Houston-The Woodlands-Sugar Land, TX
- Population (ZIP)
- 44,900
- Household income
- $112,504
- Rent vs Own
- Severe rent burden
- 586.0
Population outlook (Montgomery County) Hauer SSP2
- Today (2025)
- 713,896 people
- By 2030
- 805,263 · +12.8%
- By 2040
- 992,708 · +39.1%
- By 2050
- 1,179,590 · +65.2%
- By 2075
- 1,628,084 · +128.1%
- By 2100
- 1,937,880 · +171.5%
Race, ethnicity, and origin ACS 2023
- Neighborhood character
- Predominantly White (66%)
- Race & ethnicity
- White 66% Hispanic / Latino 25% Two or more races 18% Black 3% Asian 1%
- Hispanic origin (detail)
- Mexican 14% Puerto Rican 1%
- Common ancestry
- Lithuanian 4% Slovak 2% Italian 2%
- Foreign-born
- 11% · Canada, Vietnam
- Languages at home
- 83% English-only · Spanish 15% Other Indo-European 1% German/W. Germanic 1%
Political lean MEDSL · Montgomery
- 2024 margin
- Solid R (+45.5) · D 26.8% · R 72.3%
- 2008→2024 swing
- +7.2pp toward D · 2008: -52.7pp · 2024: -45.5pp
- All cycles
- 2024: R+45.5 2020: R+43.8 2016: R+51.4 2012: R+60.7 2008: R+52.7
Not yet ingested
- Civics
- —
Market trends
- HPI YoY
- ▲ 12.09%
- Current HPI
- 512.87
- Rent YoY
- ▲ 0.32%
- Metro
- Houston-The Woodlands-Sugar Land, TX
- State GDP YoY
- ▲ 3.95%
- F500 in state
- 110
Industry mix (Fortune 500 HQ in TX)
| Industry | F500 HQs | Revenue |
|---|---|---|
| Energy | 16 | $1,198B |
|
||
| Technology | 5 | $198B |
|
||
| Engineering / Construction | 4 | $72B |
|
||
| Energy Services | 3 | $60B |
|
||
| Utilities | 3 | $41B |
|
||
| Healthcare | 2 | $330B |
|
||
Price history
-94.4% since first listed12 events — show timeline
- 2026-06-06 Rental Removed $1,400 HARMLS
- 2026-06-06 Listing Removed — HARMLS
- 2026-06-05 Listed for Rent $1,400 HARMLS
- 2026-05-01 Listed $204,000 HARMLS
- 2018-04-25 Sold (Public Records) — Public Records
- 2018-04-24 Sold (MLS) — HARMLS
- 2018-04-05 Pending — HARMLS
- 2018-03-27 Pending — HARMLS
- 2018-03-15 Listed $94,000 HARMLS
- 2011-01-20 Sold (Public Records) — Public Records
- 2007-04-18 Listing Removed — HARMLS
- 2007-03-14 Listed $24,950 HARMLS
Property tax history
+14.8%/yrLatest (2025): $1,739 · -6.6% YoY. Source: county tax records.
Cash-flow waterfall
monthlySold comps — $/sqft
last 12 mo · ≤1 miLoading sold comps…