 Triplex
🌊 Lakefront
Triplex
🌊 Lakefront
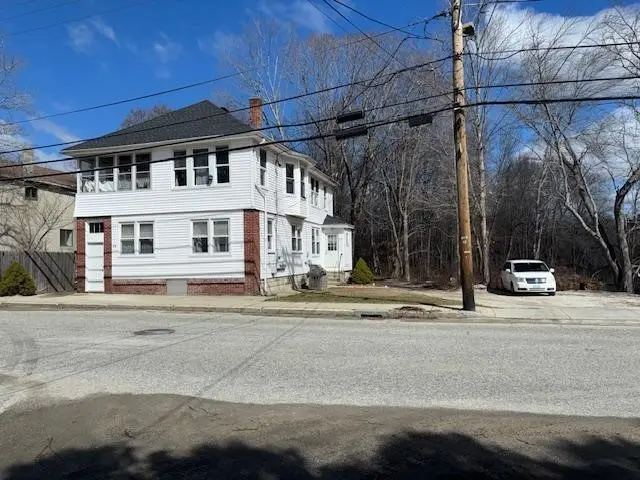
90 Mapleville Main St · Burrillville, RI
Flood risk 1/10 · Minimal
- FEMA flood zone
- X (unshaded)
- Chance of flooding over 30 yrs
- 0.0%
- Est. flood insurance / yr
- $473 – $860
Fire risk 4/10 · Minor
- Est. fire insurance / yr
- $835 – $1,551
Heat risk 4/10 · Minor
- Hot days now (above 94°F)
- 7 days/yr
- Hot days in 30 yrs
- 15 days/yr
Wind risk 6/10 · Moderate
- Chance of severe wind over 30 yrs
- 59.0%
Air-quality risk 2/10 · Minimal
- Unhealthy air days now
- 2 days/yr
- Unhealthy air days in 30 yrs
- 2 days/yr
Risk factors via First Street. Map © Google.
Why this score? — see what drove the B- grade
The composite is a weighted blend of 9 inputs, each scored 0–100. Each bar is that input's sub-score; the figure is the points it added to the 100-point composite (weight × sub-score).
- Cash flow +24.8/30.0
- ARV discount +10.9/15.0
- DSCR +8.0/10.0
- Appreciation +6.2/10.0
- 1% rule +5.8/10.0
- Rent growth +2.5/5.0
- Livability +2.5/5.0
- Condition / age +2.5/5.0
- Schools +2.1/10.0
$499,000
🖨 Deal sheet 📄 Offer letter ✓ Due diligence
Multi-family units
County records classify this as Multi-Family (2-4 Unit). Listing-text estimate: 3 units. confirmed
Listing remarks MLS
Great quiet location for a 3 family. First floor has two different good size units that have private entrances, 3 rooms/1 bed and full bath. Both are updated and good condition. Upper floor would make a great owner's unit. Offers bright open floor plan, eat in kitchen, pantry, dining area, living room 2 beds, full bath and sunroom. House is vinyl sided, updated windows and new roof, appliances and coin op washer/dryer. Nice yard and huge garage/out building, plenty of parking and private yard. Close to school, highway, shopping, swimming and more. Rents are below market. Seller is in process of installing hard wired smoke/carbon fire system. Lead certificates up to date. Well and public sewer.
Key facts
- 7,405 sq ft lot
- Garage
- Community pool
Neighborhood map
What this means for you Summary
Snapshot
- This is a 3 × 4-bed/3.0-bath units multifamily listed at $499k.
Deal economics
- At list price, monthly cash flow is $1k ($13k/yr) — positive. Per door: $352/mo.
- The deal already cash-flows at list — no discount required.
- Meets the 1% rule at list price ($5k rent vs $499k).
- Recommended offer: $469k (6.0% below list) — sets the bar for market timing.
Location & tenants
- Location reads: area grade B — affects rentability + tenant quality, not the cash-flow math above.
- Burrillville (suburban): math 14% / reading 29% proficiency, ranked #27 of 39 in RI (top 69%) — low school quality limits family demand, transient renter base, plan for 1-2y turnover.
- Market conditions: 9 active listings in the ZIP; 1 comparable units currently listed for rent nearby; 776 units permitted in Providence County in 2024 (229 in 5+ unit buildings).
Forward outlook
- In year one you build about $15k of equity ($3k loan paydown + $12k appreciation (2.4% local appreciation)).
- Providence County population projected at +5% by 2050 — modest demand growth; plan on rents tracking national, not racing it.
- At projected returns (2.4% appreciation + 3.0% rent growth), your $140k cash investment doubles in ~5 years — after that, you're playing with house money.
- By year 3, paydown + projected appreciation supports a ~$39k cash-out refi (75% LTV) — recoverable capital for the next deal without selling this one.
Negotiation context
- It's been on market 75 days — a 6% lower offer ($469k) is reasonable based on typical stale-listing flexibility.
Risks & watch-outs
- Watch-outs: built in 1900 — expect roof / HVAC / electrical / plumbing capex.
- Climate carrying-cost: major wind risk, 59% chance of damaging wind over 30y — expect insurance premiums to compound above CPI over the hold.
Questions for the listing agent
- It's been on market 75 days. Have you received any prior offers? Is the seller open to a 6% concession, seller financing, or rate buy-down credit?
- Can we see the unit-by-unit rent roll, current vacancy, and any below-market leases? What's the average tenancy length?
- What capital expenditures (roof, boiler, parking lot, exteriors) have been made in the last 5 years, and what's planned in the next 2?
- Built in 1900 — when were the roof, HVAC, electrical panel, plumbing, and water heater last replaced?
- Why hasn't it sold? Are there any deal-killer items the seller is aware of (foundation, flood, title, zoning, code violations)?
- Is there a deadline driving the sale (1031 exchange, divorce, estate, relocation)? That informs how much negotiation room exists.
- This sits on a lake — are riparian / water-frontage rights deeded with the parcel? Any dock permits, shoreline easements, or HOA water-use restrictions?
- What's the documented flood / surge / shoreline-erosion history here (FEMA AND non-FEMA — e.g., storm surge, creek backup, septic-field saturation)?
- Any water-quality or seasonal algae-bloom issues that affect tenant satisfaction or short-term-rental demand?
- What's the average days-on-market for RENTAL listings here right now (not sales)? A rising rental-DOM trend means longer vacancies and softer asking-rent achievability than the comps imply.
- What's the recent tenant-quality profile in this submarket — average credit score on applications, eviction rate, late-payment / NSF rate, and stable-employment percentage? A property-management company in the area should have these aggregated.
- How much new apartment / multifamily construction is in the pipeline within 1–3 miles? Heavy new supply (>2% of stock underway) typically softens rents 12–24 months out; light construction supports rent growth.
Investment metrics
- 1% rule
- 1.08% ✓
- Cap rate
- 8.83%
- Cash-on-cash
- 9.07%
- DSCR
- 1.40
- GRM
- 7.7
CMA / ARV
- ARV (median comp)
- $540,286
- List price
- $499,000
- Delta
- -7.64%
- Verdict
- FAIR
- Comps
- 9 within 1.0 mi
Projected returns pro-forma
2.38% appreciation · 3.0% rent growth · sell at horizon
- IRR
- 14.4%
- Equity multiple
- 1.80×
- Total profit
- $111,249
- Equity at exit
- $207,296
- IRR
- 16.7%
- Equity multiple
- 3.31×
- Total profit
- $322,265
- Equity at exit
- $306,777
Cash invested: $139,720 (down + closing). Projections, not guarantees.
Landlord ↔ Tenant lean methodology
- Overall (STATE)
- 31 Tenant-Leaning
- State Rhode Island
- 31 Tenant-Leaning · D+8
- County
- — inherits STATE
- City
- — inherits STATE
ZIP-level market 02839
- Home prices YoY
- 0.7%
- Active inventory
- 9
- Price-to-rent
- 23.0×
Monthly cashflow live
- Estimated rent
- $5,414 medium interval (Pro) →
- Mortgage (P&I)
- −$2,617
- Tax from tax record
- −$396 /mo · $4,758/yr
- Insurance
- −$208
- HOA
- −$0
- Vacancy / Maint / Mgmt
- −$1,137
- Net cashflow
- $1,056
Break-even live
3-unit breakdown (identical units grouped — click to expand)
| Units | Beds | Baths | Est. rent |
|---|---|---|---|
| 3× units | 4 | 3 | $5,415 |
| #1 | 4 | 3 | $1,805 |
| #2 | 4 | 3 | $1,805 |
| #3 | 4 | 3 | $1,805 |
| Total (3 units) | $5,414 | ||
UW: 25.0% down · 7.5% · 30yr · 1.5% tax · 5.0% vac · 8.0% maint · 8.0% mgmt
Financing live
Cash to close
- Down payment
- $124,750
- Closing costs
- $14,970
- Reserves months
- —
- Total cash needed
- —
Loan-product check · same deal, 3 products live
Conventional
25% down · 7.5% · 30yr
- Down + closing
- —
- Monthly P&I
- —
- Monthly cashflow
- —
- DSCR
- —
- Eligible?
- —
Personal DTI + credit; lowest rate.
DSCR
20% down · 8.5% · 30yr
- Down + closing
- —
- Monthly P&I
- —
- Monthly cashflow
- —
- DSCR
- —
- Eligible?
- —
No personal income docs; deal must DSCR.
Hard money
10% down · 12.0% · 12mo
- Down + closing
- —
- Monthly P&I
- —
- Monthly cashflow
- —
- DSCR
- —
- Eligible?
- —
Short-term bridge; refi at stabilization.
Rent comps 1 comps
| Address | Beds | Baths | Sqft | Rent | $/sqft | DOM | Units | Dist |
|---|---|---|---|---|---|---|---|---|
| 843 Victory Hwy Mapleville, RI | 3.0 | 2.0 | 1662 | $3,000 | $1.81 | 2d | 1 | 0.17mi |
Listing history 11 events
-
2026-06-09days on market $499,000 Active 75 DOM
-
2026-06-08days on market $499,000 Active 74 DOM
-
2026-06-08days on market $499,000 Active 73 DOM
-
2026-06-07days on market $499,000 Active 72 DOM
-
2026-06-04days on market $499,000 Active 69 DOM
-
2026-06-02days on market $499,000 Active 68 DOM
-
2026-06-01days on market $499,000 Active 67 DOM
-
2026-05-31days on market $499,000 Active 66 DOM
-
2026-05-14price $499,000 702-char remark
Show marketing remark (702 chars)
Great quiet location for a 3 family. First floor has two different good size units that have private entrances, 3 rooms/1 bed and full bath. Both are updated and good condition. Upper floor would make a great owner's unit. Offers bright open floor plan, eat in kitchen, pantry, dining area, living room 2 beds, full bath and sunroom. House is vinyl sided, updated windows and new roof, appliances and coin op washer/dryer. Nice yard and huge garage/out building, plenty of parking and private yard. Close to school, highway, shopping, swimming and more. Rents are below market. Seller is in process of installing hard wired smoke/carbon fire system. Lead certificates up to date. Well and public sewer.
-
2026-04-26price $515,000 702-char remark
Show marketing remark (702 chars)
Great quiet location for a 3 family. First floor has two different good size units that have private entrances, 3 rooms/1 bed and full bath. Both are updated and good condition. Upper floor would make a great owner's unit. Offers bright open floor plan, eat in kitchen, pantry, dining area, living room 2 beds, full bath and sunroom. House is vinyl sided, updated windows and new roof, appliances and coin op washer/dryer. Nice yard and huge garage/out building, plenty of parking and private yard. Close to school, highway, shopping, swimming and more. Rents are below market. Seller is in process of installing hard wired smoke/carbon fire system. Lead certificates up to date. Well and public sewer.
-
2026-03-26$525,000 Active 702-char remark
Show marketing remark (702 chars)
Great quiet location for a 3 family. First floor has two different good size units that have private entrances, 3 rooms/1 bed and full bath. Both are updated and good condition. Upper floor would make a great owner's unit. Offers bright open floor plan, eat in kitchen, pantry, dining area, living room 2 beds, full bath and sunroom. House is vinyl sided, updated windows and new roof, appliances and coin op washer/dryer. Nice yard and huge garage/out building, plenty of parking and private yard. Close to school, highway, shopping, swimming and more. Rents are below market. Seller is in process of installing hard wired smoke/carbon fire system. Lead certificates up to date. Well and public sewer.
ⓘ Source: listings_history table (triggers on properties + properties_extension) + one-shot
backfill from property_details.listing_events for pre-trigger history.
Tax reassessment forecast RI · Partial reset (capped growth)
- Current annual tax
- $4,758 · $396/mo
- Projected year-2 tax
- $6,446 · $537/mo
- Expected delta
- +$1,688/yr (+$141/mo · 35.5%)
ⓘ Screening estimate from a state-policy table — verify with the county assessor before closing.
Climate risk First Street
- Flood 1/10 Low FEMA zone X (unshaded) · 0% chance over 30 yrs
- Wildfire 4/10 Moderate
- Heat 4/10 Moderate 7 d/yr ≥94°F today · 15 d/yr by 30 yrs out
- Wind 6/10 Major 59% chance of damaging wind over 30 yrs
- Air quality 2/10 Low 2 unhealthy d/yr today · 2 by 30 yrs out
Nearby sold comps map
Loading sold comps map…
Walkable amenities ~0.75 mi
Loading nearby amenities…
Taxation est. · year 1
- Rental income
- $64,968
- − Mortgage interest
- −$27,952
- − Property taxes
- −$4,758
- − Insurance
- −$2,495
- − Repairs & maintenance
- −$5,197
- − Management
- −$5,197
- − Depreciation
- −$14,516
- Taxable income
- $4,852
- Est. tax owed @ 24.0%
- −$1,164
- After-tax cash flow
- $11,506/yr
For passive investors: Depreciation is non-cash, so a rental often shows a tax loss while cash-flowing — sheltering income. Rental losses are passive: they offset passive income freely, and up to $25,000/yr can offset ordinary (W-2) income if you actively participate and your MAGI is under $100k (phasing out to $0 by $150k); unused losses carry forward. On sale, claimed depreciation is recaptured at up to 25%, and gains may owe capital-gains tax (a 1031 exchange can defer both). Figures are a year-1 estimate at your 24.0% rate — not tax advice; consult a CPA.
Schools (NCES district)
- District
- Burrillville
- NCES district ID
- 4400090
- Math proficiency
- 14% ▼ -6.00%
- Reading proficiency
- 29% ▼ -5.00%
- Median HH income
- $66,679
- Composite
- 20.69/100
- National rank
- #8529
- State rank
- #27 of 39 in RI
Livability — Burrillville
No livability data for this city. (Only ~50 U.S. cities are tracked.)
Census & demographics
- Population (ZIP)
- 1,690
Population outlook (Providence County) Hauer SSP2
- Today (2025)
- 653,469 people
- By 2030
- 660,819 · +1.1%
- By 2040
- 672,747 · +3.0%
- By 2050
- 683,741 · +4.6%
- By 2075
- 720,435 · +10.2%
- By 2100
- 741,582 · +13.5%
Race, ethnicity, and origin ACS 2023
- Neighborhood character
- Predominantly White (95%)
- Race & ethnicity
- White 95% Hispanic / Latino 3% Asian 1%
- Common ancestry
- Lithuanian 41% Romanian 4% Italian 2%
- Foreign-born
- 4% · Canada, Jamaica
- Languages at home
- 94% English-only · Spanish 4% Chinese 1% Russian/Polish/Slavic 1%
Political lean MEDSL · Providence
- 2024 margin
- D (+14.4) · D 56.1% · R 41.7% · Other 2.2%
- 2008→2024 swing
- -20.0pp toward R · 2008: 34.4pp · 2024: 14.4pp
- All cycles
- 2024: D+14.4 2020: D+22.9 2016: D+21.2 2012: D+34.9 2008: D+34.4
Not yet ingested
- Civics
- —
Market trends
- HPI YoY
- ▲ 2.38%
- Current HPI
- 325.8486
- Rent YoY
- —
- Metro
- —
- State GDP YoY
- ▲ 2.25%
- F500 in state
- 10
Industry mix (Fortune 500 HQ in RI)
| Industry | F500 HQs | Revenue |
|---|---|---|
| Healthcare | 1 | $373B |
|
||
| Food Distribution | 1 | $31B |
|
||
| Aerospace / Defense | 1 | $14B |
|
||
| Financial Services | 1 | $8B |
|
||
| Consumer Goods | 1 | $4B |
|
||
Price history
-5.0% since first listed3 events — show timeline
- 2026-05-14 Price Changed $499,000 RIS
- 2026-04-26 Price Changed $515,000 RIS
- 2026-03-26 Listed $525,000 RIS
Property tax history
+5.4%/yrLatest (2025): $4,758 · +13.0% YoY. Source: county tax records.
Cash-flow waterfall
monthlySold comps — $/sqft
last 12 mo · ≤1 miLoading sold comps…