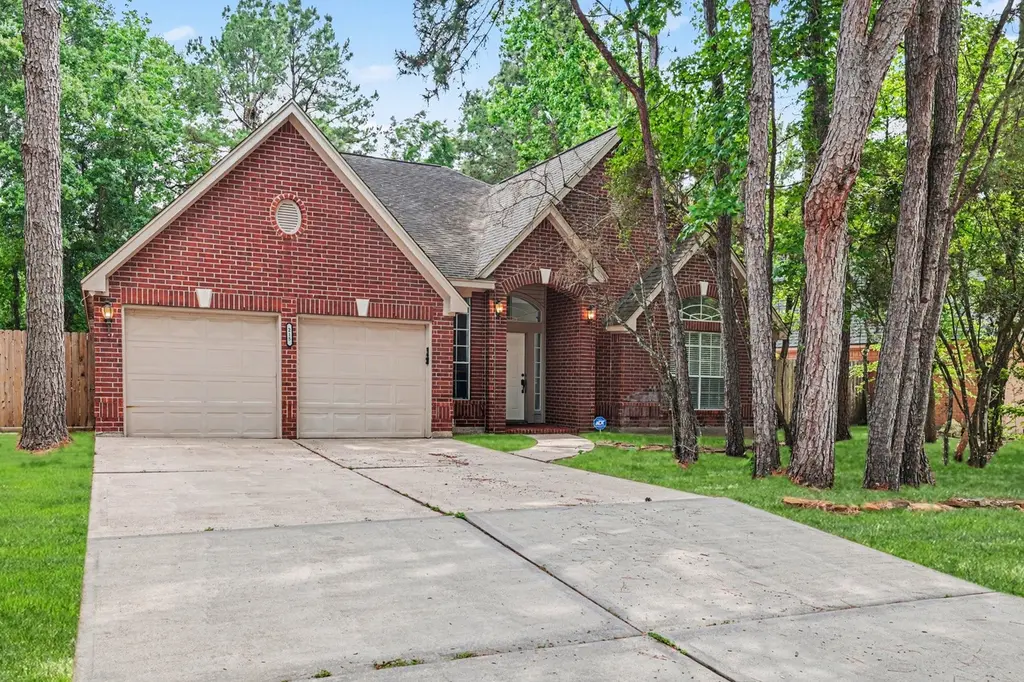
215 Bristol Bend Cir · The Woodlands, TX
Flood risk 1/10 · Minimal
- FEMA flood zone
- X (unshaded)
- Chance of flooding over 30 yrs
- 0.0%
- Est. flood insurance / yr
- $507 – $1,088
Fire risk 1/10 · Minimal
- Est. fire insurance / yr
- $1,222 – $2,270
Heat risk 8/10 · Major
- Hot days now (above 111°F)
- 7 days/yr
- Hot days in 30 yrs
- 24 days/yr
Wind risk 8/10 · Major
- Chance of severe wind over 30 yrs
- 99.0%
Air-quality risk 3/10 · Minor
- Unhealthy air days now
- 2 days/yr
- Unhealthy air days in 30 yrs
- 3 days/yr
Risk factors via First Street. Map © Google.
Why this score? — see what drove the D grade
The composite is a weighted blend of 9 inputs, each scored 0–100. Each bar is that input's sub-score; the figure is the points it added to the 100-point composite (weight × sub-score).
- Cash flow +10.1/30.0
- ARV discount +9.5/15.0
- Schools +5.1/10.0
- Livability +4.5/5.0
- 1% rule +3.3/10.0
- DSCR +2.9/10.0
- Rent growth +2.8/5.0
- Condition / age +2.5/5.0
- Appreciation +0.0/10.0
$550,300
🖨 Deal sheet 📄 Offer letter ✓ Due diligence
Listing remarks MLS
This four-bedroom, 2.5-bathroom home is located in the desirable Woodlands Village Alden Bridge neighborhood. The interior features a primary suite designed for convenience, complete with a dedicated primary bathroom and a large walk-in closet. The kitchen is equipped with functional laminate countertops and modern stainless steel appliances, providing a practical space for daily meal preparation. The location is a standout feature, allowing you to enjoy an active lifestyle with easy access to neighborhood amenities, including nearby parks, scenic walking paths, and a community pool—all within walking distance. Shopping, dining, and major thoroughfares are just moments away, making commuting a breeze. Schedule your private showing today!
Key facts
- Primary suite
- Nearby parks
- Large walk-in closet
Tags
Neighborhood map
What this means for you Summary
Snapshot
- This is a 4-bed/2.5-bath single-family listed at $550k.
Deal economics
- At list price, monthly cash flow is $-327 ($-4k/yr) — negative.
- To cash-flow at today's rent, offer at most $493k (10.5% below list).
- To meet the 1% rule (rent ≥ 1% of price), the offer needs to be $455k (17.4% below list).
- Recommended offer: $455k (17.4% below list) — sets the bar for 1% rule.
- Cap rate 5.6% vs local median 2.3% in The Woodlands — top-decile yield for the area; either an underpriced asset or a hidden risk that comps aren't pricing in. Stress-test before assuming the spread holds.
Location & tenants
- Location reads 91/100 on livability (#1 in TX, #47 nationally) — a professional / high-income tenant draw. Strengths: schools A+, amenities A+, commute A+; Watch: cost of living D-.
- Conroe ISD (other): math 57% / reading 57% proficiency, ranked #69 of 826 in TX (top 8%) — acceptable for families but not a draw, mixed tenant base, ~2y average lease.
- Market conditions: Rents rising (+1.2%/yr); 291 active listings in the ZIP; 2 comparable units currently listed for rent nearby; high-income renter base; 13,259 units permitted in Montgomery County in 2024 (1,402 in 5+ unit buildings).
- This rent runs 34% of the median local income ($162k/yr) — at the standard rent-burdened threshold; future hikes will face affordability resistance.
Forward outlook
- Local home prices are declining (-3.0%/yr); year-one equity from $4k of loan paydown is wiped out by about $17k of value loss. Plan a longer hold.
- Montgomery County population projected at +65% by 2050 — long-run rental-demand tailwind backs the buy-and-hold thesis.
Negotiation context
- It's been on market 62 days — a 6% lower offer ($517k) is reasonable based on typical stale-listing flexibility.
- 3 sale attempts since 5y ago with the ask held roughly flat each time — persistent listings suggest the price (not the market) is what's stuck; bring a comps-based counter.
Risks & watch-outs
- Climate carrying-cost: severe wind risk, 99% chance of damaging wind over 30y; extreme-heat days projected 7→24/yr by 2055 (HVAC capex compounding) — expect insurance premiums to compound above CPI over the hold.
Questions for the listing agent
- What do current leases actually rent for vs. the listed asking? Can we see a recent rent roll and the last 12 months of T-12 income?
- It's been on market 62 days. Have you received any prior offers? Is the seller open to a 17% concession, seller financing, or rate buy-down credit?
- What does the HOA fee cover, when was the last increase, and are there any pending special assessments or reserve-fund shortfalls?
- Why hasn't it sold? Are there any deal-killer items the seller is aware of (foundation, flood, title, zoning, code violations)?
- Is there a deadline driving the sale (1031 exchange, divorce, estate, relocation)? That informs how much negotiation room exists.
- Schools are A-rated — typically a magnet for longer-tenancy family renters. What's the average tenant stay here, and is there a school-zone premium baked into asking?
- The area grade is low — what's the realistic commute time and amenity access for the typical tenant pool here? Any planned neighborhood developments (good or bad) we should know about?
- What's the average days-on-market for RENTAL listings here right now (not sales)? A rising rental-DOM trend means longer vacancies and softer asking-rent achievability than the comps imply.
- What's the recent tenant-quality profile in this submarket — average credit score on applications, eviction rate, late-payment / NSF rate, and stable-employment percentage? A property-management company in the area should have these aggregated.
- How much new for-sale + rental construction is in the pipeline within 1–3 miles? Heavy new supply typically softens prices + rents 12–24 months out; constrained supply supports both.
Investment metrics
- 1% rule
- 0.83% ✗
- Cap rate
- 5.58%
- Cash-on-cash
- -2.54%
- DSCR
- 0.89
- GRM
- 10.1
CMA / ARV
- ARV (median comp)
- $576,167
- List price
- $550,300
- Delta
- -4.49%
- Verdict
- FAIR
- Comps
- 20 within 1.0 mi
Show comp detail 12 sales within ~0.75 mi
| Address | Dist | Beds/Ba | Sqft | Sold | Price | $/sf | Match |
|---|---|---|---|---|---|---|---|
| 55 Pinepath Pl | 0.27mi | 4/2.5 | 2,523 (+2%) | 1mo | $565,000 | $224 | 83 |
| 70 Amberglow Ct | 0.22mi | 4/2.5 | 2,607 (+6%) | 0mo | $575,000 | $221 | 80 |
| 82 E Coldbrook Cir | 0.37mi | 3/2.5 (-1) | 2,611 (+6%) | 1mo | $619,900 | $237 | 67 |
| 46 Indian Summer Pl | 0.45mi | 4/2.5 | 2,631 (+6%) | 1mo | $617,774 | $235 | 67 |
| 14 S Duskwood Pl | 0.37mi | 4/2.5 | 2,666 (+8%) | 3mo | $565,000 | $212 | 67 |
| 50 E Greywing Cir | 0.35mi | 4/2.5 | 2,704 (+9%) | 2mo | $495,000 | $183 | 66 |
| 107 N N Sunny Slope Cir | 0.47mi | 4/2.5 | 2,646 (+7%) | 3mo | $499,000 | $189 | 63 |
| 26 Serene Creek Pl | 0.62mi | 3/2.5 (-1) | 2,570 (+4%) | 2mo | $525,000 | $204 | 58 |
| 6 Tethered Vine Pl | 0.59mi | 3/2.5 (-1) | 2,561 (+4%) | 6mo | $547,900 | $214 | 56 |
| 18 S Dragonwood Pl | 0.35mi | 4/2.5 | 2,827 (+14%) | 4mo | $725,000 | $256 | 56 |
| 175 W Bristol Oak Cir | 0.67mi | 3/2.0 (-1) | 2,566 (+4%) | 2mo | $575,000 | $224 | 54 |
| 23 Sparklewood Pl | 0.55mi | 4/2.5 | 2,841 (+15%) | 1mo | $649,999 | $229 | 49 |
Match score weights: distance 35% · size 25% · config 20% · recency 20%. Top-matched comps best support the ARV.
Projected returns pro-forma
-3.0% appreciation · 1.25% rent growth · sell at horizon
- IRR
- -22.5%
- Equity multiple
- 0.24×
- Total profit
- $-117,710
- Equity at exit
- $82,052
- IRR
- -22.0%
- Equity multiple
- -0.04×
- Total profit
- $-159,904
- Equity at exit
- $47,580
Cash invested: $154,084 (down + closing). Projections, not guarantees.
Landlord ↔ Tenant lean methodology
- Overall (STATE)
- 87 Strongly Landlord-Friendly
- State Texas
- 87 Strongly Landlord-Friendly · R+5
- County
- — inherits STATE
- City
- — inherits STATE
ZIP-level market 77382
- Home prices YoY
- -16.3%
- Rents YoY
- 1.2%
- Active inventory
- 291
- Price-to-rent
- 10.1×
Monthly cashflow live
- Estimated rent
- $4,548 medium interval (Pro) →
- Mortgage (P&I)
- −$2,886
- Tax from tax record
- −$713 /mo · $8,550/yr
- Insurance
- −$229
- HOA
- −$92
- Vacancy / Maint / Mgmt
- −$955
- Net cashflow
- $-327
Break-even live
UW: 25.0% down · 7.5% · 30yr · 1.5% tax · 5.0% vac · 8.0% maint · 8.0% mgmt
Financing live
Cash to close
- Down payment
- $137,575
- Closing costs
- $16,509
- Reserves months
- —
- Total cash needed
- —
Loan-product check · same deal, 3 products live
Conventional
25% down · 7.5% · 30yr
- Down + closing
- —
- Monthly P&I
- —
- Monthly cashflow
- —
- DSCR
- —
- Eligible?
- —
Personal DTI + credit; lowest rate.
DSCR
20% down · 8.5% · 30yr
- Down + closing
- —
- Monthly P&I
- —
- Monthly cashflow
- —
- DSCR
- —
- Eligible?
- —
No personal income docs; deal must DSCR.
Hard money
10% down · 12.0% · 12mo
- Down + closing
- —
- Monthly P&I
- —
- Monthly cashflow
- —
- DSCR
- —
- Eligible?
- —
Short-term bridge; refi at stabilization.
Rent comps 2 comps
| Address | Beds | Baths | Sqft | Rent | $/sqft | DOM | Units | Dist |
|---|---|---|---|---|---|---|---|---|
| 111 S Winterport Cir Spring, TX | 3.0 | 3.0 | 2386 | $2,850 | $1.19 | 43d | 1 | 0.62mi |
| 35 Alden Glen Dr Spring, TX | 5.0 | 3.0 | 2676 | $10,750 | $4.02 | 24d | 1 | 0.96mi |
HOA detail
- Monthly dues
- $92 · $1,104/yr
- Likely covers
- pool
Listing history 24 events
-
2026-06-18days on market $550,300 Active 62 DOM
-
2026-06-17days on market $550,300 Active 61 DOM
-
2026-06-16days on market $550,300 Active 60 DOM
-
2026-06-15days on market $550,300 Active 59 DOM
-
2026-06-13pricedays on market $550,300 Active 57 DOM
-
2026-06-09days on market $569,900 Active 53 DOM
-
2026-06-08days on market $569,900 Active 52 DOM
-
2026-06-07days on market $569,900 Active 51 DOM
-
2026-06-04days on market $569,900 Active 48 DOM
-
2026-06-03days on market $569,900 Active 47 DOM
-
2026-06-02days on market $569,900 Active 46 DOM
-
2026-06-01days on market $569,900 Active 45 DOM
-
2026-05-31days on market $569,900 Active 44 DOM
-
2026-05-15price $569,900 757-char remark
Show marketing remark (757 chars)
This four-bedroom, 2.5-bathroom home is located in the desirable Woodlands Village Alden Bridge neighborhood. The interior features a primary suite designed for convenience, complete with a dedicated primary bathroom and a large walk-in closet. The kitchen is equipped with functional laminate countertops and modern stainless steel appliances, providing a practical space for daily meal preparation. The location is a standout feature, allowing you to enjoy an active lifestyle with easy access to neighborhood amenities, including nearby parks, scenic walking paths, and a community pool—all within walking distance. Shopping, dining, and major thoroughfares are just moments away, making commuting a breeze. Schedule your private showing today!
-
2026-04-17$574,500 Active 757-char remark
Show marketing remark (757 chars)
This four-bedroom, 2.5-bathroom home is located in the desirable Woodlands Village Alden Bridge neighborhood. The interior features a primary suite designed for convenience, complete with a dedicated primary bathroom and a large walk-in closet. The kitchen is equipped with functional laminate countertops and modern stainless steel appliances, providing a practical space for daily meal preparation. The location is a standout feature, allowing you to enjoy an active lifestyle with easy access to neighborhood amenities, including nearby parks, scenic walking paths, and a community pool—all within walking distance. Shopping, dining, and major thoroughfares are just moments away, making commuting a breeze. Schedule your private showing today!
-
2021-12-16historical
-
2021-11-27status Active
-
2021-11-17status Option Pending
-
2021-09-17price $379,900
-
2021-09-03price $394,900
-
2021-08-20price $409,900
-
2021-08-06price $419,900
-
2021-07-22$432,900 Active
-
2021-06-16soldstatus
ⓘ Source: listings_history table (triggers on properties + properties_extension) + one-shot
backfill from property_details.listing_events for pre-trigger history.
Tax reassessment forecast TX · Resets to sale price
- Current annual tax
- $8,550 · $713/mo
- Projected year-2 tax
- $10,070 · $839/mo
- Expected delta
- +$1,520/yr (+$127/mo · 17.8%)
ⓘ Screening estimate from a state-policy table — verify with the county assessor before closing.
Climate risk First Street
- Flood 1/10 Low FEMA zone X (unshaded) · 0% chance over 30 yrs
- Wildfire 1/10 Low
- Heat 8/10 Severe 7 d/yr ≥111°F today · 24 d/yr by 30 yrs out
- Wind 8/10 Severe 99% chance of damaging wind over 30 yrs
- Air quality 3/10 Moderate 2 unhealthy d/yr today · 3 by 30 yrs out
Nearby sold comps map
Loading sold comps map…
Walkable amenities ~0.75 mi
Loading nearby amenities…
Taxation est. · year 1
- Rental income
- $54,577
- − Mortgage interest
- −$30,825
- − Property taxes
- −$8,550
- − Insurance
- −$2,752
- − Repairs & maintenance
- −$4,366
- − Management
- −$4,366
- − HOA
- −$1,104
- − Depreciation
- −$16,009
- Taxable loss
- −$13,395
- Est. tax savings @ 24.0%
- +$3,215
- After-tax cash flow
- $-705/yr
For passive investors: Depreciation is non-cash, so a rental often shows a tax loss while cash-flowing — sheltering income. Rental losses are passive: they offset passive income freely, and up to $25,000/yr can offset ordinary (W-2) income if you actively participate and your MAGI is under $100k (phasing out to $0 by $150k); unused losses carry forward. On sale, claimed depreciation is recaptured at up to 25%, and gains may owe capital-gains tax (a 1031 exchange can defer both). Figures are a year-1 estimate at your 24.0% rate — not tax advice; consult a CPA.
Schools (NCES district)
- District
- Conroe ISD
- NCES district ID
- 4815000
- Math proficiency
- 57% ▼ -6.00%
- Reading proficiency
- 57% ▼ -1.00%
- Median HH income
- $71,541
- Composite
- 50.65/100
- National rank
- #1833
- State rank
- #69 of 826 in TX
Livability — The Woodlands
- Score
- 91/100
- State rank
- #1
- US rank
- #47
Category grades
Schools grade is shown separately in the Schools card above.
Census & demographics
- Census place
- The Woodlands, TX
- County
- Montgomery County · 663,713 people
- City population
- 106,505
- Metro
- Houston-The Woodlands-Sugar Land, TX
- Population (ZIP)
- 38,986
- Household income
- $162,384
- Rent vs Own
- Severe rent burden
- 616.0
Population outlook (Montgomery County) Hauer SSP2
- Today (2025)
- 713,896 people
- By 2030
- 805,263 · +12.8%
- By 2040
- 992,708 · +39.1%
- By 2050
- 1,179,590 · +65.2%
- By 2075
- 1,628,084 · +128.1%
- By 2100
- 1,937,880 · +171.5%
Race, ethnicity, and origin ACS 2023
- Neighborhood character
- Predominantly White (67%)
- Race & ethnicity
- White 67% Hispanic / Latino 16% Two or more races 15% Asian 9% Black 4%
- Hispanic origin (detail)
- Mexican 11%
- Common ancestry
- Lithuanian 6% Slovak 3% Romanian 2%
- Foreign-born
- 19% · Canada, China, Dominican Republic
- Languages at home
- 81% English-only · Spanish 10% Chinese 3% Other Indo-European 2%
Political lean MEDSL · Montgomery
- 2024 margin
- Solid R (+45.5) · D 26.8% · R 72.3%
- 2008→2024 swing
- +7.2pp toward D · 2008: -52.7pp · 2024: -45.5pp
- All cycles
- 2024: R+45.5 2020: R+43.8 2016: R+51.4 2012: R+60.7 2008: R+52.7
Not yet ingested
- Civics
- —
Market trends
- HPI YoY
- ▼ -45.44%
- Current HPI
- 233.2304
- Rent YoY
- ▲ 1.25%
- Metro
- Houston-The Woodlands-Sugar Land, TX
- State GDP YoY
- ▲ 3.95%
- F500 in state
- 110
Industry mix (Fortune 500 HQ in TX)
| Industry | F500 HQs | Revenue |
|---|---|---|
| Energy | 16 | $1,198B |
|
||
| Technology | 5 | $198B |
|
||
| Engineering / Construction | 4 | $72B |
|
||
| Energy Services | 3 | $60B |
|
||
| Utilities | 3 | $41B |
|
||
| Healthcare | 2 | $330B |
|
||
Price history
+31.6% since first listed11 events — show timeline
- 2026-05-15 Price Changed $569,900 HARMLS
- 2026-04-17 Listed $574,500 HARMLS
- 2021-12-16 Listing Removed — HARMLS
- 2021-11-27 Relisted — HARMLS
- 2021-11-17 Pending — HARMLS
- 2021-09-17 Price Changed $379,900 HARMLS
- 2021-09-03 Price Changed $394,900 HARMLS
- 2021-08-20 Price Changed $409,900 HARMLS
- 2021-08-06 Price Changed $419,900 HARMLS
- 2021-07-22 Listed $432,900 HARMLS
- 2021-06-16 Sold (Public Records) — Public Records
Property tax history
+4.3%/yrLatest (2025): $8,550 · +8.9% YoY. Source: county tax records.
Cash-flow waterfall
monthlySold comps — $/sqft
last 12 mo · ≤1 miLoading sold comps…