 🏷️ Likely Rental
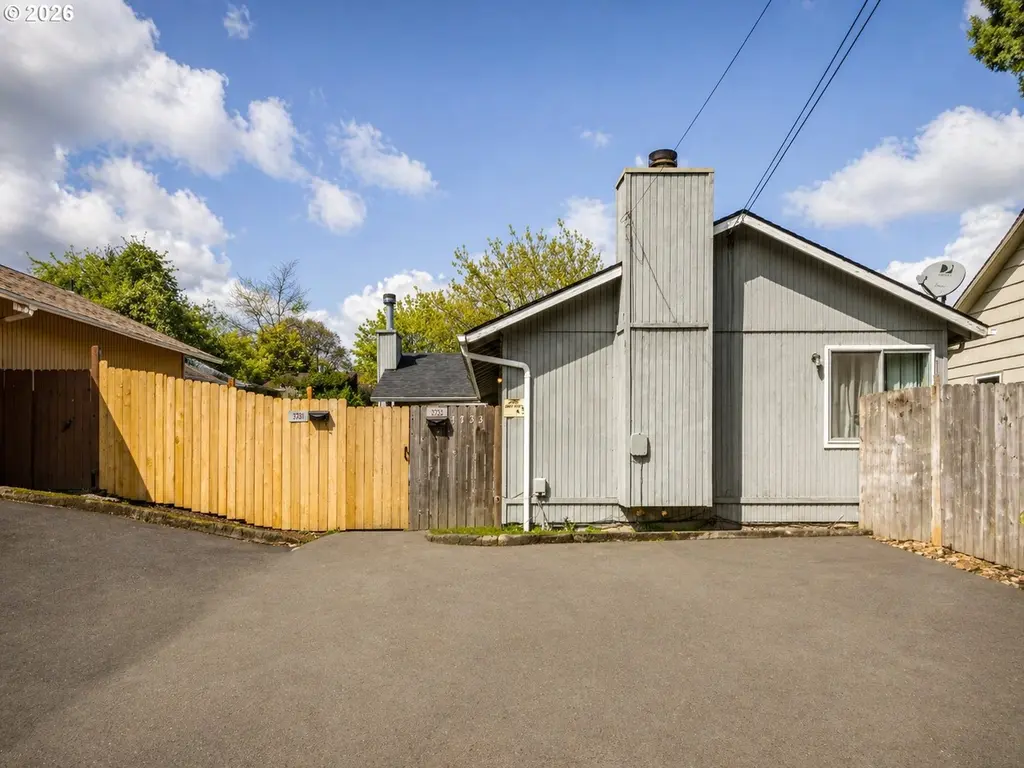
3731 NE 82nd Ave · Portland, OR
Flood risk 1/10 · Minimal
- FEMA flood zone
- X (unshaded)
- Chance of flooding over 30 yrs
- 0.0%
- Est. flood insurance / yr
- $507 – $1,088
Fire risk 1/10 · Minimal
- Est. fire insurance / yr
- $498 – $926
Heat risk 3/10 · Minor
- Hot days now (above 91°F)
- 7 days/yr
- Hot days in 30 yrs
- 15 days/yr
Wind risk 1/10 · Minimal
- Chance of severe wind over 30 yrs
- —
Air-quality risk 10/10 · Severe
- Unhealthy air days now
- 20 days/yr
- Unhealthy air days in 30 yrs
- 21 days/yr
Risk factors via First Street. Map © Google.
Why this score? — see what drove the C grade
The composite is a weighted blend of 9 inputs, each scored 0–100. Each bar is that input's sub-score; the figure is the points it added to the 100-point composite (weight × sub-score).
- Cash flow +17.9/30.0
- ARV discount +15.0/15.0
- DSCR +5.6/10.0
- 1% rule +4.8/10.0
- Schools +4.7/10.0
- Livability +3.9/5.0
- Rent growth +2.6/5.0
- Condition / age +2.2/5.0
- Appreciation +0.0/10.0
$430,000
🖨 Deal sheet 📄 Offer letter ✓ Due diligence
Multi-family units
County records classify this as Multi-Family (2-4 Unit). Listing-text estimate: 2 units. confirmed
Listing remarks
ATTN: Househackers! Here's a great spot to build equity with this duplex at the corner of upper Sandy and 82nd. Long term tenants under market value rent, on month-to-month tenancy. Rental comps come in at $1900 per month, per side. Cap rate with market value rents comes in at 6.27%. Tenants pay all utilities. Quick access to 205, commuting, great eats, and forest bathing in the Grotto. Mirroring layouts for units. This area sits near the cultural energy of the Jade District—one of Portland’s most diverse and entrepreneurial districts. Live in one side and stabilize your costs, rent both units later, hold as a long-term investment, or leverage appreciation as the corridor evolve
Key facts
- Mirroring layouts
- Duplex
- Quick access to 205
Tags
Property features AI
Finance
- Other: Zoning: R2
- Financial info: Rent includes trash collection; Cap rate 4.35; Gross rent multiplier 22.97; Unit rents reported: one unit at $1,250; two units at $1,180 each
- HOA & community: Community commons
Exterior
- Parking: Off-street paved parking; Three parking spaces
- Security: Sidewalk (listed under security features)
- Utilities: Public water; Public sewer; Electric service; Internet: Cable and DSL
- Home design: Multi-family property; Not attached to other properties; Existing condition; Built in 1978
- Construction: Concrete perimeter foundation
- Exterior features: T-111 siding; Composition roof; Level lot; On busline; Territorial view; Sidewalk on property (security feature)
Interior
- Kitchen: Range; Refrigerator
- Bedrooms: Two 2-bedroom units; One 2-bedroom unit (total three units: one unit type with 1 unit, other unit type with 2 units)
- Bathrooms: Each unit has one bathroom
- Heating & cooling: Baseboard heating; No central cooling; Electric fuel
- Interior features: Crawl space basement; No built-in storage noted; Unfurnished units
- Laundry & utility: Washer/Dryer hookup in units; Electric hot water
Neighborhood map
What this means for you Summary
Snapshot
- This is a 2 × 3-bed/1.5-bath units multifamily listed at $430k. Condition is rated fair.
Deal economics
- At list price, monthly cash flow is $362 ($4k/yr) — positive. Per door: $181/mo.
- The deal already cash-flows at list — no discount required.
- To meet the 1% rule (rent ≥ 1% of price), the offer needs to be $422k (1.9% below list).
- Recommended offer: $417k (3.0% below list) — sets the bar for market timing.
- Cap rate 7.3% vs local median 2.2% in Portland — top-decile yield for the area; either an underpriced asset or a hidden risk that comps aren't pricing in. Stress-test before assuming the spread holds.
Location & tenants
- Location reads 77/100 on livability (#72 in OR, #3,256 nationally) — a middle-class / working-renter tenant base. Strengths: amenities A+, commute A+, health & safety A+; Watch: crime F, cost of living F.
- Portland SD 1J (urban): math 46% / reading 58% proficiency, ranked #23 of 183 in OR (top 13%) — acceptable for families but not a draw, mixed tenant base, ~2y average lease.
- Zoned schools: Roseway Heights School (576 students, 66% FRL); Leodis V. Mcdaniel High School (1,440 students, 65% FRL) — zoned schools average 65% FRL vs 37% district-wide (29 pts higher); higher-poverty schools than district average — tighter screening recommended.
- Market conditions: Rents flat; 130 active listings in the ZIP; 2,041 units permitted in Multnomah County in 2024 (905 in 5+ unit buildings).
- At $4,220/mo this rent would consume 72% of the median local household income ($70k/yr) (locally 1370% of renters already pay >50% of income on rent) — very limited rent-growth headroom before tenants either downsize or default.
Forward outlook
- Local home prices are declining (-3.0%/yr); year-one equity from $3k of loan paydown is wiped out by about $13k of value loss. Plan a longer hold.
- Multnomah County population projected at +33% by 2050 — long-run rental-demand tailwind backs the buy-and-hold thesis.
Negotiation context
- It's been on market 38 days — a 3% lower offer ($417k) is reasonable based on typical stale-listing flexibility.
- 2 sale attempts; this cycle's ask has dropped $69k (14%) from the opening price — seller is motivated, your offer sets the floor, not the list.
Questions for the listing agent
- It's been on market 38 days. Have you received any prior offers? Is the seller open to a 3% concession, seller financing, or rate buy-down credit?
- Can we see the unit-by-unit rent roll, current vacancy, and any below-market leases? What's the average tenancy length?
- What capital expenditures (roof, boiler, parking lot, exteriors) have been made in the last 5 years, and what's planned in the next 2?
- Have any recent inspections been done? Can we get a copy of the seller's disclosures and any deferred-maintenance estimates?
- Built in 1978 — when were the roof, HVAC, electrical panel, plumbing, and water heater last replaced?
- Is there a deadline driving the sale (1031 exchange, divorce, estate, relocation)? That informs how much negotiation room exists.
- Crime grade is F in this area — have there been break-ins, vandalism, or insurance claims at this property in the last 3 years? What carrier currently insures it and at what premium?
- What's the average days-on-market for RENTAL listings here right now (not sales)? A rising rental-DOM trend means longer vacancies and softer asking-rent achievability than the comps imply.
- What's the recent tenant-quality profile in this submarket — average credit score on applications, eviction rate, late-payment / NSF rate, and stable-employment percentage? A property-management company in the area should have these aggregated.
- How much new apartment / multifamily construction is in the pipeline within 1–3 miles? Heavy new supply (>2% of stock underway) typically softens rents 12–24 months out; light construction supports rent growth.
Investment metrics
- 1% rule
- 0.98% ✗
- Cap rate
- 7.30%
- Cash-on-cash
- 3.61%
- DSCR
- 1.16
- GRM
- 8.5
CMA / ARV
- ARV (median comp)
- $621,943
- List price
- $430,000
- Delta
- -30.86%
- Verdict
- UNDERPRICED
- Comps
- 13 within 1.0 mi
Show comp detail 2 sales within ~0.75 mi
| Address | Dist | Beds/Ba | Sqft | Sold | Price | $/sf | Match |
|---|---|---|---|---|---|---|---|
| 8024 NE Fremont St | 0.15mi | 6/3.0 | 1,660 | 10mo | $380,000 | $229 | 72 |
| 8541 NE Russell St | 0.67mi | 6/5.0 | 3,871 | 13mo | $624,990 | $161 | 38 |
Match score weights: distance 35% · size 25% · config 20% · recency 20%. Top-matched comps best support the ARV.
Projected returns pro-forma
-3.0% appreciation · 0.35% rent growth · sell at horizon
- IRR
- -13.6%
- Equity multiple
- 0.52×
- Total profit
- $-57,510
- Equity at exit
- $64,114
- IRR
- -9.6%
- Equity multiple
- 0.48×
- Total profit
- $-62,776
- Equity at exit
- $37,179
Cash invested: $120,400 (down + closing). Projections, not guarantees.
Landlord ↔ Tenant lean methodology
- Overall (CITY)
- 0 Strongly Tenant-Friendly
- State Oregon
- 28 Tenant-Leaning · D+6
- County
- — inherits STATE
- City Portland
- 0 Strongly Tenant-Friendly · D+39
ZIP-level market 97220
- Rents YoY
- 0.3%
- Active inventory
- 130
- Price-to-rent
- 17.0×
Monthly cashflow live
- Estimated rent
- $4,220 high interval (Pro) →
- Mortgage (P&I)
- −$2,255
- Tax est. 1.5%
- −$538 /mo · $6,450/yr
- Insurance
- −$179
- HOA
- −$0
- Vacancy / Maint / Mgmt
- −$886
- Net cashflow
- $362
Break-even live
2-unit breakdown (identical units grouped — click to expand)
| Units | Beds | Baths | Est. rent |
|---|---|---|---|
| 2× units | 3 | 1.5 | $4,220 |
| #1 | 3 | 1.5 | $2,110 |
| #2 | 3 | 1.5 | $2,110 |
| Total (2 units) | $4,220 | ||
UW: 25.0% down · 7.5% · 30yr · 1.5% tax · 5.0% vac · 8.0% maint · 8.0% mgmt
Financing live
Cash to close
- Down payment
- $107,500
- Closing costs
- $12,900
- Reserves months
- —
- Total cash needed
- —
Loan-product check · same deal, 3 products live
Conventional
25% down · 7.5% · 30yr
- Down + closing
- —
- Monthly P&I
- —
- Monthly cashflow
- —
- DSCR
- —
- Eligible?
- —
Personal DTI + credit; lowest rate.
DSCR
20% down · 8.5% · 30yr
- Down + closing
- —
- Monthly P&I
- —
- Monthly cashflow
- —
- DSCR
- —
- Eligible?
- —
No personal income docs; deal must DSCR.
Hard money
10% down · 12.0% · 12mo
- Down + closing
- —
- Monthly P&I
- —
- Monthly cashflow
- —
- DSCR
- —
- Eligible?
- —
Short-term bridge; refi at stabilization.
Listing history 12 events
-
2026-06-18days on market $430,000 Active 38 DOM
-
2026-06-17days on market $430,000 Active 37 DOM
-
2026-06-16days on market $430,000 Active 36 DOM
-
2026-06-15days on market $430,000 Active 35 DOM
-
2026-06-13days on market $430,000 Active 33 DOM
-
2026-06-09days on market $430,000 Active 29 DOM
-
2026-06-08days on market $430,000 Active 28 DOM
-
2026-06-07statusdays on market $430,000 Active 27 DOM
-
2026-06-02status $430,000 Pending 24 DOM
-
2026-06-01days on market $430,000 Active 24 DOM
-
2026-05-31days on market $430,000 Active 23 DOM
-
2026-05-08$499,000 Active 701-char remark
ⓘ Source: listings_history table (triggers on properties + properties_extension) + one-shot
backfill from property_details.listing_events for pre-trigger history.
Climate risk First Street
- Flood 1/10 Low FEMA zone X (unshaded) · 0% chance over 30 yrs
- Wildfire 1/10 Low
- Heat 3/10 Moderate 7 d/yr ≥91°F today · 15 d/yr by 30 yrs out
- Wind 1/10 Low
- Air quality 10/10 Extreme 20 unhealthy d/yr today · 21 by 30 yrs out
Nearby sold comps map
Loading sold comps map…
Walkable amenities ~0.75 mi
Loading nearby amenities…
Taxation est. · year 1
- Rental income
- $50,640
- − Mortgage interest
- −$24,087
- − Property taxes
- −$6,450
- − Insurance
- −$2,150
- − Repairs & maintenance
- −$4,051
- − Management
- −$4,051
- − Depreciation
- −$12,509
- Taxable loss
- −$2,658
- Est. tax savings @ 24.0%
- +$638
- After-tax cash flow
- $4,984/yr
For passive investors: Depreciation is non-cash, so a rental often shows a tax loss while cash-flowing — sheltering income. Rental losses are passive: they offset passive income freely, and up to $25,000/yr can offset ordinary (W-2) income if you actively participate and your MAGI is under $100k (phasing out to $0 by $150k); unused losses carry forward. On sale, claimed depreciation is recaptured at up to 25%, and gains may owe capital-gains tax (a 1031 exchange can defer both). Figures are a year-1 estimate at your 24.0% rate — not tax advice; consult a CPA.
Condition & rehab AI · 12 photos
This multi-family property requires moderate renovations to update the kitchen and bathrooms, repair the exterior, and paint the interior. These updates would significantly increase its value for both resale and rental purposes.
Repairs flagged
- Moderate kitchen cabinets — dated and in need of replacement
- Moderate bathroom fixtures — basic and outdated
- Minor exterior siding — slight wear
- Minor fence — slight damage
Value-add opportunities
- Both update kitchen cabinets and appliances — modernizing the kitchen would improve both resale and rental value
- Both replace outdated bathroom fixtures — modernizing the bathrooms would improve both resale and rental value
- Both repair and paint exterior siding — improving the exterior would enhance curb appeal and increase both resale and rental value
Renovation cost estimate screening
| Repair item | Severity | Est. cost |
|---|---|---|
| kitchen cabinets · dated and in need of replacement | Moderate | $3,000–15,000 |
| bathroom fixtures · basic and outdated | Moderate | $3,000–15,000 |
| exterior siding · slight wear | Minor | $500–3,000 |
| fence · slight damage | Minor | $500–3,000 |
| Total estimated repair cost · 4 items | $7,000–36,000 |
Value-add ROI direction
- Both update kitchen cabinets and appliances — modernizing the kitchen would improve both resale and rental value ↑
- Both replace outdated bathroom fixtures — modernizing the bathrooms would improve both resale and rental value ↑
- Both repair and paint exterior siding — improving the exterior would enhance curb appeal and increase both resale and rental value ↑
ⓘ Cost ranges are severity-bucket heuristics (US national rule-of-thumb). Get contractor quotes + a written scope before underwriting a rehab budget.
Schools (NCES district)
- District
- Portland SD 1J
- NCES district ID
- 4110040
- Math proficiency
- 46% ▼ -2.00%
- Reading proficiency
- 58% ▼ -3.00%
- Median HH income
- $57,851
- Composite
- 47.1/100
- National rank
- #5112
- State rank
- #23 of 183 in OR
Livability — Portland
- Score
- 77/100
- State rank
- #72
- US rank
- #3256
Category grades
Schools grade is shown separately in the Schools card above.
Census & demographics
- Census place
- Portland, OR
- County
- Multnomah County · 786,692 people
- City population
- 774,334
- Metro
- Portland-Vancouver-Hillsboro, OR-WA
- Population (ZIP)
- 27,202
- Household income
- $70,137
- Rent vs Own
- Severe rent burden
- 1370.0
Population outlook (Multnomah County) Hauer SSP2
- Today (2025)
- 930,825 people
- By 2030
- 996,904 · +7.1%
- By 2040
- 1,121,379 · +20.5%
- By 2050
- 1,242,124 · +33.4%
- By 2075
- 1,464,431 · +57.3%
- By 2100
- 1,576,181 · +69.3%
Race, ethnicity, and origin ACS 2023
- Neighborhood character
- Diverse neighborhood (Simpson 0.61)
- Race & ethnicity
- White 59% Hispanic / Latino 14% Two or more races 13% Asian 12% Black 7% Native American 2%
- Hispanic origin (detail)
- Mexican 10%
- Common ancestry
- Italian 5% Portuguese 3% Slovak 2%
- Foreign-born
- 16% · Vietnam, Canada
- Languages at home
- 77% English-only · Spanish 9% Vietnamese 7% Other Asian/Pacific 2%
Political lean MEDSL · Multnomah
- 2024 margin
- Solid D (+62.1) · D 79.3% · R 17.2% · Other 3.5%
- 2008→2024 swing
- +6.0pp toward D · 2008: 56.1pp · 2024: 62.1pp
- All cycles
- 2024: D+62.1 2020: D+61.3 2016: D+58.3 2012: D+54.9 2008: D+56.1
Not yet ingested
- Civics
- —
Market trends
- HPI YoY
- ▼ -466.79%
- Current HPI
- 306.3761
- Rent YoY
- ▲ 0.35%
- Metro
- Portland-Vancouver-Hillsboro, OR-WA
- State GDP YoY
- ▲ 2.05%
- F500 in state
- 2
Industry mix (Fortune 500 HQ in OR)
| Industry | F500 HQs | Revenue |
|---|---|---|
| Consumer Goods | 1 | $51B |
|
||
Price history
-13.8% since first listed4 events — show timeline
- 2026-06-04 Relisted — RMLS
- 2026-06-01 Pending — RMLS
- 2026-05-22 Price Changed $430,000 RMLS
- 2026-05-08 Listed $499,000 RMLS
Cash-flow waterfall
monthlySold comps — $/sqft
last 12 mo · ≤1 miLoading sold comps…