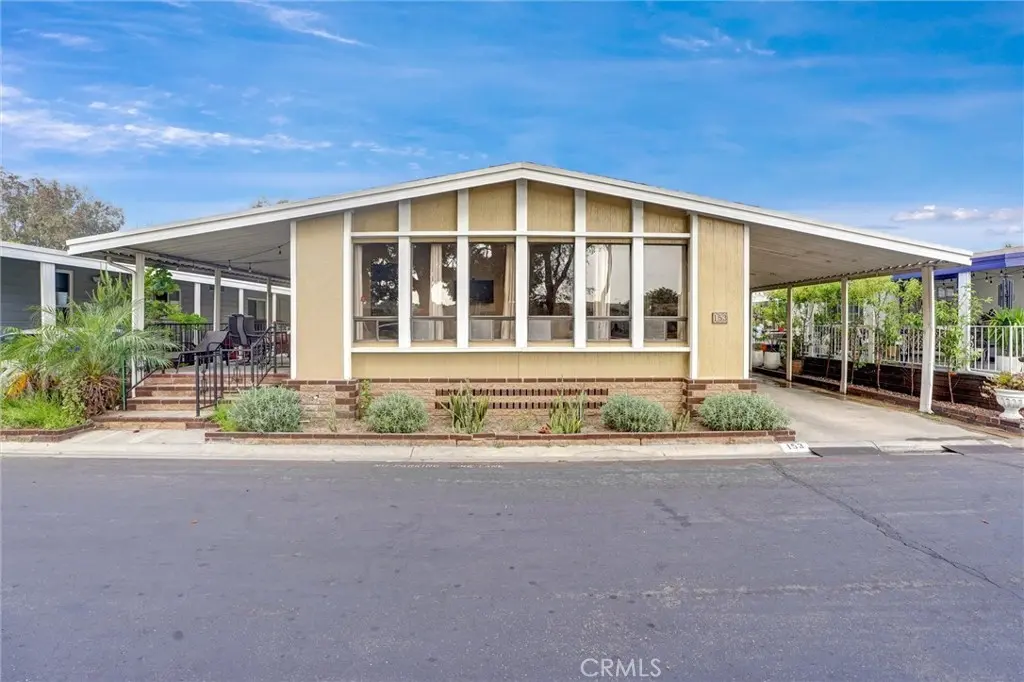
1919 W Coronet Ave #153 · Anaheim, CA
Flood risk 1/10 · Minimal
- FEMA flood zone
- X (shaded)
- Chance of flooding over 30 yrs
- 0.0%
- Est. flood insurance / yr
- $507 – $1,088
Fire risk 1/10 · Minimal
- Est. fire insurance / yr
- $659 – $1,223
Heat risk 6/10 · Moderate
- Hot days now (above 91°F)
- 7 days/yr
- Hot days in 30 yrs
- 23 days/yr
Wind risk 1/10 · Minimal
- Chance of severe wind over 30 yrs
- —
Air-quality risk 5/10 · Moderate
- Unhealthy air days now
- 7 days/yr
- Unhealthy air days in 30 yrs
- 9 days/yr
Risk factors via First Street. Map © Google.
Why this score? — see what drove the B grade
The composite is a weighted blend of 9 inputs, each scored 0–100. Each bar is that input's sub-score; the figure is the points it added to the 100-point composite (weight × sub-score).
- Cash flow +30.0/30.0
- 1% rule +10.0/10.0
- DSCR +10.0/10.0
- ARV discount +9.8/15.0
- Rent growth +3.8/5.0
- Condition / age +3.8/5.0
- Livability +3.5/5.0
- Schools +2.3/10.0
- Appreciation +0.0/10.0
$310,000
🖨 Deal sheet 📄 Offer letter ✓ Due diligence
Listing remarks
Welcome to the Anaheim Shores Estates conveniently located next to 5/91 freeways, shopping centers, and amusement parks. You will find this beautiful 3 bedroom 2 bath home tucked away in the Windlass cul-de-sac right next to plenty of visitor parking spaces. This home offers a spacious and open layout featuring laminate wood floors, central air conditioning, and a modernized kitchen. Enjoy your newly remodeled kitchen boasting a breakfast nook resessed lighting, and quartz countertops. The primary suite showcases dual closets, double bathroom sinks, with a soaking tub and separate shower. The covered patio easily accessed from the sliding glass door is so inviting to host family and friend
Key facts
- Breakfast nook
- Windlass cul-de-sac
- Modernized kitchen
Tags
Property features AI
Finance
- Other: Directions: 91 fwy exit Euclid, head south on Euclid, right on Medical Center, Anaheim Shores on right
- Financial info: Land lease: $1,725 monthly (park-provided); Rent includes pool
- HOA & community: Community park; Park name: Anaheim Shores Estate; Manager approval required
Exterior
- Parking: Attached carport
- Utilities: Public sewer; District/public water
- Home design: Single-story mobile home (12' x 60'); Entry level: 1; Mobile home remains on site
- Construction: Seller-provided year built; Seller-reported living area
- Exterior features: Covered concrete patio; In-ground community pool; Shed; Located on a cul-de-sac; Close to clubhouse
Interior
- Kitchen: Quartz counters
- Bedrooms: Jack & Jill bedroom arrangement
- Flooring: Carpet; Laminate
- Bathrooms: Two full bathrooms; Double sinks in master bathroom
- Heating & cooling: Central cooling
- Interior features: Quartz counters; Ceiling fan; Recessed lighting; Open floor plan; One level entry
- Laundry & utility: Laundry inside
Neighborhood map
What this means for you Summary
Snapshot
- This is a 3-bed/2.0-bath manufactured listed at $310k. Condition is rated good.
Deal economics
- At list price, monthly cash flow is $2k ($22k/yr) — positive.
- The deal already cash-flows at list — no discount required.
- Meets the 1% rule at list price ($5k rent vs $310k).
- Recommended offer: $291k (6.0% below list) — sets the bar for market timing.
- Cap rate 13.3% vs local median 2.2% in Anaheim — top-decile yield for the area; either an underpriced asset or a hidden risk that comps aren't pricing in. Stress-test before assuming the spread holds.
Location & tenants
- Location reads 70/100 on livability (#240 in CA) — a middle-class / working-renter tenant base. Strengths: amenities A+, commute A+, employment A+; Watch: health & safety C-, crime F, cost of living F.
- Anaheim Elementary (urban): math 25% / reading 25% proficiency, ranked #386 of 517 in CA (top 75%) — low school quality limits family demand, transient renter base, plan for 1-2y turnover; 73% free/reduced lunch — lower-income household profile, screen leases tightly.
- Market conditions: Rents rising fast (+5.1%/yr); 72 active listings in the ZIP; 17 comparable units currently listed for rent nearby; rentals leasing fast (median 3d on market — plan ~1-2 weeks tenant-placement turnaround); solid renter incomes; 6,974 units permitted in Orange County in 2024 (3,839 in 5+ unit buildings).
- At $4,991/mo this rent would consume 72% of the median local household income ($84k/yr) (locally 3604% of renters already pay >50% of income on rent) — very limited rent-growth headroom before tenants either downsize or default.
Forward outlook
- Local home prices are declining (-3.0%/yr); year-one equity from $2k of loan paydown is wiped out by about $9k of value loss. Plan a longer hold.
- Orange County population projected at +14% by 2050 — modest demand growth; plan on rents tracking national, not racing it.
- At projected returns (-3.0% appreciation + 5.1% rent growth), your $87k cash investment doubles in ~5 years — after that, you're playing with house money.
Negotiation context
- It's been on market 76 days — a 6% lower offer ($291k) is reasonable based on typical stale-listing flexibility.
- 2 sale attempts since 19y ago with the ask held roughly flat each time — persistent listings suggest the price (not the market) is what's stuck; bring a comps-based counter.
Risks & watch-outs
- Climate carrying-cost: extreme-heat days projected 7→23/yr by 2055 (HVAC capex compounding) — expect insurance premiums to compound above CPI over the hold.
Questions for the listing agent
- It's been on market 76 days. Have you received any prior offers? Is the seller open to a 6% concession, seller financing, or rate buy-down credit?
- Why hasn't it sold? Are there any deal-killer items the seller is aware of (foundation, flood, title, zoning, code violations)?
- Is there a deadline driving the sale (1031 exchange, divorce, estate, relocation)? That informs how much negotiation room exists.
- Crime grade is F in this area — have there been break-ins, vandalism, or insurance claims at this property in the last 3 years? What carrier currently insures it and at what premium?
- What's the average days-on-market for RENTAL listings here right now (not sales)? A rising rental-DOM trend means longer vacancies and softer asking-rent achievability than the comps imply.
- What's the recent tenant-quality profile in this submarket — average credit score on applications, eviction rate, late-payment / NSF rate, and stable-employment percentage? A property-management company in the area should have these aggregated.
- How much new for-sale + rental construction is in the pipeline within 1–3 miles? Heavy new supply typically softens prices + rents 12–24 months out; constrained supply supports both.
Investment metrics
- 1% rule
- 1.61% ✓
- Cap rate
- 13.26%
- Cash-on-cash
- 24.89%
- DSCR
- 2.11
- GRM
- 5.2
CMA / ARV
- ARV (on-the-fly)
- $326,800
- Comps found
- 12
Show comp detail 12 sales within ~0.75 mi
| Address | Dist | Beds/Ba | Sqft | Sold | Price | $/sf | Match |
|---|---|---|---|---|---|---|---|
| 1919 W Coronet Ave W #208 | 0.00mi | 3/2.5 | 1,896 (-0%) | 7mo | $269,000 | $142 | 92 |
| 1919 W Coronet Ave #190 | 0.00mi | 2/2.0 (-1) | 1,840 (-3%) | 1mo | $262,500 | $143 | 89 |
| 1919 W Coronet Ave #224 | 0.00mi | 2/2.0 (-1) | 1,900 (0%) | 8mo | $280,000 | $147 | 88 |
| 1919 W Coronet Ave #164 | 0.00mi | 3/2.0 | 1,800 (-5%) | 6mo | $306,000 | $170 | 87 |
| 1919 W Coronet Ave #221 | 0.00mi | 2/2.0 (-1) | 1,840 (-3%) | 6mo | $290,000 | $158 | 84 |
| 1919 W Coronet Ave #1 | 0.00mi | 3/2.0 | 2,040 (+7%) | 6mo | $350,000 | $172 | 82 |
| 1919 W Coronet Ave #214 | 0.00mi | 3/2.0 | 1,680 (-12%) | 4mo | $329,900 | $196 | 77 |
| 1919 W Coronet #192 | 0.00mi | 2/2.0 (-1) | 1,700 (-10%) | 0mo | $299,800 | $176 | 77 |
| 1919 W Coronet Ave #22 | 0.00mi | 3/2.0 | 2,100 (+10%) | 14mo | $355,000 | $169 | 70 |
| 1919 W Coronet #62 | 0.00mi | 2/2.0 (-1) | 1,710 (-10%) | 11mo | $320,000 | $187 | 69 |
| 1919 Coronet Ave W #112 | 0.00mi | 3/2.0 | 1,680 (-12%) | 15mo | $315,000 | $188 | 68 |
| 1919 Coronet Ave Spc155 | 0.00mi | 2/2.0 (-1) | 1,710 (-10%) | 13mo | $310,000 | $181 | 67 |
Match score weights: distance 35% · size 25% · config 20% · recency 20%. Top-matched comps best support the ARV.
Projected returns pro-forma
-3.0% appreciation · 5.13% rent growth · sell at horizon
- IRR
- 20.7%
- Equity multiple
- 1.87×
- Total profit
- $75,420
- Equity at exit
- $46,222
- IRR
- 30.3%
- Equity multiple
- 4.00×
- Total profit
- $260,434
- Equity at exit
- $26,803
Cash invested: $86,800 (down + closing). Projections, not guarantees.
Landlord ↔ Tenant lean methodology
- Overall (STATE)
- 18 Strongly Tenant-Friendly
- State California
- 18 Strongly Tenant-Friendly · D+13
- County
- — inherits STATE
- City
- — inherits STATE
ZIP-level market 92801
- Rents YoY
- 5.1%
- Active inventory
- 72
- Price-to-rent
- 5.2×
Monthly cashflow live
- Estimated rent
- $4,991 high interval (Pro) →
- Mortgage (P&I)
- −$1,626
- Tax est. 1.5%
- −$388 /mo · $4,650/yr
- Insurance
- −$129
- HOA
- −$0
- Vacancy / Maint / Mgmt
- −$1,048
- Net cashflow
- $1,800
Break-even live
UW: 25.0% down · 7.5% · 30yr · 1.5% tax · 5.0% vac · 8.0% maint · 8.0% mgmt
Financing live
Cash to close
- Down payment
- $77,500
- Closing costs
- $9,300
- Reserves months
- —
- Total cash needed
- —
Loan-product check · same deal, 3 products live
Conventional
25% down · 7.5% · 30yr
- Down + closing
- —
- Monthly P&I
- —
- Monthly cashflow
- —
- DSCR
- —
- Eligible?
- —
Personal DTI + credit; lowest rate.
DSCR
20% down · 8.5% · 30yr
- Down + closing
- —
- Monthly P&I
- —
- Monthly cashflow
- —
- DSCR
- —
- Eligible?
- —
No personal income docs; deal must DSCR.
Hard money
10% down · 12.0% · 12mo
- Down + closing
- —
- Monthly P&I
- —
- Monthly cashflow
- —
- DSCR
- —
- Eligible?
- —
Short-term bridge; refi at stabilization.
Rent comps 17 comps
| Address | Beds | Baths | Sqft | Rent | $/sqft | DOM | Units | Dist |
|---|---|---|---|---|---|---|---|---|
| 1406 W Roberta Ave Fullerton, CA | 3.0 | 2.5 | 1750 | $8,250 | $4.71 | 22d | 1 | 0.13mi |
| 1636 W Maxzim Ave Fullerton, CA | 4.0 | 2.0 | 1792 | $4,295 | $2.40 | 7d | 1 | 0.37mi |
| 1124 W Woodcrest Ave Fullerton, CA | 3.0 | 2.0 | 1476 | $4,500 | $3.05 | 1d | 1 | 0.41mi |
| 1612 W Hill Ave Fullerton, CA | 3.0 | 2.0 | 1453 | $3,500 | $2.41 | 24d | 1 | 0.56mi |
| 1138 N Euclid St Anaheim, CA | 3.0 | 2.5 | 1492 | $3,750 | $2.51 | 24d | 1 | 0.63mi |
| 912 W Hill Ave Fullerton, CA | 4.0 | 3.0 | 1644 | $4,500 | $2.74 | 16d | 1 | 0.72mi |
| 1211 N Siesta St Anaheim, CA | 4.0 | 2.0 | 1578 | $3,650 | $2.31 | 1d | 1 | 0.74mi |
| 1964 Glenoaks Ave Anaheim, CA | 4.0 | 2.5 | 1440 | $3,575 | $2.48 | 15d | 1 | 0.75mi |
| 686 S Euclid St Fullerton, CA | 4.0 | 3.5 | 1855 | $4,295 | $2.32 | 1d | 1 | 0.84mi |
| 1442 W Valencia Dr Fullerton, CA | 3.0 | 2.0 | 1761 | $3,750 | $2.13 | 3d | 1 | 0.85mi |
| 1024 W Romneya Dr Anaheim, CA | 2.0–3.0 | 2.0 | 1241 | $4,795 | $3.86 | 1d | 10 | 1.09mi |
| 600 W Commonwealth Ave Fullerton, CA | 3.0 | 1.0–2.0 | 1002 | $4,564 | $4.55 | 1d | 18 | 1.36mi |
| 1419 W Janeen Way Anaheim, CA | 4.0 | 2.0 | 1932 | $4,760 | $2.46 | 19d | 1 | 1.36mi |
| 2600 W Picadilly Way Anaheim, CA | 4.0 | 3.5 | 2532 | $5,300 | $2.09 | 1d | 1 | 1.40mi |
| 830 N Modena St Anaheim, CA | 4.0 | 3.0 | 1850 | $5,200 | $2.81 | 15d | 1 | 1.41mi |
| 1096 N Ivory Palm Ln Anaheim, CA | 3.0 | 2.5 | 1406 | $4,200 | $2.99 | 1d | 1 | 1.45mi |
| 527 W Victor Ave Anaheim, CA | 3.0 | 3.0 | 1420 | $13,200 | $9.30 | 1d | 1 | 1.46mi |
Listing history 17 events
-
2026-06-18days on market $310,000 Active 76 DOM
-
2026-06-17days on market $310,000 Active 75 DOM
-
2026-06-16days on market $310,000 Active 74 DOM
-
2026-06-15days on market $310,000 Active 73 DOM
-
2026-06-13days on market $310,000 Active 71 DOM
-
2026-06-13days on market $310,000 Active 70 DOM
-
2026-06-09days on market $310,000 Active 67 DOM
-
2026-06-08days on market $310,000 Active 66 DOM
-
2026-06-07days on market $310,000 Active 65 DOM
-
2026-06-04pricedays on market $310,000 Active 62 DOM
-
2026-06-03days on market $320,000 Active 61 DOM
-
2026-06-02days on market $320,000 Active 60 DOM
-
2026-06-01days on market $320,000 Active 59 DOM
-
2026-05-31days on market $320,000 Active 58 DOM
-
2026-04-03$320,000 Active
-
2007-08-13historical
-
2007-07-09$149,900
ⓘ Source: listings_history table (triggers on properties + properties_extension) + one-shot
backfill from property_details.listing_events for pre-trigger history.
Climate risk First Street
- Flood 1/10 Low FEMA zone X (shaded) · 0% chance over 30 yrs
- Wildfire 1/10 Low
- Heat 6/10 Major 7 d/yr ≥91°F today · 23 d/yr by 30 yrs out
- Wind 1/10 Low
- Air quality 5/10 Major 7 unhealthy d/yr today · 9 by 30 yrs out
Nearby sold comps map
Loading sold comps map…
Walkable amenities ~0.75 mi
Loading nearby amenities…
Taxation est. · year 1
- Rental income
- $59,887
- − Mortgage interest
- −$17,365
- − Property taxes
- −$4,650
- − Insurance
- −$1,550
- − Repairs & maintenance
- −$4,791
- − Management
- −$4,791
- − Depreciation
- −$9,018
- Taxable income
- $17,722
- Est. tax owed @ 24.0%
- −$4,253
- After-tax cash flow
- $17,349/yr
For passive investors: Depreciation is non-cash, so a rental often shows a tax loss while cash-flowing — sheltering income. Rental losses are passive: they offset passive income freely, and up to $25,000/yr can offset ordinary (W-2) income if you actively participate and your MAGI is under $100k (phasing out to $0 by $150k); unused losses carry forward. On sale, claimed depreciation is recaptured at up to 25%, and gains may owe capital-gains tax (a 1031 exchange can defer both). Figures are a year-1 estimate at your 24.0% rate — not tax advice; consult a CPA.
Condition & rehab AI · 13 photos
This well-maintained mobile home in Anaheim Shores Estates offers a good condition with a good ROI potential for both resale and rental markets.
Value-add opportunities
- Resale Painting the exterior siding — Fresh paint can enhance curb appeal and property value
- Resale Landscaping improvements — Enhanced landscaping can attract more potential buyers
- Resale Upgrading the kitchen appliances — Modern appliances can increase the home's appeal and value
Renovation cost estimate screening
Value-add ROI direction
- Resale Painting the exterior siding — Fresh paint can enhance curb appeal and property value ↑
- Resale Landscaping improvements — Enhanced landscaping can attract more potential buyers ↑
- Resale Upgrading the kitchen appliances — Modern appliances can increase the home's appeal and value ↑
ⓘ Cost ranges are severity-bucket heuristics (US national rule-of-thumb). Get contractor quotes + a written scope before underwriting a rehab budget.
Schools (NCES district)
- District
- Anaheim Elementary
- NCES district ID
- 0602610
- Math proficiency
- 25% ▼ -3.00%
- Reading proficiency
- 25% ▼ -9.00%
- Median HH income
- $55,235
- Composite
- 22.56/100
- National rank
- #8078
- State rank
- #386 of 517 in CA
Livability — Anaheim
- Score
- 70/100
- State rank
- #240
- US rank
- #7861
Category grades
Schools grade is shown separately in the Schools card above.
Census & demographics
- Census place
- Anaheim, CA
- County
- Orange County · 3,096,323 people
- City population
- 361,715
- Metro
- Los Angeles-Long Beach-Anaheim, CA
- Population (ZIP)
- 60,547
- Household income
- $83,725
- Rent vs Own
- Severe rent burden
- 3604.0
Population outlook (Orange County) Hauer SSP2
- Today (2025)
- 3,477,456 people
- By 2030
- 3,613,117 · +3.9%
- By 2040
- 3,835,945 · +10.3%
- By 2050
- 3,968,736 · +14.1%
- By 2075
- 4,097,053 · +17.8%
- By 2100
- 3,903,633 · +12.3%
Race, ethnicity, and origin ACS 2023
- Neighborhood character
- Diverse neighborhood (Simpson 0.59)
- Race & ethnicity
- Hispanic / Latino 59% Two or more races 19% Asian 19% White 16% Black 4%
- Hispanic origin (detail)
- Mexican 50%
- Common ancestry
- Russian 1% Lithuanian 1%
- Foreign-born
- 41% · Canada, Vietnam, South Korea
- Languages at home
- 30% English-only · Spanish 48% Tagalog/Filipino 5% Vietnamese 5%
Political lean MEDSL · Orange
- 2024 margin
- Toss-up / Even · D 49.7% · R 47.1% · Other 3.2%
- 2008→2024 swing
- +5.2pp toward D · 2008: -2.6pp · 2024: 2.6pp
- All cycles
- 2024: D+2.6 2020: D+9.0 2016: D+7.7 2012: R+8.3 2008: R+2.6
Not yet ingested
- Civics
- —
Market trends
- HPI YoY
- ▼ -723.92%
- Current HPI
- 446.9118
- Rent YoY
- ▲ 5.13%
- Metro
- Los Angeles-Long Beach-Anaheim, CA
- State GDP YoY
- ▲ 3.21%
- F500 in state
- 116
Industry mix (Fortune 500 HQ in CA)
| Industry | F500 HQs | Revenue |
|---|---|---|
| Technology | 27 | $1,492B |
|
||
| Financial Services | 3 | $174B |
|
||
| Retail | 3 | $44B |
|
||
| Insurance | 3 | $26B |
|
||
| Media / Entertainment | 2 | $115B |
|
||
| Pharmaceuticals / Biotech | 2 | $62B |
|
||
Price history
+113.5% since first listed3 events — show timeline
- 2026-04-03 Listed $320,000 CRMLS
- 2007-08-13 Listing Removed — CRMLS
- 2007-07-09 Listed $149,900 CRMLS
Property tax history
+0.7%/yrLatest (2025): $75 · +3.4% YoY. Source: county tax records.
Cash-flow waterfall
monthlySold comps — $/sqft
last 12 mo · ≤1 miLoading sold comps…