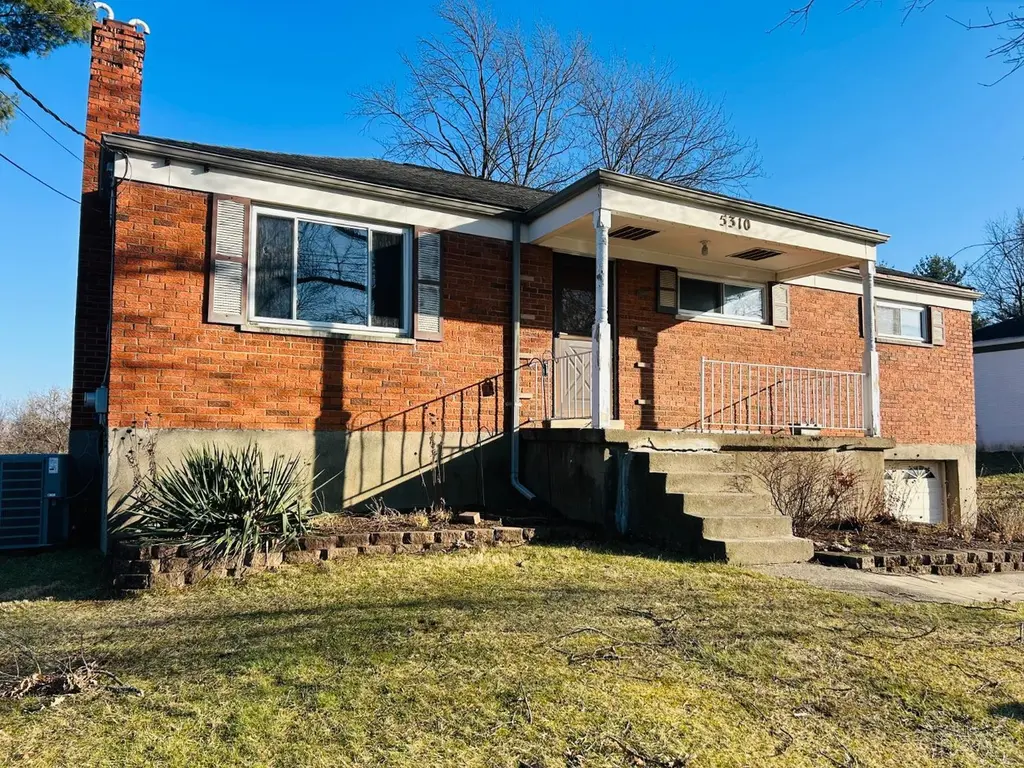
5310 Rybolt Rd · Dent, OH
Flood risk 1/10 · Minimal
- FEMA flood zone
- X (unshaded)
- Chance of flooding over 30 yrs
- 0.0%
- Est. flood insurance / yr
- $473 – $860
Fire risk 1/10 · Minimal
- Est. fire insurance / yr
- $713 – $1,323
Heat risk 4/10 · Minor
- Hot days now (above 102°F)
- 7 days/yr
- Hot days in 30 yrs
- 19 days/yr
Wind risk 2/10 · Minimal
- Chance of severe wind over 30 yrs
- 1.0%
Air-quality risk 3/10 · Minor
- Unhealthy air days now
- 2 days/yr
- Unhealthy air days in 30 yrs
- 4 days/yr
Risk factors via First Street. Map © Google.
Why this score? — see what drove the B- grade
The composite is a weighted blend of 9 inputs, each scored 0–100. Each bar is that input's sub-score; the figure is the points it added to the 100-point composite (weight × sub-score).
- Cash flow +24.4/30.0
- ARV discount +15.0/15.0
- DSCR +7.9/10.0
- 1% rule +6.8/10.0
- Schools +6.0/10.0
- Livability +3.8/5.0
- Rent growth +2.5/5.0
- Condition / age +2.5/5.0
- Appreciation +0.0/10.0
$139,900
🖨 Deal sheet 📄 Offer letter ✓ Due diligence
Listing remarks MLS
Brick three bed ranch in OHLSD with one car garage and spectacular rear yard. Bring your renovation skills and the sky is the limit. Being sold as is and priced accordingly.
Key facts
- 0.45 acre lot
- Garage
- Built 1959
Neighborhood map
What this means for you Summary
Snapshot
- This is a 3-bed/1.0-bath single-family listed at $140k.
Deal economics
- At list price, monthly cash flow is $285 ($3k/yr) — positive.
- The deal already cash-flows at list — no discount required.
- Meets the 1% rule at list price ($2k rent vs $140k).
- Recommended offer: $123k (12.0% below list) — sets the bar for market timing.
- Cap rate 8.7% vs local median 2.9% in Dent — top-decile yield for the area; either an underpriced asset or a hidden risk that comps aren't pricing in. Stress-test before assuming the spread holds.
Location & tenants
- Location reads 75/100 on livability (#245 in OH, #3,901 nationally) — a middle-class / working-renter tenant base. Strengths: crime A+, employment A+, housing A+; Watch: health & safety C-, amenities F, commute F.
- Oak Hills Local (suburban): math 68% / reading 70% proficiency, ranked #141 of 656 in OH (top 22%) — acceptable for families but not a draw, mixed tenant base, ~2y average lease.
- Market conditions: 103 active listings in the ZIP; solid renter incomes; 801 units permitted in Hamilton County in 2024 (190 in 5+ unit buildings).
Forward outlook
- Local home prices are declining (-3.0%/yr); year-one equity from $967 of loan paydown is wiped out by about $4k of value loss. Plan a longer hold.
Negotiation context
- It's been on market 161 days — a 12% lower offer ($123k) is reasonable based on typical stale-listing flexibility.
- 3 sale attempts; this cycle's ask has dropped $30k (18%) from the opening price — seller is motivated, your offer sets the floor, not the list.
- Current owner paid $80k; list at $140k implies a 74% gain — meaningful room to come down on a strong offer.
Risks & watch-outs
- Watch-outs: built in 1959 — expect roof / HVAC / electrical / plumbing capex.
Questions for the listing agent
- It's been on market 161 days. Have you received any prior offers? Is the seller open to a 12% concession, seller financing, or rate buy-down credit?
- Built in 1959 — when were the roof, HVAC, electrical panel, plumbing, and water heater last replaced?
- Why hasn't it sold? Are there any deal-killer items the seller is aware of (foundation, flood, title, zoning, code violations)?
- Is there a deadline driving the sale (1031 exchange, divorce, estate, relocation)? That informs how much negotiation room exists.
- What's the average days-on-market for RENTAL listings here right now (not sales)? A rising rental-DOM trend means longer vacancies and softer asking-rent achievability than the comps imply.
- What's the recent tenant-quality profile in this submarket — average credit score on applications, eviction rate, late-payment / NSF rate, and stable-employment percentage? A property-management company in the area should have these aggregated.
- How much new for-sale + rental construction is in the pipeline within 1–3 miles? Heavy new supply typically softens prices + rents 12–24 months out; constrained supply supports both.
Investment metrics
- 1% rule
- 1.18% ✓
- Cap rate
- 8.74%
- Cash-on-cash
- 8.73%
- DSCR
- 1.39
- GRM
- 7.1
CMA / ARV
- ARV (median comp)
- $239,486
- List price
- $139,900
- Delta
- -41.58%
- Verdict
- UNDERPRICED
- Comps
- 20 within 1.0 mi
Show comp detail 4 sales within ~0.75 mi
| Address | Dist | Beds/Ba | Sqft | Sold | Price | $/sf | Match |
|---|---|---|---|---|---|---|---|
| 5134 Rybolt Rd | 0.35mi | 3/1.0 | 1,000 (-7%) | 8mo | $190,000 | $190 | 65 |
| 5397 Belclare Rd | 0.74mi | 3/1.0 | 1,134 (+6%) | 10mo | $239,500 | $211 | 48 |
| 5713 Sheed Rd | 0.71mi | 3/2.0 | 1,218 (+13%) | 0mo | $270,000 | $222 | 41 |
| 5333 Belclare Rd | 0.73mi | 3/2.0 | 922 (-14%) | 16mo | $260,000 | $282 | 25 |
Match score weights: distance 35% · size 25% · config 20% · recency 20%. Top-matched comps best support the ARV.
Projected returns pro-forma
-3.0% appreciation · 3.0% rent growth · sell at horizon
- IRR
- -3.0%
- Equity multiple
- 0.89×
- Total profit
- $-4,464
- Equity at exit
- $20,860
- IRR
- 6.7%
- Equity multiple
- 1.50×
- Total profit
- $19,710
- Equity at exit
- $12,096
Cash invested: $39,172 (down + closing). Projections, not guarantees.
Landlord ↔ Tenant lean methodology
- Overall (STATE)
- 73 Landlord-Friendly
- State Ohio
- 73 Landlord-Friendly · R+6
- County
- — inherits STATE
- City
- — inherits STATE
ZIP-level market 45248
- Active inventory
- 103
- Price-to-rent
- 7.1×
Monthly cashflow live
- Estimated rent
- $1,648 medium interval (Pro) →
- Mortgage (P&I)
- −$734
- Tax from tax record
- −$225 /mo · $2,701/yr
- Insurance
- −$58
- HOA
- −$0
- Vacancy / Maint / Mgmt
- −$346
- Net cashflow
- $285
Break-even live
UW: 25.0% down · 7.5% · 30yr · 1.5% tax · 5.0% vac · 8.0% maint · 8.0% mgmt
Financing live
Cash to close
- Down payment
- $34,975
- Closing costs
- $4,197
- Reserves months
- —
- Total cash needed
- —
Loan-product check · same deal, 3 products live
Conventional
25% down · 7.5% · 30yr
- Down + closing
- —
- Monthly P&I
- —
- Monthly cashflow
- —
- DSCR
- —
- Eligible?
- —
Personal DTI + credit; lowest rate.
DSCR
20% down · 8.5% · 30yr
- Down + closing
- —
- Monthly P&I
- —
- Monthly cashflow
- —
- DSCR
- —
- Eligible?
- —
No personal income docs; deal must DSCR.
Hard money
10% down · 12.0% · 12mo
- Down + closing
- —
- Monthly P&I
- —
- Monthly cashflow
- —
- DSCR
- —
- Eligible?
- —
Short-term bridge; refi at stabilization.
Listing history 23 events
-
2026-06-18days on market $139,900 Active 161 DOM
-
2026-06-17days on market $139,900 Active 160 DOM
-
2026-06-16days on market $139,900 Active 159 DOM
-
2026-06-15days on market $139,900 Active 158 DOM
-
2026-06-13days on market $139,900 Active 156 DOM
-
2026-06-09days on market $139,900 Active 152 DOM
-
2026-06-08days on market $139,900 Active 151 DOM
-
2026-06-07days on market $139,900 Active 150 DOM
-
2026-06-05days on market $139,900 Active 147 DOM
-
2026-06-03days on market $139,900 Active 146 DOM
-
2026-06-02days on market $139,900 Active 145 DOM
-
2026-06-01days on market $139,900 Active 144 DOM
-
2026-05-31days on market $139,900 Active 143 DOM
-
2026-04-28price $149,000 173-char remark
Show marketing remark (173 chars)
Brick three bed ranch in OHLSD with one car garage and spectacular rear yard. Bring your renovation skills and the sky is the limit. Being sold as is and priced accordingly.
-
2026-04-14status Active 173-char remark
Show marketing remark (173 chars)
Brick three bed ranch in OHLSD with one car garage and spectacular rear yard. Bring your renovation skills and the sky is the limit. Being sold as is and priced accordingly.
-
2026-04-06historical Contingency Pending 173-char remark
Show marketing remark (173 chars)
Brick three bed ranch in OHLSD with one car garage and spectacular rear yard. Bring your renovation skills and the sky is the limit. Being sold as is and priced accordingly.
-
2026-04-01status Active 173-char remark
Show marketing remark (173 chars)
Brick three bed ranch in OHLSD with one car garage and spectacular rear yard. Bring your renovation skills and the sky is the limit. Being sold as is and priced accordingly.
-
2026-03-23historical Contingency Pending 173-char remark
Show marketing remark (173 chars)
Brick three bed ranch in OHLSD with one car garage and spectacular rear yard. Bring your renovation skills and the sky is the limit. Being sold as is and priced accordingly.
-
2026-03-12price $159,000 173-char remark
Show marketing remark (173 chars)
Brick three bed ranch in OHLSD with one car garage and spectacular rear yard. Bring your renovation skills and the sky is the limit. Being sold as is and priced accordingly.
-
2026-01-09$169,900 Active 173-char remark
Show marketing remark (173 chars)
Brick three bed ranch in OHLSD with one car garage and spectacular rear yard. Bring your renovation skills and the sky is the limit. Being sold as is and priced accordingly.
-
1995-08-02soldstatus $80,500
-
1990-01-04soldstatus $68,500
-
1985-05-28soldstatus $42,000
ⓘ Source: listings_history table (triggers on properties + properties_extension) + one-shot
backfill from property_details.listing_events for pre-trigger history.
Tax reassessment forecast OH · Partial reset (capped growth)
- Current annual tax
- $2,701 · $225/mo
- Projected year-2 tax
- $2,701 · $225/mo
- Expected delta
- $0/yr ($0/mo · 0.0%)
ⓘ Screening estimate from a state-policy table — verify with the county assessor before closing.
Climate risk First Street
- Flood 1/10 Low FEMA zone X (unshaded) · 0% chance over 30 yrs
- Wildfire 1/10 Low
- Heat 4/10 Moderate 7 d/yr ≥102°F today · 19 d/yr by 30 yrs out
- Wind 2/10 Low 100% chance of damaging wind over 30 yrs
- Air quality 3/10 Moderate 2 unhealthy d/yr today · 4 by 30 yrs out
Nearby sold comps map
Loading sold comps map…
Walkable amenities ~0.75 mi
Loading nearby amenities…
Taxation est. · year 1
- Rental income
- $19,777
- − Mortgage interest
- −$7,837
- − Property taxes
- −$2,701
- − Insurance
- −$700
- − Repairs & maintenance
- −$1,582
- − Management
- −$1,582
- − Depreciation
- −$4,070
- Taxable income
- $1,306
- Est. tax owed @ 24.0%
- −$313
- After-tax cash flow
- $3,106/yr
For passive investors: Depreciation is non-cash, so a rental often shows a tax loss while cash-flowing — sheltering income. Rental losses are passive: they offset passive income freely, and up to $25,000/yr can offset ordinary (W-2) income if you actively participate and your MAGI is under $100k (phasing out to $0 by $150k); unused losses carry forward. On sale, claimed depreciation is recaptured at up to 25%, and gains may owe capital-gains tax (a 1031 exchange can defer both). Figures are a year-1 estimate at your 24.0% rate — not tax advice; consult a CPA.
Schools (NCES district)
- District
- Oak Hills Local
- NCES district ID
- 3904737
- Math proficiency
- 68% ▼ -11.00%
- Reading proficiency
- 70% ▼ -8.00%
- Median HH income
- $67,889
- Composite
- 60.25/100
- National rank
- #858
- State rank
- #141 of 656 in OH
Livability — Dent
- Score
- 75/100
- State rank
- #245
- US rank
- #3901
Category grades
Schools grade is shown separately in the Schools card above.
Census & demographics
- Census place
- Dent, OH
- County
- Hamilton · 838,887 people
- Metro
- Cincinnati, OH-KY-IN
- Population (ZIP)
- 23,287
- Household income
- $81,731
- Rent vs Own
- Severe rent burden
- 4.1
Population outlook (Hamilton County) Hauer SSP2
- Today (2025)
- 826,054 people
- By 2030
- 830,947 · +0.6%
- By 2040
- 832,319 · +0.8%
- By 2050
- 822,428 · -0.4%
- By 2075
- 788,688 · -4.5%
- By 2100
- 710,674 · -14.0%
Race, ethnicity, and origin ACS 2023
- Neighborhood character
- Predominantly White (94%)
- Race & ethnicity
- White 94% Two or more races 4% Hispanic / Latino 2% Black 1%
- Common ancestry
- Lithuanian 2% Romanian 2% Slovak 1%
- Foreign-born
- 1%
Political lean MEDSL · Hamilton
- 2024 margin
- D (+14.9) · D 57.0% · R 42.1%
- 2008→2024 swing
- +7.9pp toward D · 2008: 7.0pp · 2024: 14.9pp
- All cycles
- 2024: D+14.9 2020: D+15.9 2016: D+9.5 2012: D+4.9 2008: D+7.0
Not yet ingested
- Civics
- —
Market trends
- HPI YoY
- ▼ -143.68%
- Current HPI
- 193.4863
- Rent YoY
- —
- Metro
- —
- State GDP YoY
- ▲ 1.98%
- F500 in state
- 48
Industry mix (Fortune 500 HQ in OH)
| Industry | F500 HQs | Revenue |
|---|---|---|
| Insurance | 3 | $145B |
|
||
| Industrial Machinery | 3 | $49B |
|
||
| Financial Services | 3 | $24B |
|
||
| Consumer Goods | 2 | $93B |
|
||
| Aerospace / Defense | 2 | $47B |
|
||
| Utilities | 2 | $33B |
|
||
Price history
+254.8% since first listed10 events — show timeline
- 2026-04-28 Price Changed $149,000 Cincy MLS
- 2026-04-14 Relisted — Cincy MLS
- 2026-04-06 Contingent — Cincy MLS
- 2026-04-01 Relisted — Cincy MLS
- 2026-03-23 Contingent — Cincy MLS
- 2026-03-12 Price Changed $159,000 Cincy MLS
- 2026-01-09 Listed $169,900 Cincy MLS
- 1995-08-02 Sold (Public Records) $80,500 Public Records
- 1990-01-04 Sold (Public Records) $68,500 Public Records
- 1985-05-28 Sold (Public Records) $42,000 Public Records
Property tax history
+3.6%/yrLatest (2025): $2,701 · +2.5% YoY. Source: county tax records.
Cash-flow waterfall
monthlySold comps — $/sqft
last 12 mo · ≤1 miLoading sold comps…