 Duplex
1905 12th Ave · Huntington, WV
Flood risk 1/10 · Minimal
- FEMA flood zone
- X (unshaded)
- Chance of flooding over 30 yrs
- 0.0%
- Est. flood insurance / yr
- $507 – $1,088
Fire risk 3/10 · Minor
- Est. fire insurance / yr
- $787 – $1,461
Heat risk 5/10 · Moderate
- Hot days now (above 102°F)
- 7 days/yr
- Hot days in 30 yrs
- 19 days/yr
Wind risk 2/10 · Minimal
- Chance of severe wind over 30 yrs
- 1.0%
Air-quality risk 2/10 · Minimal
- Unhealthy air days now
- 0 days/yr
- Unhealthy air days in 30 yrs
- 1 days/yr
Risk factors via First Street. Map © Google.
Why this score? — see what drove the C+ grade
The composite is a weighted blend of 9 inputs, each scored 0–100. Each bar is that input's sub-score; the figure is the points it added to the 100-point composite (weight × sub-score).
- Cash flow +25.4/30.0
- DSCR +8.4/10.0
- ARV discount +7.5/15.0
- 1% rule +6.6/10.0
- Rent growth +5.0/5.0
- Livability +4.0/5.0
- Schools +3.0/10.0
- Condition / age +2.2/5.0
- Appreciation +0.0/10.0
$209,900
🖨 Deal sheet 📄 Offer letter ✓ Due diligence
Multi-family units
County records classify this as Multi-Family (2-4 Unit). Listing-text estimate: 2 units. confirmed
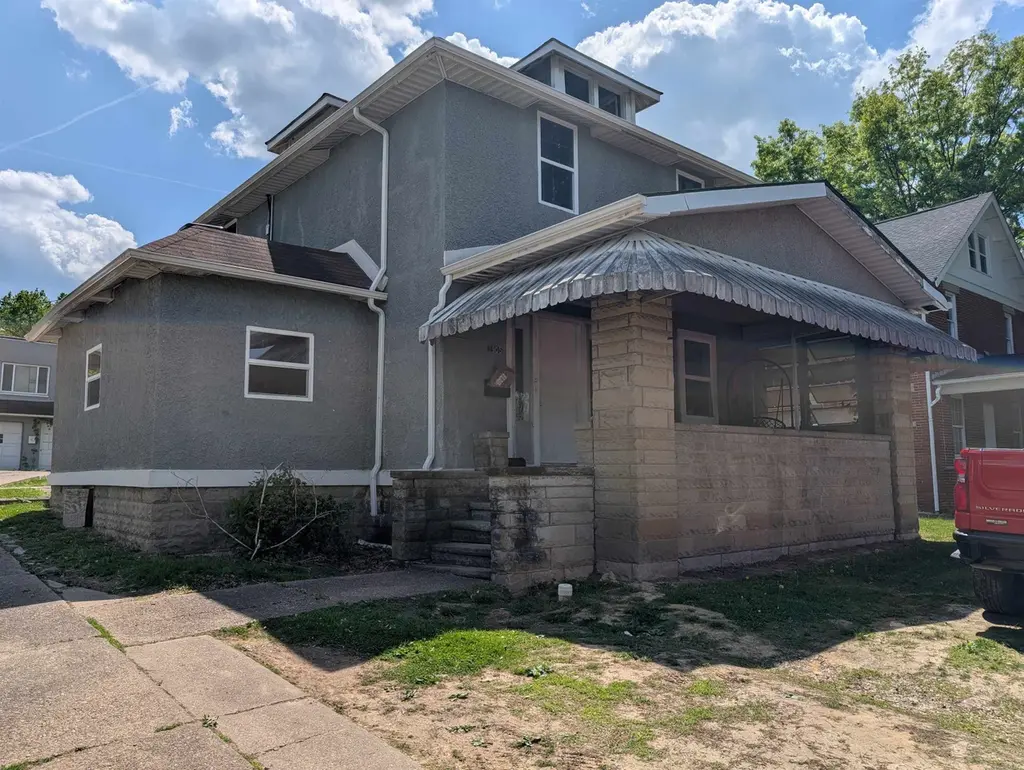
Listing remarks
Great investor opportunity! This income-producing property features a duplex plus an additional apartment above the detached garage, offering a total of 3 rental units. Each unit includes 2 bedrooms and 1 full bath, with separate utility meters for added convenience. Currently generating approximately $31,200.00 annual gross income, this property offers strong rental potential and consistent tenant appeal. Conveniently located near Cabell Huntington Hospital, it is ideal for long-term rental demand. Additional highlights include newer AC/heat units, ample parking, stove and refrigerators conveying with each unit, washer/dryer hookups in all units, and no ongoing maintenance issues. A solid
Key facts
- 0.28 acre lot
- Built 1906
- Listed 55 days
Property features AI
Exterior
- Parking: Off-street parking; On-street parking
- Security: Smoke detectors
- Utilities: Public water; Public sewer
- Home design: Residential income duplex; 2 stories
- Construction: Stucco construction; Shingle roof
- Exterior features: Porch; Chain link fencing; Level lot
Interior
- Kitchen: Range; Oven; Refrigerator
- Heating & cooling: Central heating (electric); Central air conditioning
- Interior features: Range, Oven, Refrigerator; Central heating (electric); Central air conditioning
Neighborhood map
What this means for you Summary
Snapshot
- This is a 2 × 3-bed/?-bath units multifamily listed at $210k. Condition is rated fair.
Deal economics
- At list price, monthly cash flow is $480 ($6k/yr) — positive. Per door: $240/mo.
- The deal already cash-flows at list — no discount required.
- Meets the 1% rule at list price ($2k rent vs $210k).
- Recommended offer: $204k (3.0% below list) — sets the bar for market timing.
- Cap rate 9.0% vs local median 6.5% in Huntington — top-decile yield for the area; either an underpriced asset or a hidden risk that comps aren't pricing in. Stress-test before assuming the spread holds.
Location & tenants
- Location reads 79/100 on livability (#16 in WV, #2,045 nationally) — a middle-class / working-renter tenant base. Strengths: amenities A+, commute A+, cost of living A+; Watch: schools C-, crime F, employment F.
- Cabell County Schools (urban): math 31% / reading 42% proficiency, ranked #13 of 55 in WV (top 24%) — families likely to look elsewhere, expect single-tenant / working-renter base with shorter leases.
- Market conditions: Rents rising fast (+10.6%/yr); 127 active listings in the ZIP; 61 units permitted in Cabell County in 2024 (5 in 5+ unit buildings).
- At $2,444/mo this rent would consume 52% of the median local household income ($56k/yr) (locally 1186% of renters already pay >50% of income on rent) — very limited rent-growth headroom before tenants either downsize or default.
Forward outlook
- Local home prices are declining (-3.0%/yr); year-one equity from $1k of loan paydown is wiped out by about $6k of value loss. Plan a longer hold.
- At projected returns (-3.0% appreciation + 8.0% rent growth), your $59k cash investment doubles in ~8 years — after that, you're playing with house money.
Negotiation context
- It's been on market 56 days — a 3% lower offer ($204k) is reasonable based on typical stale-listing flexibility.
Risks & watch-outs
- Watch-outs: built in 1906 — expect roof / HVAC / electrical / plumbing capex.
- Climate carrying-cost: extreme-heat days projected 7→19/yr by 2055 (HVAC capex compounding) — expect insurance premiums to compound above CPI over the hold.
Questions for the listing agent
- It's been on market 56 days. Have you received any prior offers? Is the seller open to a 3% concession, seller financing, or rate buy-down credit?
- Can we see the unit-by-unit rent roll, current vacancy, and any below-market leases? What's the average tenancy length?
- What capital expenditures (roof, boiler, parking lot, exteriors) have been made in the last 5 years, and what's planned in the next 2?
- Have any recent inspections been done? Can we get a copy of the seller's disclosures and any deferred-maintenance estimates?
- Built in 1906 — when were the roof, HVAC, electrical panel, plumbing, and water heater last replaced?
- Is there a deadline driving the sale (1031 exchange, divorce, estate, relocation)? That informs how much negotiation room exists.
- Crime grade is F in this area — have there been break-ins, vandalism, or insurance claims at this property in the last 3 years? What carrier currently insures it and at what premium?
- What's the average days-on-market for RENTAL listings here right now (not sales)? A rising rental-DOM trend means longer vacancies and softer asking-rent achievability than the comps imply.
- What's the recent tenant-quality profile in this submarket — average credit score on applications, eviction rate, late-payment / NSF rate, and stable-employment percentage? A property-management company in the area should have these aggregated.
- How much new apartment / multifamily construction is in the pipeline within 1–3 miles? Heavy new supply (>2% of stock underway) typically softens rents 12–24 months out; light construction supports rent growth.
Investment metrics
- 1% rule
- 1.16% ✓
- Cap rate
- 9.04%
- Cash-on-cash
- 9.80%
- DSCR
- 1.44
- GRM
- 7.2
CMA / ARV
No comps found within radius.
Projected returns pro-forma
-3.0% appreciation · 8.0% rent growth · sell at horizon
- IRR
- 4.0%
- Equity multiple
- 1.16×
- Total profit
- $9,523
- Equity at exit
- $31,297
- IRR
- 17.7%
- Equity multiple
- 2.81×
- Total profit
- $106,610
- Equity at exit
- $18,148
Cash invested: $58,772 (down + closing). Projections, not guarantees.
Landlord ↔ Tenant lean methodology
- Overall (STATE)
- 83 Strongly Landlord-Friendly
- State West Virginia
- 83 Strongly Landlord-Friendly · R+22
- County
- — inherits STATE
- City
- — inherits STATE
ZIP-level market 25701
- Home prices YoY
- -8.7%
- Rents YoY
- 10.6%
- Active inventory
- 127
- Price-to-rent
- 14.3×
Monthly cashflow live
- Estimated rent
- $2,444 medium interval (Pro) →
- Mortgage (P&I)
- −$1,101
- Tax est. 1.5%
- −$262 /mo · $3,148/yr
- Insurance
- −$87
- HOA
- −$0
- Vacancy / Maint / Mgmt
- −$513
- Net cashflow
- $480
Break-even live
2-unit breakdown (identical units grouped — click to expand)
| Units | Beds | Baths | Est. rent |
|---|---|---|---|
| 2× units | 3 | — | $2,444 |
| #1 | 3 | — | $1,222 |
| #2 | 3 | — | $1,222 |
| Total (2 units) | $2,444 | ||
UW: 25.0% down · 7.5% · 30yr · 1.5% tax · 5.0% vac · 8.0% maint · 8.0% mgmt
Financing live
Cash to close
- Down payment
- $52,475
- Closing costs
- $6,297
- Reserves months
- —
- Total cash needed
- —
Loan-product check · same deal, 3 products live
Conventional
25% down · 7.5% · 30yr
- Down + closing
- —
- Monthly P&I
- —
- Monthly cashflow
- —
- DSCR
- —
- Eligible?
- —
Personal DTI + credit; lowest rate.
DSCR
20% down · 8.5% · 30yr
- Down + closing
- —
- Monthly P&I
- —
- Monthly cashflow
- —
- DSCR
- —
- Eligible?
- —
No personal income docs; deal must DSCR.
Hard money
10% down · 12.0% · 12mo
- Down + closing
- —
- Monthly P&I
- —
- Monthly cashflow
- —
- DSCR
- —
- Eligible?
- —
Short-term bridge; refi at stabilization.
Listing history 17 events
-
2026-06-19days on market $209,900 Active 56 DOM
-
2026-06-18days on market $209,900 Active 55 DOM
-
2026-06-17days on market $209,900 Active 54 DOM
-
2026-06-16days on market $209,900 Active 53 DOM
-
2026-06-15days on market $209,900 Active 52 DOM
-
2026-06-14days on market $209,900 Active 50 DOM
-
2026-06-12days on market $209,900 Active 49 DOM
-
2026-06-09days on market $209,900 Active 46 DOM
-
2026-06-08days on market $209,900 Active 45 DOM
-
2026-06-07days on market $209,900 Active 44 DOM
-
2026-06-05days on market $209,900 Active 41 DOM
-
2026-06-03days on market $209,900 Active 40 DOM
-
2026-06-02days on market $209,900 Active 39 DOM
-
2026-06-01days on market $209,900 Active 38 DOM
-
2026-05-31days on market $209,900 Active 37 DOM
-
2026-05-30days on market $209,900 Active 36 DOM
-
2026-04-24$209,900 Active
ⓘ Source: listings_history table (triggers on properties + properties_extension) + one-shot
backfill from property_details.listing_events for pre-trigger history.
Climate risk First Street
- Flood 1/10 Low FEMA zone X (unshaded) · 0% chance over 30 yrs
- Wildfire 3/10 Moderate
- Heat 5/10 Major 7 d/yr ≥102°F today · 19 d/yr by 30 yrs out
- Wind 2/10 Low 100% chance of damaging wind over 30 yrs
- Air quality 2/10 Low 0 unhealthy d/yr today · 1 by 30 yrs out
Nearby sold comps map
Loading sold comps map…
Walkable amenities ~0.75 mi
Loading nearby amenities…
Taxation est. · year 1
- Rental income
- $29,328
- − Mortgage interest
- −$11,758
- − Property taxes
- −$3,148
- − Insurance
- −$1,050
- − Repairs & maintenance
- −$2,346
- − Management
- −$2,346
- − Depreciation
- −$6,106
- Taxable income
- $2,574
- Est. tax owed @ 24.0%
- −$618
- After-tax cash flow
- $5,145/yr
For passive investors: Depreciation is non-cash, so a rental often shows a tax loss while cash-flowing — sheltering income. Rental losses are passive: they offset passive income freely, and up to $25,000/yr can offset ordinary (W-2) income if you actively participate and your MAGI is under $100k (phasing out to $0 by $150k); unused losses carry forward. On sale, claimed depreciation is recaptured at up to 25%, and gains may owe capital-gains tax (a 1031 exchange can defer both). Figures are a year-1 estimate at your 24.0% rate — not tax advice; consult a CPA.
Condition & rehab AI · 10 photos
This multi-family property requires significant exterior and interior renovations to improve its condition and value. Immediate repairs and maintenance are needed to address the deteriorating exterior, roof, flooring, and HVAC systems.
Repairs flagged
- Major exterior siding — Significant damage and wear
- Major roof — Visible signs of wear and potential leaks
- Major flooring — Visible damage and uneven surfaces
- Major interior walls/paint — Paint peeling and discoloration
- Major HVAC/mechanicals — No visible signs of recent maintenance
Value-add opportunities
- Both exterior renovation — Improves curb appeal and rental value
- Both roof replacement — Fixes potential leaks and enhances structural integrity
- Both flooring replacement — Enhances living space and rental appeal
- Both HVAC upgrade — Improves comfort and energy efficiency
Renovation cost estimate screening
| Repair item | Severity | Est. cost |
|---|---|---|
| exterior siding · Significant damage and wear | Major | $15,000–50,000 |
| roof · Visible signs of wear and potential leaks | Major | $15,000–50,000 |
| flooring · Visible damage and uneven surfaces | Major | $15,000–50,000 |
| interior walls/paint · Paint peeling and discoloration | Major | $15,000–50,000 |
| HVAC/mechanicals · No visible signs of recent maintenance | Major | $15,000–50,000 |
| Total estimated repair cost · 5 items | $75,000–250,000 |
Value-add ROI direction
- Both exterior renovation — Improves curb appeal and rental value ↑
- Both roof replacement — Fixes potential leaks and enhances structural integrity ↑
- Both flooring replacement — Enhances living space and rental appeal ↑
- Both HVAC upgrade — Improves comfort and energy efficiency ↑
ⓘ Cost ranges are severity-bucket heuristics (US national rule-of-thumb). Get contractor quotes + a written scope before underwriting a rehab budget.
Schools (NCES district)
- District
- Cabell County Schools
- NCES district ID
- 5400180
- Math proficiency
- 31% ▼ -7.00%
- Reading proficiency
- 42% ▼ -6.00%
- Median HH income
- $36,426
- Composite
- 30.26/100
- National rank
- #6285
- State rank
- #13 of 55 in WV
Livability — Huntington
- Score
- 79/100
- State rank
- #16
- US rank
- #2045
Category grades
Schools grade is shown separately in the Schools card above.
Census & demographics
- Census place
- Huntington, WV
- County
- Cabell County · 30,893 people
- City population
- 25,795
- Metro
- Huntington-Ashland, WV-KY-OH
- Population (ZIP)
- 21,197
- Household income
- $56,292
- Rent vs Own
- Severe rent burden
- 1186.0
Population outlook (Cabell County) Hauer SSP2
- Today (2025)
- 97,574 people
- By 2030
- 98,060 · +0.5%
- By 2040
- 98,817 · +1.3%
- By 2050
- 100,185 · +2.7%
- By 2075
- 105,895 · +8.5%
- By 2100
- 105,948 · +8.6%
Race, ethnicity, and origin ACS 2023
- Neighborhood character
- Predominantly White (82%)
- Race & ethnicity
- White 82% Black 8% Two or more races 6% Hispanic / Latino 2% Asian 2%
- Common ancestry
- Slovak 4% Italian 2% Serbian 2%
- Foreign-born
- 2% · China
- Languages at home
- 96% English-only · Spanish 2% Other Indo-European 1% Chinese 1%
Political lean MEDSL · Cabell
- 2024 margin
- Strong R (+21.9) · D 38.0% · R 59.9% · Other 2.0%
- 2008→2024 swing
- -11.8pp toward R · 2008: -10.1pp · 2024: -21.9pp
- All cycles
- 2024: R+21.9 2020: R+18.0 2016: R+25.5 2012: R+13.9 2008: R+10.1
Not yet ingested
- Civics
- —
Market trends
- HPI YoY
- ▼ -19.39%
- Current HPI
- 202.9629
- Rent YoY
- ▲ 10.58%
- Metro
- Huntington-Ashland, WV-KY-OH
- State GDP YoY
- —
- F500 in state
- 0
Price history
1 event — show timeline
- 2026-04-24 Listed $209,900 HBRMLS
Cash-flow waterfall
monthlySold comps — $/sqft
last 12 mo · ≤1 miLoading sold comps…