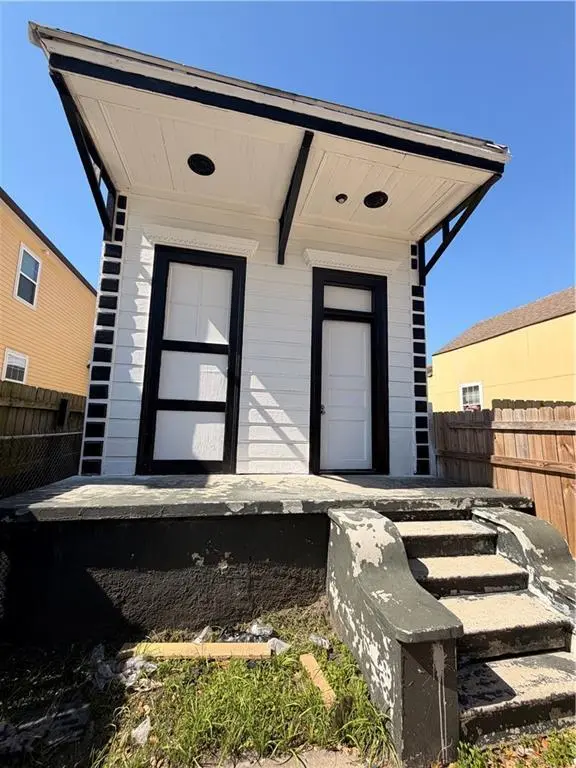
631 S Lopez St · New Orleans, LA
Flood risk 8/10 · Major
- FEMA flood zone
- AE
- Chance of flooding over 30 yrs
- 0.77%
- Est. flood insurance / yr
- $1,737 – $8,500
Fire risk 1/10 · Minimal
- Est. fire insurance / yr
- $1,269 – $2,357
Heat risk 10/10 · Severe
- Hot days now (above 108°F)
- 7 days/yr
- Hot days in 30 yrs
- 21 days/yr
Wind risk 10/10 · Severe
- Chance of severe wind over 30 yrs
- 99.0%
Air-quality risk 4/10 · Minor
- Unhealthy air days now
- 4 days/yr
- Unhealthy air days in 30 yrs
- 4 days/yr
Risk factors via First Street. Map © Google.
Why this score? — see what drove the B- grade
The composite is a weighted blend of 9 inputs, each scored 0–100. Each bar is that input's sub-score; the figure is the points it added to the 100-point composite (weight × sub-score).
- Cash flow +30.0/30.0
- 1% rule +10.0/10.0
- DSCR +10.0/10.0
- ARV discount +7.5/15.0
- Livability +4.0/5.0
- Rent growth +2.5/5.0
- Condition / age +2.5/5.0
- Schools +1.6/10.0
- Appreciation +0.0/10.0
$74,500
🖨 Deal sheet 📄 Offer letter ✓ Due diligence
Listing remarks MLS
MIXED USE PROPERTY!!! LOCATION, LOCATION, LOCATION, CALLING ALL INVESTORS TO COME AND ADD YOUR PERSONAL TOUCHES IN MID CITY AREA WITH TONS OF NEW CONSTRUCTION, RENOVATIONS, RESTAURANTS, SHOPPING AND MORE. FEW MINUTES TO SUPERDOME, NEW ORLEANS ARENA, AND DOWNTOWN. There is a warehouse next door as well for sale.
Key facts
- Mid city area
- New construction
- New orleans arena
Tags
Neighborhood map
What this means for you Summary
Snapshot
- This is a 2-bed/1.0-bath single-family listed at $74k.
Deal economics
- At list price, monthly cash flow is $273 ($3k/yr) — positive.
- The deal already cash-flows at list — no discount required.
- Meets the 1% rule at list price ($2k rent vs $74k).
- Recommended offer: $66k (12.0% below list) — sets the bar for market timing.
- Cap rate 17.6% vs local median 4.4% in New Orleans — top-decile yield for the area; either an underpriced asset or a hidden risk that comps aren't pricing in. Stress-test before assuming the spread holds.
Location & tenants
- Location reads 81/100 on livability (#3 in LA, #1,383 nationally) — a professional / high-income tenant draw. Strengths: amenities A+, commute A+, health & safety A+; Watch: crime C-, employment D.
- Orleans Parish (urban): math 11% / reading 27% proficiency, ranked #69 of 98 in LA (top 70%) — low school quality limits family demand, transient renter base, plan for 1-2y turnover; 68% free/reduced lunch — lower-income household profile, screen leases tightly.
- Market conditions: Rents soft (-0.2%/yr); 381 active listings in the ZIP; 40 comparable units currently listed for rent nearby; rentals at typical pace (median 22d on market — plan ~3-4 weeks tenant-placement turnaround); 710 units permitted in Orleans Parish in 2024 (244 in 5+ unit buildings).
- This rent runs 37% of the median local income ($53k/yr) — at the standard rent-burdened threshold; future hikes will face affordability resistance.
Forward outlook
- Local home prices are declining (-3.0%/yr); year-one equity from $515 of loan paydown is wiped out by about $2k of value loss. Plan a longer hold.
- Orleans County population projected at +61% by 2050 — long-run rental-demand tailwind backs the buy-and-hold thesis.
Negotiation context
- It's been on market 167 days — a 12% lower offer ($66k) is reasonable based on typical stale-listing flexibility.
- 3 sale attempts since 2y ago; this cycle's ask has dropped $15k (17%) from the opening price — seller is motivated, your offer sets the floor, not the list.
- Current owner paid $28k; list at $74k implies a 166% gain — meaningful room to come down on a strong offer.
Risks & watch-outs
- Watch-outs: property tax is 2.8% of price; flood insurance adds $427/mo.
- Climate carrying-cost: in FEMA flood zone AE (mandatory federal flood insurance); severe wind risk, 99% chance of damaging wind over 30y; extreme-heat days projected 7→21/yr by 2055 (HVAC capex compounding) — expect insurance premiums to compound above CPI over the hold.
Questions for the listing agent
- It's been on market 167 days. Have you received any prior offers? Is the seller open to a 12% concession, seller financing, or rate buy-down credit?
- Built in 1960 — when were the roof, HVAC, electrical panel, plumbing, and water heater last replaced?
- Property tax is high relative to price — has the assessment been appealed recently, and will the sale trigger a re-assessment?
- What's the actual annual flood-insurance premium (NFIP or private), and is the property in a SFHA with mandatory coverage?
- Why hasn't it sold? Are there any deal-killer items the seller is aware of (foundation, flood, title, zoning, code violations)?
- Is there a deadline driving the sale (1031 exchange, divorce, estate, relocation)? That informs how much negotiation room exists.
- What's the average days-on-market for RENTAL listings here right now (not sales)? A rising rental-DOM trend means longer vacancies and softer asking-rent achievability than the comps imply.
- What's the recent tenant-quality profile in this submarket — average credit score on applications, eviction rate, late-payment / NSF rate, and stable-employment percentage? A property-management company in the area should have these aggregated.
- How much new for-sale + rental construction is in the pipeline within 1–3 miles? Heavy new supply typically softens prices + rents 12–24 months out; constrained supply supports both.
Investment metrics
- 1% rule
- 2.20% ✓
- Cap rate
- 17.56%
- Cash-on-cash
- 40.25%
- DSCR
- 2.79
- GRM
- 3.8
CMA / ARV
- ARV (median comp)
- $218,832
- List price
- $74,500
- Delta
- -65.96%
- Verdict
- UNDERPRICED
- Comps
- 20 within 1.0 mi
Show comp detail 12 sales within ~0.75 mi
| Address | Dist | Beds/Ba | Sqft | Sold | Price | $/sf | Match |
|---|---|---|---|---|---|---|---|
| 412 S Gayoso St | 0.23mi | 3/2.0 (+1) | 1,250 (+4%) | 7mo | $298,000 | $238 | 68 |
| 2525 Banks St | 0.56mi | 2/1.0 | 1,235 (+3%) | 6mo | $157,500 | $128 | 64 |
| 3023 Iberville St | 0.55mi | 3/2.0 (+1) | 1,204 (+0%) | 2mo | $295,000 | $245 | 63 |
| 3800 Bienville St | 0.72mi | 2/2.0 | 1,201 (+0%) | 1mo | $277,500 | $231 | 62 |
| 3024 Gravier St | 0.10mi | 3/2.0 (+1) | 1,378 (+15%) | 1mo | $80,000 | $58 | 61 |
| 2715 Palmyra St | 0.45mi | 2/1.0 | 1,095 (-9%) | 5mo | $180,000 | $164 | 61 |
| 207 S Pierce St | 0.67mi | 2/1.0 | 1,210 (+1%) | 9mo | $280,000 | $231 | 60 |
| 315 S Telemachus St | 0.45mi | 2/1.0 | 1,033 (-14%) | 1mo | $260,221 | $252 | 55 |
| 223 S Rocheblave St | 0.63mi | 2/2.0 | 1,100 (-8%) | 2mo | $295,000 | $268 | 52 |
| 4802 Dixon St | 0.43mi | 2/1.0 | 1,034 (-14%) | 8mo | $115,000 | $111 | 50 |
| 1225 S Genois St | 0.67mi | 2/2.0 | 1,108 (-8%) | 5mo | $147,000 | $133 | 48 |
| 2738 Cleveland Ave | 0.45mi | 3/2.0 (+1) | 1,356 (+13%) | 2mo | $289,000 | $213 | 46 |
Match score weights: distance 35% · size 25% · config 20% · recency 20%. Top-matched comps best support the ARV.
Projected returns pro-forma
-3.0% appreciation · 0.0% rent growth · sell at horizon
- IRR
- 1.1%
- Equity multiple
- 1.04×
- Total profit
- $864
- Equity at exit
- $11,108
- IRR
- 5.0%
- Equity multiple
- 1.29×
- Total profit
- $5,976
- Equity at exit
- $6,441
Cash invested: $20,860 (down + closing). Projections, not guarantees.
Landlord ↔ Tenant lean methodology
- Overall (STATE)
- 90 Strongly Landlord-Friendly
- State Louisiana
- 90 Strongly Landlord-Friendly · R+12
- County
- — inherits STATE
- City
- — inherits STATE
ZIP-level market 70119
- Home prices YoY
- -34.8%
- Rents YoY
- -0.2%
- Active inventory
- 381
- Price-to-rent
- 3.8×
Monthly cashflow live
- Estimated rent
- $1,637 high interval (Pro) →
- Mortgage (P&I)
- −$391
- Tax from tax record
- −$172 /mo · $2,062/yr
- Insurance
- −$31
- Flood insurance flood zone
- −$427 /mo · $5,118/yr
- HOA
- −$0
- Vacancy / Maint / Mgmt
- −$344
- Net cashflow
- $273
Break-even live
UW: 25.0% down · 7.5% · 30yr · 1.5% tax · 5.0% vac · 8.0% maint · 8.0% mgmt
Financing live
Cash to close
- Down payment
- $18,625
- Closing costs
- $2,235
- Reserves months
- —
- Total cash needed
- —
Loan-product check · same deal, 3 products live
Conventional
25% down · 7.5% · 30yr
- Down + closing
- —
- Monthly P&I
- —
- Monthly cashflow
- —
- DSCR
- —
- Eligible?
- —
Personal DTI + credit; lowest rate.
DSCR
20% down · 8.5% · 30yr
- Down + closing
- —
- Monthly P&I
- —
- Monthly cashflow
- —
- DSCR
- —
- Eligible?
- —
No personal income docs; deal must DSCR.
Hard money
10% down · 12.0% · 12mo
- Down + closing
- —
- Monthly P&I
- —
- Monthly cashflow
- —
- DSCR
- —
- Eligible?
- —
Short-term bridge; refi at stabilization.
Rent comps 40 comps
| Address | Beds | Baths | Sqft | Rent | $/sqft | DOM | Units | Dist |
|---|---|---|---|---|---|---|---|---|
| 3232 Tulane Ave New Orleans, LA | 2.0 | 1.0 | 900 | $1,350 | $1.50 | 16d | 1 | 0.03mi |
| 3327 Baudin St New Orleans, LA | 2.0 | 1.0 | 1200 | $1,900 | $1.58 | 24d | 1 | 0.16mi |
| 434 S Norman C. Francis Pkwy Unit A New Orleans, LA | 2.0 | 1.0 | 850 | $1,350 | $1.59 | 21d | 1 | 0.18mi |
| 2922 Gravier St New Orleans, LA | 2.0 | 1.0 | 822 | $1,300 | $1.58 | 24d | 1 | 0.18mi |
| 2919 Gravier St New Orleans, LA | 2.0 | 1.0 | 1000 | $1,600 | $1.60 | 24d | 1 | 0.18mi |
| 3023 Baudin St New Orleans, LA | 3.0 | 1.0 | 968 | $2,400 | $2.48 | 17d | 1 | 0.18mi |
| 403 S Lopez St New Orleans, LA | 2.0 | 1.0 | 820 | $1,500 | $1.83 | 12d | 1 | 0.19mi |
| 3100 Banks St New Orleans, LA | 1.0 | 1.0 | 755 | $1,725 | $2.28 | 16d | 1 | 0.21mi |
| 3100 Banks St Unit 209 New Orleans, LA | 1.0 | 1.0 | 755 | $1,725 | $2.28 | 3d | 1 | 0.21mi |
| 439 S Norman C. Francis Pkwy Unit 1A New Orleans, LA | 3.0 | 1.0 | 1200 | $1,700 | $1.42 | 21d | 1 | 0.21mi |
| 325 S Rendon St New Orleans, LA | 3.0 | 2.0 | 1130 | $2,000 | $1.77 | 24d | 1 | 0.25mi |
| 747 S Genois St New Orleans, LA | 2.0 | 1.0 | 798 | $1,650 | $2.07 | 3d | 1 | 0.28mi |
| 753 S Genois St New Orleans, LA | 2.0 | 1.0 | 708 | $1,250 | $1.77 | 24d | 1 | 0.29mi |
| 334 S Clark St New Orleans, LA | 3.0 | 1.0 | 1065 | $1,750 | $1.64 | 21d | 1 | 0.30mi |
| 429 S Genois St Unit 429 New Orleans, LA | 3.0 | 1.0 | 1022 | $1,650 | $1.61 | 24d | 1 | 0.31mi |
| 431 S Genois St New Orleans, LA | 3.0 | 1.0 | 1022 | $1,675 | $1.64 | 24d | 1 | 0.31mi |
| 518 S Telemachus St New Orleans, LA | 2.0 | 1.0 | 888 | $1,500 | $1.69 | 24d | 1 | 0.33mi |
| 2912 Palmyra St Unit D New Orleans, LA | 3.0 | 2.0 | 1257 | $1,650 | $1.31 | 24d | 1 | 0.33mi |
| 2645 Gravier St Unit 2645-A New Orleans, LA | 3.0 | 1.0 | 1290 | $1,595 | $1.24 | 24d | 1 | 0.43mi |
| 3804 Banks St New Orleans, LA | 3.0 | 2.0 | 1353 | $2,250 | $1.66 | 17d | 1 | 0.44mi |
| 2652 Banks St New Orleans, LA | 3.0 | 3.5 | 1204 | $2,100 | $1.74 | 24d | 1 | 0.46mi |
| 2651 Poydras St New Orleans, LA | 1.0–4.0 | 1.0–2.0 | 1095 | $1,732 | $1.58 | 2d | 16 | 0.47mi |
| 3638 Cleveland Ave New Orleans, LA | 2.0 | 1.0 | 905 | $1,400 | $1.55 | 21d | 1 | 0.47mi |
| 3832 Banks St New Orleans, LA | 2.0 | 1.0 | 1200 | $1,850 | $1.54 | 17d | 1 | 0.49mi |
| 4702 Euphrosine St New Orleans, LA | 3.0 | 1.0 | 1100 | $1,850 | $1.68 | 3d | 1 | 0.49mi |
| 129 N Rendon New Orleans, LA | 2.0 | 1.0 | 895 | $1,300 | $1.45 | 3d | 1 | 0.50mi |
| 600 S Pierce St New Orleans, LA | 2.0 | 1.0 | 851 | $1,550 | $1.82 | 24d | 1 | 0.52mi |
| 2539 Gravier St Unit 2541 New Orleans, LA | 3.0 | 1.0 | 1115 | $1,495 | $1.34 | 16d | 1 | 0.52mi |
| 2615 Banks St New Orleans, LA | 3.0 | 2.0 | 1200 | $1,900 | $1.58 | 3d | 1 | 0.52mi |
| 3315 Iberville St Unit 3 New Orleans, LA | 3.0 | 1.5 | 1006 | $1,345 | $1.34 | 24d | 1 | 0.53mi |
| 210 N Lopez St Unit A New Orleans, LA | 1.0 | 1.0 | 800 | $1,100 | $1.38 | 14d | 1 | 0.54mi |
| 319 S Scott St Unit 2A New Orleans, LA | 1.0 | 1.0 | 900 | $1,500 | $1.67 | 24d | 1 | 0.54mi |
| 319 S Scott St New Orleans, LA | 1.0 | 1.0 | 900 | $1,450 | $1.61 | 24d | 1 | 0.54mi |
| 615 S Pierce St New Orleans, LA | 3.0 | 1.0 | 1200 | $1,500 | $1.25 | 17d | 1 | 0.54mi |
| 613 S Pierce St New Orleans, LA | 3.0 | 1.0 | 1200 | $1,500 | $1.25 | 17d | 1 | 0.54mi |
| 3813 Cleveland Ave New Orleans, LA | 1.0 | 1.0 | 750 | $1,500 | $2.00 | 24d | 1 | 0.55mi |
| 3811 Cleveland Ave New Orleans, LA | 2.0 | 1.0 | 750 | $1,450 | $1.93 | 21d | 1 | 0.56mi |
| 216 N Salcedo St New Orleans, LA | 3.0 | 1.0 | 866 | $1,500 | $1.73 | 24d | 1 | 0.56mi |
| 3423 Iberville St Unit A New Orleans, LA | 2.0 | 1.0 | 876 | $1,450 | $1.66 | 3d | 1 | 0.56mi |
| 218 N Salcedo St New Orleans, LA | 2.0 | 1.0 | 866 | $1,300 | $1.50 | 24d | 1 | 0.56mi |
Listing history 22 events
-
2026-06-18days on market $74,500 Active 167 DOM
-
2026-06-17days on market $74,500 Active 166 DOM
-
2026-06-16days on market $74,500 Active 165 DOM
-
2026-06-15days on market $74,500 Active 164 DOM
-
2026-06-13days on market $74,500 Active 162 DOM
-
2026-06-10days on market $74,500 Active 159 DOM
-
2026-06-09days on market $74,500 Active 158 DOM
-
2026-06-08days on market $74,500 Active 157 DOM
-
2026-06-07days on market $74,500 Active 156 DOM
-
2026-06-05days on market $74,500 Active 153 DOM
-
2026-06-03days on market $74,500 Active 152 DOM
-
2026-06-02days on market $74,500 Active 151 DOM
-
2026-06-01days on market $74,500 Active 150 DOM
-
2026-05-31days on market $74,500 Active 149 DOM
-
2026-03-16price $74,500 312-char remark
Show marketing remark (312 chars)
MIXED USE PROPERTY!!! LOCATION, LOCATION, LOCATION, CALLING ALL INVESTORS TO COME AND ADD YOUR PERSONAL TOUCHES IN MID CITY AREA WITH TONS OF NEW CONSTRUCTION, RENOVATIONS, RESTAURANTS, SHOPPING AND MORE. FEW MINUTES TO SUPERDOME, NEW ORLEANS ARENA, AND DOWNTOWN. There is a warehouse next door as well for sale.
-
2026-02-20price $74,900 312-char remark
Show marketing remark (312 chars)
MIXED USE PROPERTY!!! LOCATION, LOCATION, LOCATION, CALLING ALL INVESTORS TO COME AND ADD YOUR PERSONAL TOUCHES IN MID CITY AREA WITH TONS OF NEW CONSTRUCTION, RENOVATIONS, RESTAURANTS, SHOPPING AND MORE. FEW MINUTES TO SUPERDOME, NEW ORLEANS ARENA, AND DOWNTOWN. There is a warehouse next door as well for sale.
-
2026-01-02$89,900 Active 312-char remark
Show marketing remark (312 chars)
MIXED USE PROPERTY!!! LOCATION, LOCATION, LOCATION, CALLING ALL INVESTORS TO COME AND ADD YOUR PERSONAL TOUCHES IN MID CITY AREA WITH TONS OF NEW CONSTRUCTION, RENOVATIONS, RESTAURANTS, SHOPPING AND MORE. FEW MINUTES TO SUPERDOME, NEW ORLEANS ARENA, AND DOWNTOWN. There is a warehouse next door as well for sale.
-
2024-01-27$99,900
-
1993-07-21soldstatus $28,000
ⓘ Source: listings_history table (triggers on properties + properties_extension) + one-shot
backfill from property_details.listing_events for pre-trigger history.
Tax reassessment forecast LA · Resets to sale price
- Current annual tax
- $2,062 · $172/mo
- Projected year-2 tax
- $2,062 · $172/mo
- Expected delta
- $0/yr ($0/mo · 0.0%)
ⓘ Screening estimate from a state-policy table — verify with the county assessor before closing.
Climate risk First Street
- Flood 8/10 Severe FEMA zone AE · 77% chance over 30 yrs
- Wildfire 1/10 Low
- Heat 10/10 Extreme 7 d/yr ≥108°F today · 21 d/yr by 30 yrs out
- Wind 10/10 Extreme 99% chance of damaging wind over 30 yrs
- Air quality 4/10 Moderate 4 unhealthy d/yr today · 4 by 30 yrs out
Nearby sold comps map
Loading sold comps map…
Walkable amenities ~0.75 mi
Loading nearby amenities…
Taxation est. · year 1
- Rental income
- $19,645
- − Mortgage interest
- −$4,173
- − Property taxes
- −$2,062
- − Insurance
- −$5,491
- − Repairs & maintenance
- −$1,572
- − Management
- −$1,572
- − Depreciation
- −$2,167
- Taxable income
- $2,608
- Est. tax owed @ 24.0%
- −$626
- After-tax cash flow
- $2,652/yr
For passive investors: Depreciation is non-cash, so a rental often shows a tax loss while cash-flowing — sheltering income. Rental losses are passive: they offset passive income freely, and up to $25,000/yr can offset ordinary (W-2) income if you actively participate and your MAGI is under $100k (phasing out to $0 by $150k); unused losses carry forward. On sale, claimed depreciation is recaptured at up to 25%, and gains may owe capital-gains tax (a 1031 exchange can defer both). Figures are a year-1 estimate at your 24.0% rate — not tax advice; consult a CPA.
Schools (NCES district)
- District
- Orleans Parish
- NCES district ID
- 2201170
- Math proficiency
- 11% ▼ -52.00%
- Reading proficiency
- 27% ▼ -46.00%
- Median HH income
- $37,011
- Composite
- 15.78/100
- National rank
- #9271
- State rank
- #69 of 98 in LA
Livability — New Orleans
- Score
- 81/100
- State rank
- #3
- US rank
- #1383
Category grades
Schools grade is shown separately in the Schools card above.
Census & demographics
- Census place
- New Orleans, LA
- County
- Orleans Parish · 338,817 people
- City population
- 338,817
- Metro
- New Orleans-Metairie, LA
- Population (ZIP)
- 37,253
- Household income
- $53,143
- Rent vs Own
- Severe rent burden
- 3381.0
Population outlook (Orleans County) Hauer SSP2
- Today (2025)
- 513,025 people
- By 2030
- 575,781 · +12.2%
- By 2040
- 700,174 · +36.5%
- By 2050
- 826,541 · +61.1%
- By 2075
- 1,123,374 · +119.0%
- By 2100
- 1,355,609 · +164.2%
Race, ethnicity, and origin ACS 2023
- Neighborhood character
- Diverse neighborhood (Simpson 0.64)
- Race & ethnicity
- Black 44% White 40% Two or more races 10% Hispanic / Latino 9% Asian 1%
- Hispanic origin (detail)
- Mexican 2%
- Common ancestry
- Lithuanian 8% Slovak 2% Romanian 1%
- Foreign-born
- 6% · Canada, Jamaica
- Languages at home
- 91% English-only · Spanish 6% French/Haitian/Cajun 1% Other Indo-European 0%
Political lean MEDSL · Orleans
- 2024 margin
- Solid D (+67.0) · D 82.2% · R 15.2% · Other 2.7%
- 2008→2024 swing
- +6.7pp toward D · 2008: 60.3pp · 2024: 67.0pp
- All cycles
- 2024: D+67.0 2020: D+68.2 2016: D+66.2 2012: D+62.5 2008: D+60.3
Not yet ingested
- Civics
- —
Market trends
- HPI YoY
- ▼ -135.38%
- Current HPI
- 253.1929
- Rent YoY
- ▼ -0.20%
- Metro
- New Orleans-Metairie, LA
- State GDP YoY
- ▲ 3.29%
- F500 in state
- 10
Industry mix (Fortune 500 HQ in LA)
| Industry | F500 HQs | Revenue |
|---|---|---|
| Telecommunications | 2 | $23B |
|
||
| Utilities | 1 | $12B |
|
||
| Wholesale / Distribution | 1 | $5B |
|
||
| Advertising | 1 | $2B |
|
||
Price history
+166.1% since first listed8 events — show timeline
- 2026-03-16 Price Changed $74,500 AcadianaMLS
- 2026-03-16 Price Changed $74,500 GSREIN
- 2026-02-20 Price Changed $74,900 AcadianaMLS
- 2026-02-20 Price Changed $74,900 GSREIN
- 2026-01-02 Listed $89,900 GSREIN
- 2026-01-02 Listed $89,900 AcadianaMLS
- 2024-01-27 Listed $99,900 AcadianaMLS
- 1993-07-21 Sold (Public Records) $28,000 Public Records
Property tax history
+15.7%/yrLatest (2026): $2,062 · +1.1% YoY. Source: county tax records.
Cash-flow waterfall
monthlySold comps — $/sqft
last 12 mo · ≤1 miLoading sold comps…