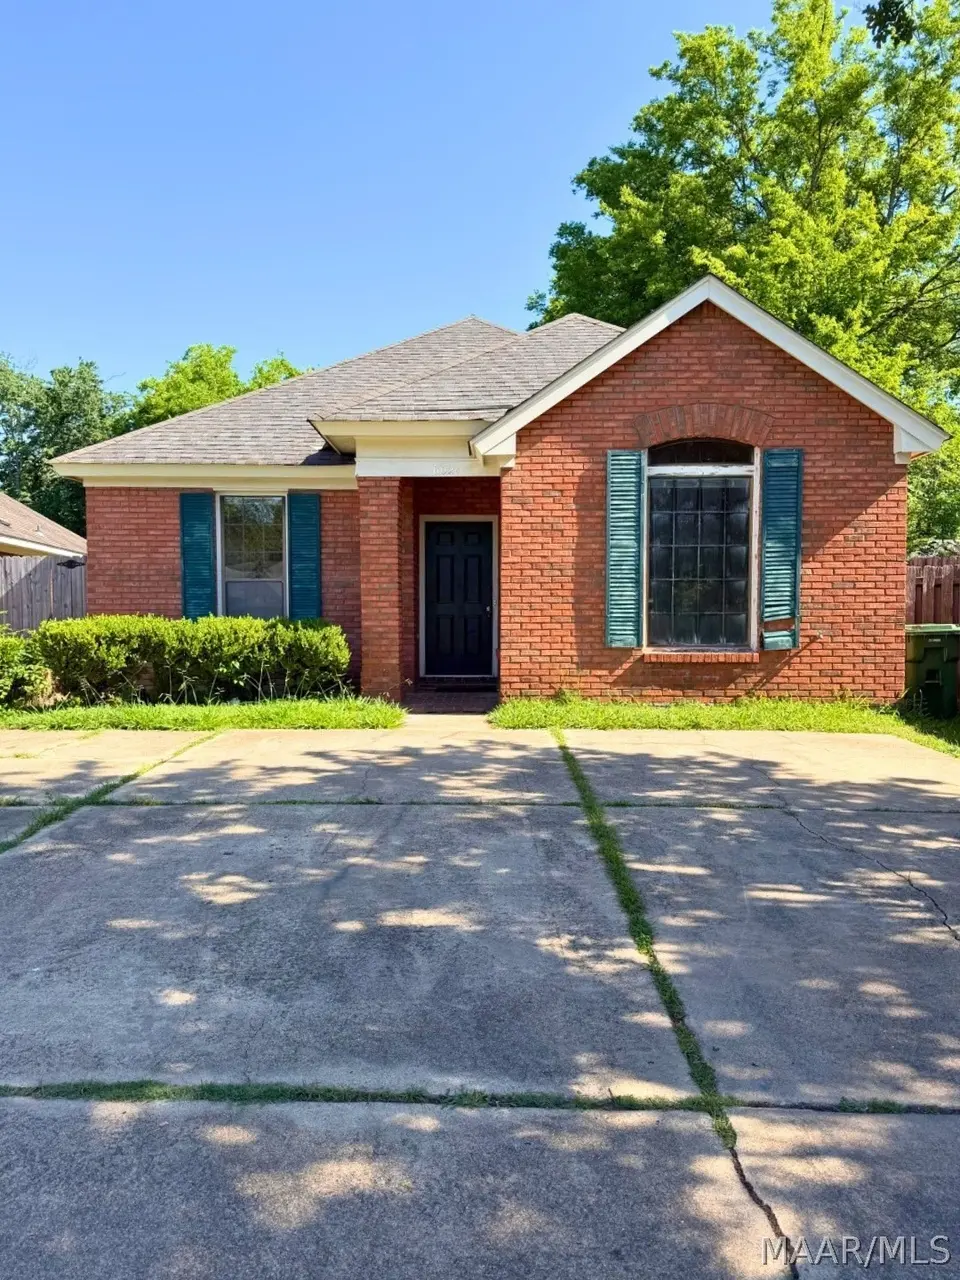
6021 Woodrun Ct · Montgomery, AL
Flood risk 1/10 · Minimal
- FEMA flood zone
- X (unshaded)
- Chance of flooding over 30 yrs
- 0.0%
- Est. flood insurance / yr
- $507 – $1,088
Fire risk 3/10 · Minor
- Est. fire insurance / yr
- $916 – $1,700
Heat risk 8/10 · Major
- Hot days now (above 108°F)
- 7 days/yr
- Hot days in 30 yrs
- 20 days/yr
Wind risk 6/10 · Moderate
- Chance of severe wind over 30 yrs
- 77.0%
Air-quality risk 2/10 · Minimal
- Unhealthy air days now
- 1 days/yr
- Unhealthy air days in 30 yrs
- 3 days/yr
Risk factors via First Street. Map © Google.
Why this score? — see what drove the C+ grade
The composite is a weighted blend of 9 inputs, each scored 0–100. Each bar is that input's sub-score; the figure is the points it added to the 100-point composite (weight × sub-score).
- Cash flow +23.8/30.0
- ARV discount +15.0/15.0
- DSCR +7.7/10.0
- 1% rule +5.1/10.0
- Rent growth +3.2/5.0
- Livability +3.2/5.0
- Condition / age +2.5/5.0
- Schools +1.7/10.0
- Appreciation +0.0/10.0
$157,000
🖨 Deal sheet 📄 Offer letter ✓ Due diligence
Listing remarks MLS
GORGEOUS PATIO HOME WITH A GREAT LOT. MUST SEE. DECORATED LIKE MODEL HOME GRT ROOM W/ FIREPLACE. DINING AREA, KITCHEN LOOKS INTO DINING AREA AND CAN BE EAT IN KITCHEN. MASTER W/ LARGE CLOSET & BATH. PRIVACY FENCE. DOG RUN AREA TOO. NICE STORAGE BUILDING. EXISTING HOME WARRANTY AHS WILL TRANSFER TO BUYER AT CLOSING
Key facts
- Large living area
- Formal dining room
- Covered patio
Tags
Property features AI
Exterior
- Parking: Driveway
- Utilities: Public water; Public sewer; Cable available
- Home design: Single-story home; Brick construction; Vented roof; Slab foundation; City lot on a cul-de-sac; Lot dimensions approximately 35 x 247
- Construction: Built with brick; Vented roof; Slab foundation
- Exterior features: Fully fenced yard; Patio; Storage building/area
Interior
- Kitchen: Dishwasher; Electric range; Disposal; Plumbed for ice maker
- Bedrooms: Bedrooms located on the first floor
- Flooring: Carpet; Plank; Vinyl
- Bathrooms: 2 full bathrooms
- Heating & cooling: Heat pump for heating and cooling; Has heating; Has cooling
- Interior features: Tray ceilings; Garden tub / Roman tub; Pull-down attic stairs; Walk-in closet(s); Window treatments; Split bedroom layout; Double-pane windows; Insulated doors
- Laundry & utility: Washer hookup; Dryer hookup; Electric water heater; Utility room (first floor)
Neighborhood map
What this means for you Summary
Snapshot
- This is a 3-bed/2.0-bath single-family listed at $157k.
Deal economics
- At list price, monthly cash flow is $303 ($4k/yr) — positive.
- The deal already cash-flows at list — no discount required.
- Meets the 1% rule at list price ($2k rent vs $157k).
- Recommended offer: $155k (1.5% below list) — sets the bar for market timing.
- Cap rate 8.6% vs local median 6.0% in Montgomery — top-decile yield for the area; either an underpriced asset or a hidden risk that comps aren't pricing in. Stress-test before assuming the spread holds.
Location & tenants
- Location reads 65/100 on livability (#138 in AL) — a middle-class / working-renter tenant base. Strengths: cost of living A+, housing A+; Watch: schools C-, employment D, crime F.
- Montgomery County (urban): math 9% / reading 31% proficiency, ranked #106 of 129 in AL (top 82%) — low school quality limits family demand, transient renter base, plan for 1-2y turnover; 70% free/reduced lunch — lower-income household profile, screen leases tightly.
- Market conditions: Rents rising (+3.0%/yr); 407 active listings in the ZIP; 25 comparable units currently listed for rent nearby; rentals at typical pace (median 21d on market — plan ~3-4 weeks tenant-placement turnaround); 460 units permitted in Montgomery County in 2024 (37 in 5+ unit buildings).
Forward outlook
- Local home prices are declining (-3.0%/yr); year-one equity from $1k of loan paydown is wiped out by about $5k of value loss. Plan a longer hold.
- Montgomery County population projected to shrink 8% by 2050 — rents likely to lag national; underwrite the cash flow, not the appreciation.
Negotiation context
- It's been on market 15 days — a 2% lower offer ($155k) is reasonable based on typical stale-listing flexibility.
- 3 sale attempts since 26y ago with the ask held roughly flat each time — persistent listings suggest the price (not the market) is what's stuck; bring a comps-based counter.
- Current owner paid $108k; 45% above their basis — modest negotiation headroom, anchor on the comps not their cost.
Risks & watch-outs
- Climate carrying-cost: major wind risk, 77% chance of damaging wind over 30y; extreme-heat days projected 7→20/yr by 2055 (HVAC capex compounding) — expect insurance premiums to compound above CPI over the hold.
Questions for the listing agent
- Is there a deadline driving the sale (1031 exchange, divorce, estate, relocation)? That informs how much negotiation room exists.
- Crime grade is F in this area — have there been break-ins, vandalism, or insurance claims at this property in the last 3 years? What carrier currently insures it and at what premium?
- What's the average days-on-market for RENTAL listings here right now (not sales)? A rising rental-DOM trend means longer vacancies and softer asking-rent achievability than the comps imply.
- What's the recent tenant-quality profile in this submarket — average credit score on applications, eviction rate, late-payment / NSF rate, and stable-employment percentage? A property-management company in the area should have these aggregated.
- How much new for-sale + rental construction is in the pipeline within 1–3 miles? Heavy new supply typically softens prices + rents 12–24 months out; constrained supply supports both.
Investment metrics
- 1% rule
- 1.01% ✓
- Cap rate
- 8.61%
- Cash-on-cash
- 8.27%
- DSCR
- 1.37
- GRM
- 8.3
CMA / ARV
- ARV (on-the-fly)
- $193,602
- Comps found
- 12
Show comp detail 12 sales within ~0.75 mi
| Address | Dist | Beds/Ba | Sqft | Sold | Price | $/sf | Match |
|---|---|---|---|---|---|---|---|
| 1911 Woodrun Dr | 0.09mi | 3/2.0 | 1,558 (-1%) | 2mo | $130,000 | $83 | 92 |
| 6606 Rushton Rdg | 0.34mi | 3/2.0 | 1,653 (+5%) | 2mo | $218,000 | $132 | 74 |
| 1505 Westminster Dr | 0.48mi | 3/2.0 | 1,568 (-0%) | 5mo | $181,000 | $115 | 73 |
| 6118 Margo Pl | 0.52mi | 3/2.0 | 1,643 (+4%) | 3mo | $170,000 | $103 | 66 |
| 6000 Vineyard Ln | 0.14mi | 2/2.0 (-1) | 1,409 (-10%) | 6mo | $182,500 | $130 | 66 |
| 6218 Woody Ln | 0.63mi | 3/2.0 | 1,499 (-5%) | 1mo | $183,000 | $122 | 62 |
| 6037 Vineyard Ln | 0.19mi | 2/2.0 (-1) | 1,394 (-11%) | 7mo | $171,000 | $123 | 61 |
| 6013 Camelot Ct | 0.53mi | 3/2.0 | 1,461 (-7%) | 3mo | $194,600 | $133 | 61 |
| 2638 Queens Hollow Ct | 0.75mi | 3/2.0 | 1,610 (+2%) | 4mo | $212,000 | $132 | 58 |
| 6217 John Dunn Ct W | 0.59mi | 3/2.0 | 1,689 (+7%) | 5mo | $207,000 | $123 | 56 |
| 2209 Cherry Creek Ct | 0.42mi | 3/2.0 | 1,809 (+15%) | 4mo | $267,941 | $148 | 52 |
| 6007 Neill Dr | 0.57mi | 3/2.0 | 1,355 (-14%) | 3mo | $165,000 | $122 | 48 |
Match score weights: distance 35% · size 25% · config 20% · recency 20%. Top-matched comps best support the ARV.
Projected returns pro-forma
-3.0% appreciation · 2.99% rent growth · sell at horizon
- IRR
- -3.8%
- Equity multiple
- 0.86×
- Total profit
- $-6,210
- Equity at exit
- $23,409
- IRR
- 5.9%
- Equity multiple
- 1.44×
- Total profit
- $19,144
- Equity at exit
- $13,574
Cash invested: $43,960 (down + closing). Projections, not guarantees.
Landlord ↔ Tenant lean methodology
- Overall (STATE)
- 90 Strongly Landlord-Friendly
- State Alabama
- 90 Strongly Landlord-Friendly · R+15
- County
- — inherits STATE
- City
- — inherits STATE
ZIP-level market 36117
- Home prices YoY
- -20.0%
- Rents YoY
- 3.0%
- Active inventory
- 407
- Price-to-rent
- 8.3×
Monthly cashflow live
- Estimated rent
- $1,584 high interval (Pro) →
- Mortgage (P&I)
- −$823
- Tax from tax record
- −$59 /mo · $713/yr
- Insurance
- −$65
- HOA
- −$0
- Vacancy / Maint / Mgmt
- −$333
- Net cashflow
- $303
Break-even live
UW: 25.0% down · 7.5% · 30yr · 1.5% tax · 5.0% vac · 8.0% maint · 8.0% mgmt
Financing live
Cash to close
- Down payment
- $39,250
- Closing costs
- $4,710
- Reserves months
- —
- Total cash needed
- —
Loan-product check · same deal, 3 products live
Conventional
25% down · 7.5% · 30yr
- Down + closing
- —
- Monthly P&I
- —
- Monthly cashflow
- —
- DSCR
- —
- Eligible?
- —
Personal DTI + credit; lowest rate.
DSCR
20% down · 8.5% · 30yr
- Down + closing
- —
- Monthly P&I
- —
- Monthly cashflow
- —
- DSCR
- —
- Eligible?
- —
No personal income docs; deal must DSCR.
Hard money
10% down · 12.0% · 12mo
- Down + closing
- —
- Monthly P&I
- —
- Monthly cashflow
- —
- DSCR
- —
- Eligible?
- —
Short-term bridge; refi at stabilization.
Rent comps 25 comps
| Address | Beds | Baths | Sqft | Rent | $/sqft | DOM | Units | Dist |
|---|---|---|---|---|---|---|---|---|
| 1944 Woodrun Dr Montgomery, AL | 3.0 | 2.0 | 1689 | $1,595 | $0.94 | 13d | 1 | 0.04mi |
| 6025 Oldcastle Pl Montgomery, AL | 3.0 | 2.0 | 1350 | $1,775 | $1.31 | 43d | 1 | 0.33mi |
| 1615 Woodmere Loop Montgomery, AL | 3.0 | 2.0 | 1212 | $1,250 | $1.03 | 43d | 1 | 0.35mi |
| 1612 Woodmere Loop Montgomery, AL | 3.0 | 1.5 | 1425 | $1,775 | $1.25 | 43d | 1 | 0.39mi |
| 1610 Limestone Ct Montgomery, AL | 3.0 | 2.5 | 1218 | $1,300 | $1.07 | 21d | 1 | 0.43mi |
| 1857 Still Oaks Dr Montgomery, AL | 4.0 | 2.0 | 1791 | $1,850 | $1.03 | 21d | 1 | 0.55mi |
| 2000 London Town Ln Montgomery, AL | 1.0–3.0 | 1.0–2.0 | 950 | $1,159 | $1.22 | 13d | 11 | 0.56mi |
| 1421 Stonehenge Rd Montgomery, AL | 1.0–3.0 | 1.0–1.5 | 895 | $1,199 | $1.34 | 43d | 1 | 0.70mi |
| 6225 Whitewater Ct Montgomery, AL | 3.0 | 2.0 | 1581 | $1,600 | $1.01 | 21d | 1 | 0.75mi |
| 2495 Meadow Ridge Ln Montgomery, AL | 1.0–3.0 | 1.0–2.0 | 1205 | $1,199 | $1.00 | 13d | 14 | 0.75mi |
| 5600 Carmichael Rd Montgomery, AL | 2.0 | 1.0–2.0 | 722 | $1,153 | $1.60 | 43d | 1 | 0.87mi |
| 7104 Fair Oaks Ct Montgomery, AL | 3.0 | 2.0 | 1656 | $1,881 | $1.14 | 43d | 1 | 0.88mi |
| 3201 Watchman Dr Montgomery, AL | 1.0–3.0 | 1.0–2.0 | 1054 | $1,644 | $1.56 | 13d | 10 | 0.90mi |
| 2014 Rexford Rd Montgomery, AL | 3.0 | 2.0 | 1596 | $1,150 | $0.72 | 43d | 1 | 0.96mi |
| 7406 Mill Ridge Ct Montgomery, AL | 3.0 | 2.0 | 1785 | $2,250 | $1.26 | 44d | 1 | 0.98mi |
| 2060 Rexford Rd Montgomery, AL | 3.0 | 2.5 | 1566 | $925 | $0.59 | 21d | 1 | 1.01mi |
| 2066 Rexford Rd Montgomery, AL | 3.0 | 2.5 | 1632 | $1,250 | $0.77 | 21d | 1 | 1.02mi |
| 5720 Worchester Dr Montgomery, AL | 2.0 | 2.0 | 1060 | $895 | $0.84 | 21d | 1 | 1.07mi |
| 2224 W Aberdeen Dr Montgomery, AL | 4.0 | 2.0 | 1994 | $1,600 | $0.80 | 21d | 1 | 1.10mi |
| 2140 Rexford Rd Montgomery, AL | 2.0 | 2.5 | 1428 | $1,275 | $0.89 | 43d | 1 | 1.11mi |
| 5540 Ash Grove Cir Montgomery, AL | 4.0 | 2.0 | 1904 | $2,200 | $1.16 | 21d | 1 | 1.15mi |
| 5635 Red Barn Rd Unit 1043848P Montgomery, AL | 3.0 | 2.0 | 1496 | $3,390 | $2.27 | 13d | 1 | 1.24mi |
| 6037 Monticello Dr Montgomery, AL | 1.0–2.0 | 1.0–2.0 | 974 | $1,025 | $1.05 | 13d | 3 | 1.27mi |
| 2000 Central Pkwy Montgomery, AL | 1.0–3.0 | 1.0–2.0 | 1133 | $2,135 | $1.88 | 13d | 14 | 1.34mi |
| 2420 Haddington Rd Unit 1519890P Montgomery, AL | 4.0 | 1.0 | 1679 | $4,483 | $2.67 | 13d | 1 | 1.44mi |
Listing history 9 events
-
2026-06-02days on market $157,000 Active 15 DOM
-
2026-06-01days on market $157,000 Active 14 DOM
-
2026-05-31days on market $157,000 Active 13 DOM
-
2026-05-30days on market $157,000 Active 12 DOM
-
2026-05-17$157,000 Active
-
2001-07-27soldstatus $108,500 321-char remark
Show marketing remark (321 chars)
GORGEOUS PATIO HOME WITH A GREAT LOT. MUST SEE. DECORATED LIKE MODEL HOME GRT ROOM W/ FIREPLACE. DINING AREA, KITCHEN LOOKS INTO DINING AREA AND CAN BE EAT IN KITCHEN. MASTER W/ LARGE CLOSET & BATH. PRIVACY FENCE. DOG RUN AREA TOO. NICE STORAGE BUILDING. EXISTING HOME WARRANTY AHS WILL TRANSFER TO BUYER AT CLOSING
-
2001-04-24$110,850 321-char remark
Show marketing remark (321 chars)
GORGEOUS PATIO HOME WITH A GREAT LOT. MUST SEE. DECORATED LIKE MODEL HOME GRT ROOM W/ FIREPLACE. DINING AREA, KITCHEN LOOKS INTO DINING AREA AND CAN BE EAT IN KITCHEN. MASTER W/ LARGE CLOSET & BATH. PRIVACY FENCE. DOG RUN AREA TOO. NICE STORAGE BUILDING. EXISTING HOME WARRANTY AHS WILL TRANSFER TO BUYER AT CLOSING
-
2000-09-18soldstatus $105,000 255-char remark
Show marketing remark (255 chars)
SPECTACULAR GARDEN HOME IN WOODMERE. MUST SEE THIS HOME TO BELIEVE. BUILT BY LOEB & HANNA. HIGE BACKYARD THAT IS FENCED. TALL CEILINGS AND TASFUL COLORS THAT ABOUND IN THIS HOME. PLEASE CALL FIRST, IF NO ANSWER THEN SHOW. YOU WILL BE AMAZED. THANKS!
-
2000-06-23$107,900 255-char remark
Show marketing remark (255 chars)
SPECTACULAR GARDEN HOME IN WOODMERE. MUST SEE THIS HOME TO BELIEVE. BUILT BY LOEB & HANNA. HIGE BACKYARD THAT IS FENCED. TALL CEILINGS AND TASFUL COLORS THAT ABOUND IN THIS HOME. PLEASE CALL FIRST, IF NO ANSWER THEN SHOW. YOU WILL BE AMAZED. THANKS!
ⓘ Source: listings_history table (triggers on properties + properties_extension) + one-shot
backfill from property_details.listing_events for pre-trigger history.
Tax reassessment forecast AL · Resets to sale price
- Current annual tax
- $713 · $59/mo
- Projected year-2 tax
- $713 · $59/mo
- Expected delta
- $0/yr ($0/mo · 0.0%)
ⓘ Screening estimate from a state-policy table — verify with the county assessor before closing.
Climate risk First Street
- Flood 1/10 Low FEMA zone X (unshaded) · 0% chance over 30 yrs
- Wildfire 3/10 Moderate
- Heat 8/10 Severe 7 d/yr ≥108°F today · 20 d/yr by 30 yrs out
- Wind 6/10 Major 77% chance of damaging wind over 30 yrs
- Air quality 2/10 Low 1 unhealthy d/yr today · 3 by 30 yrs out
Nearby sold comps map
Loading sold comps map…
Walkable amenities ~0.75 mi
Loading nearby amenities…
Taxation est. · year 1
- Rental income
- $19,007
- − Mortgage interest
- −$8,794
- − Property taxes
- −$713
- − Insurance
- −$785
- − Repairs & maintenance
- −$1,521
- − Management
- −$1,521
- − Depreciation
- −$4,567
- Taxable income
- $1,106
- Est. tax owed @ 24.0%
- −$265
- After-tax cash flow
- $3,372/yr
For passive investors: Depreciation is non-cash, so a rental often shows a tax loss while cash-flowing — sheltering income. Rental losses are passive: they offset passive income freely, and up to $25,000/yr can offset ordinary (W-2) income if you actively participate and your MAGI is under $100k (phasing out to $0 by $150k); unused losses carry forward. On sale, claimed depreciation is recaptured at up to 25%, and gains may owe capital-gains tax (a 1031 exchange can defer both). Figures are a year-1 estimate at your 24.0% rate — not tax advice; consult a CPA.
Schools (NCES district)
- District
- Montgomery County
- NCES district ID
- 0102430
- Math proficiency
- 9% ▼ -21.00%
- Reading proficiency
- 31% ▼ -1.00%
- Median HH income
- $43,902
- Composite
- 17.24/100
- National rank
- #9093
- State rank
- #106 of 129 in AL
Livability — Montgomery
- Score
- 65/100
- State rank
- #138
- US rank
- #13416
Category grades
Schools grade is shown separately in the Schools card above.
Census & demographics
- Census place
- Montgomery, AL
- County
- Montgomery County · 190,016 people
- City population
- 175,913
- Metro
- Montgomery, AL
- Population (ZIP)
- 53,172
- Household income
- $74,720
- Rent vs Own
- Severe rent burden
- 1742.0
Population outlook (Montgomery County) Hauer SSP2
- Today (2025)
- 224,008 people
- By 2030
- 221,460 · -1.1%
- By 2040
- 214,179 · -4.4%
- By 2050
- 204,912 · -8.5%
- By 2075
- 177,821 · -20.6%
- By 2100
- 145,134 · -35.2%
Race, ethnicity, and origin ACS 2023
- Neighborhood character
- Diverse neighborhood (Simpson 0.60)
- Race & ethnicity
- Black 53% White 34% Asian 8% Two or more races 3% Hispanic / Latino 3%
- Common ancestry
- Italian 1% Slovak 1% Lithuanian 1%
- Foreign-born
- 9% · South Korea, Canada, China
- Languages at home
- 90% English-only · Korean 4% Spanish 3% Other Indo-European 1%
Political lean MEDSL · Montgomery
- 2024 margin
- Solid D (+30.7) · D 64.8% · R 34.1% · Other 1.1%
- 2008→2024 swing
- +11.5pp toward D · 2008: 19.2pp · 2024: 30.7pp
- All cycles
- 2024: D+30.7 2020: D+31.5 2016: D+26.2 2012: D+24.3 2008: D+19.2
Not yet ingested
- Civics
- —
Market trends
- HPI YoY
- ▼ -37.24%
- Current HPI
- 148.7728
- Rent YoY
- ▲ 2.99%
- Metro
- Montgomery, AL
- State GDP YoY
- ▲ 2.94%
- F500 in state
- 4
Industry mix (Fortune 500 HQ in AL)
| Industry | F500 HQs | Revenue |
|---|---|---|
| Financial Services | 1 | $8B |
|
||
| Healthcare | 1 | $5B |
|
||
Price history
+45.5% since first listed5 events — show timeline
- 2026-05-17 Listed $157,000 MAAR
- 2001-07-27 Sold (MLS) $108,500 MAAR
- 2001-04-24 Listed $110,850 MAAR
- 2000-09-18 Sold (MLS) $105,000 MAAR
- 2000-06-23 Listed $107,900 MAAR
Property tax history
+5.5%/yrLatest (2025): $713 · -1.3% YoY. Source: county tax records.
Cash-flow waterfall
monthlySold comps — $/sqft
last 12 mo · ≤1 miLoading sold comps…